Empirical research to identify early warning indicators of insolvency in small and medium-sized enterprises (SMEs)
ABSTRACT
In Europe, the contribution of SMEs is enormous in terms of job creation and added value, although in recent years worrying levels of business failure and disappearance have occurred. These circumstances have led various researchers and international organisations to recognise the need for indicators that will enable the early detection of insolvency risks so that preventive and corrective measures can be taken. In this context, Directive (EU) 2019/1023 obliges EU Member States to define early warning indicators of insolvency, and in most cases has been transposed into the respective national regulations. The present paper aims to identify financial and non-financial indicators of insolvency risks in SMEs, to facilitate early detection. To this end, we analyse a sample of 1,736 Spanish SMEs, studying their behaviour for the period 2010-2020. Certain financial and non-financial factors are identified as early warning indicators of insolvency, a result that will prove useful both for the self-diagnosis of insolvency and for the design of restructuring plans to enhance SMEs’ chances of survival.
Keywords: Insolvency; Early warning indicators; Business failure; Survival; SMEs; Directive (EU) 2019/1023.
JEL classification: C45; D22; G33.
Investigación empírica para identificar indicadores de alerta temprana de insolvencia en pequeñas y medianas empresas (PYMEs)
RESUMEN
En Europa, la contribución de las PYMEs es enorme en términos de creación de empleo y valor añadido, aunque en los últimos años se han producido preocupantes niveles de quiebra y desaparición de empresas. Estas circunstancias han llevado a diversos investigadores y organismos internacionales a reconocer la necesidad de contar con indicadores que permitan detectar precozmente los riesgos de insolvencia para poder adoptar medidas preventivas y correctoras. En este contexto, la Directiva (UE) 2019/1023 obliga a los Estados miembros de la Unión Europea a definir indicadores de alerta temprana de insolvencia, y en la mayoría de los casos ha sido transpuesta a las respectivas normativas NACIONALES. El objetivo del presente trabajo es identificar indicadores financieros y no financieros de riesgos de insolvencia en las pymes, para facilitar su detección temprana. Para ello, se analiza una muestra de 1.736 PYMEs españolas, estudiando su comportamiento para el periodo 2010-2020. Se identifican determinados factores financieros y no financieros como indicadores de alerta temprana de insolvencia, un resultado que resultará útil tanto para el autodiagnóstico de insolvencia como para el diseño de planes de reestructuración que mejoren las posibilidades de supervivencia de las PYMEs.
Palabras clave: Insolvencia; Indicadores de alerta rápida; Fracaso empresarial; Supervivencia; PYME; Directiva (UE) 2019/1023.
Códigos JEL: C45; D22; G33.
1. Introduction
In Europe, small and medium-sized enterprises (SMEs) represent by far the largest part of the business fabric (99.80%), creating jobs (64.40%) and contributing significant added value to the economy (52.40%) (EUROSTAT, 2022). This composition is generally similar throughout the European Union (Ministry of Industry, Trade and Tourism, 2019). In Spain, SMEs account for 99.82% of all companies, generate 64.22% of employment and contribute 62.00% of added value (DGPYME, 2022).
However, across Europe, the business failure rate for SMEs is quite high, as indicated by the fact that 50% of new enterprises do not exceed five years of life (EUROSTAT, 2022). Over the last few years, more than 200,000 small businesses in Europe have been declared bankrupt each year, which justifies the need to investigate the explanatory factors of insolvency and the early warning systems and indicators that may provide timely identification of its causes, so that steps may be taken to prevent it (Carvalho et al., 2020; Gurrea-Martínez, 2021; Moyi, 2019; Rico et al., 2021) and to better enhance survival chance of companies under financial distress (Rojo-Ramírez & Diéguez-Soto, 2022).
In the same vein, international bodies such as the World Bank (2018, 2017), the United Nations Commission for International Trade Law (UNCITRAL, 2019) and Accountancy Europe (2021, 2020), as well as professional organisations (AECA, 2022; KPMG, 2019), recommend designing more dynamic and complex indicators and predictive models, to allow insolvency risks to be managed with a greater degree of accuracy, in real-time and sufficiently in advance.
In parallel, Directive (EU) 2019/1023 requires Member States’ authorities to ensure that companies have clear and transparent early warning tools to detect circumstances that may lead to imminent insolvency and to alert them of the need to act without delay. Currently, most Member States (Denmark, Germany, Estonia, Ireland, Greece, Spain, France, Croatia, Italy, Lithuania, Hungary, Austria, Portugal, Romania, Slovenia, Slovakia, Finland and Sweden) have adopted national measures transposing this Directive (EUR-Lex, 2022). In Spain, Law 16/2022, of 5 September, reforming the Consolidated Text of the Insolvency Law, has established insolvency procedures, an important feature of which is the incorporation of restructuring plans based on early warning indicators of insolvency, in line with Directive (EU) 2019/1023.
In clear harmony with this economic and regulatory context, the prediction of corporate insolvency has been a topic of interest for researchers for many years. Since Altman’s Z-Score model (Altman, 1968), numerous prediction models have been developed. Most are based on classical parametric techniques such as discriminant analysis, logistic regression and probit analysis, while others incorporate non-parametric techniques like artificial intelligence or machine learning (Tam & Kiang, 1992; Altman et al., 1994; Lee et al., 1996; Pan, 2012; Ptak-Chmielewska, 2021). However, the recent global crisis triggered by COVID-19 has impacted very significantly on the financial health of most SMEs, forcing them to base their chances of survival on recovery plans which, by their very nature, often lack historical financial indicators with sufficient predictive value (Ciampi et al., 2021). This implies the need for readily available tools that, in the current context, can help SMEs in the early warning and prevention of insolvency situations (AECA, 2022; Accountancy Europe, 2021; Gant, 2021).
Traditional insolvency prediction models have mainly been based on samples of large firms (Altman, 1968; Alaminos et al., 2016), but their accuracy levels have proven to be rather low when applied to SMEs (Ciampi, 2015). Moreover, most studies use only quantitative variables as predictors of insolvency, especially financial ratios (Altman et al. 2020; Baixauli & Modica-Milo, 2010; Calabrese et al., 2016; Castillo et al., 2018; Ciampi & Gordini, 2013; Gupta et al., 2014a, 2014b; Yazdanfar, 2011). Although some papers have specifically considered SMEs in individual countries (Kiss et al., 2021 in Hungary, Lisboa et al., 2021 in Portugal, Yazdanfar & Öhman, 2020 in Sweden, and Tobback et al., 2017 in Belgium and the UK), they did not analyse certain factors that are currently very relevant in the current socio-economic context of countries like Spain. These include the sector of activity concerned, the degree of exporting activity involved, the legal form of the company or its consumption of non-current assets, because they can influence the economic and financial structure of the company, affect its financial capacity and condition the generation of financial resources and cash flows (Cultrera & Brédart, 2016; Ptak-Chmielewska, 2021; Rojo-Ramírez & Diéguez-Soto, 2022; Subdirectorate General for Studies and Evaluation of Trade Policy Instruments, 2022).
Given these considerations, it is necessary to improve the accuracy of default prediction specifically for SMEs, by using non-financial information and incorporating some variables which have not previously been analysed (Gallucci et al., 2022; Rico et al., 2021; Kiss et al., 2021). Indeed, some researchers have highlighted the need to build default prediction models adapted to the specific problems of SMEs, based on qualitative information in addition to traditional financial ratios (Ciampi 2015, 2018; Norden & Weber, 2010).
However, at the EU level, few studies have attempted to address this research need. Yazdanfar & Öhman (2020) combined two categories of variables, using a sample of 3,865 Swedish SMEs and information for the years 2008-2015; Kiss et al. (2021) combined two categories of variables, using a sample of 2,969 Hungarian firms and information for the years 2008-2019; other studies, by Ciampi (2018) and Gallucci et al. (2022), used two or three categories of variables, in a sample of one or two financial years, for 382 and 973 Italian SMEs, respectively.
Among studies of Spanish SMEs, interesting contributions have been made, but dedicated to specific areas of activity. For example, Gómez-Miranda et al. (2008) focused on the industrial sector, using two categories of variables in a sample of 364 SMEs with information relating to three fiscal years; and Acosta-González et al. (2019) studied the construction sector, using two categories of variables and information from 1995 to 2011. Moreover, in Spain, the study samples considered mostly contain medium-sized firms, with very little specific weight of small firms (Campillo et al., 2013).
In summary, previous research has mainly focused on large companies, analysing quantitative variables, and more specific studies of SMEs are currently necessary, with a good representation of small companies, operating in different sectors of activity, represented via different types of variables (financial and non-financial) and located in countries with a high degree of company mortality, as is the case of Spain.
In view of the above motivations, this paper aims to identify explanatory indicators of financial insolvency in SMEs, which provide early warning, facilitate self-diagnosis and help prevent situations of insolvency. To this end, we analyse 35 variables (28 quantitative and 7 qualitative), corresponding to 1,736 Spanish SMEs, of which 1,589 are classed as small, operating in various sectors of activity, during the period 2010-2020.
2. Data and variables
2.1. Sample selection
This empirical study was carried out in Spain, for several reasons. Firstly, Spanish SMEs constitute a fundamental part of the national economy, contributing to local, regional and national development, and play a vital role in the creation of employment and wealth. According to data published by the General Directorate of Industry and Small and Medium-Sized Enterprises (Ministry of Industry, Trade and Tourism) (DGPYME, 2022), SMEs represent 99.82% of Spanish business activity and 64.22% of the employment generated in the private sector, compared to 48.40% on average in the European Union countries (EUROSTAT, 2022). Secondly, in Spain, SMEs are the main engine of private sector growth, both in disadvantaged areas and in the most developed regions, as they contribute 62% of added value, well above the 52.4% average recorded in the European Union (EUROSTAT, 2022). In addition, as shown in Table 1, Spanish SMEs represent 11.46% of the total number of SMEs in the European Union, only behind Italy and France. Furthermore, as can be seen, the specific weight of SMEs in Spain is very similar to that of other countries (Italy, France, Germany and Netherlands). So, our results may be interesting for SMEs outside of Spain.
Table 1. The specific weight of SMEs in European countries
| SMEs on total EU | SMEs in total country | |
|---|---|---|
| European Union | 100,00% | 99,82% |
| Italy | 15,55% | 99,90% |
| France | 13,17% | 99,84% |
| Spain | 11,46% | 99,87% |
| Germany | 10,58% | 99,56% |
| Netherlands | 5,82% | 99,86% |
Source: Eurostat (2022).
Thirdly, Spanish SMEs present a high failure rate during their first years of activity. Official statistics indicate that, on average, 61.5% of new Spanish companies do not exceed five years of life and total life expectancy is just 10.8 years. The corresponding values for all EU countries are 50% and 19.6 years (CEPYME, 2021).
The study sample included 1,736 Spanish SMEs. The analysis examined financial and non-financial information for the period 2010-2020, extracted from the Official Mercantile Registries where these companies are required to deposit their accounts. Of these companies, 991 (57.08%) were placed in insolvency proceedings (i.e., a legal situation of insolvency was declared by a judicial authority) at some time during the period 2010-2020, compared to 745 companies (42.92%) that did not undergo this procedure.
Identification and segmentation of these data enabled us to employ the comparative sample method to identify the variables (financial and non-financial) associated with insolvency, in line with previous research in this area by authors such as Ciampi (2015), Alaminos et al. (2016) and Cultrera & Brédart (2016). Moreover, the segments obtained are representative of the diversity of activity sectors in which these SMEs operated, as shown by the distribution presented in Table 2.
Table 2. Sectoral distribution of the sample
| SECTORS | NO. OF COMPANIES | PERCENTAGE |
|---|---|---|
| Agriculture | 18 | 1.04% |
| Industry | 471 | 27.13% |
| Services | 972 | 55.99% |
| Construction | 275 | 15.84% |
| Total | 1,736 | 100% |
To select the sample, we used the definition of SMEs established in Royal Decree 1515/2007, of November 16, 2007, which approved the General Accounting Plan for Small and Medium-Sized Companies and stipulated the accounting criteria to be employed for micro-companies. According to this legislation, SMEs are companies that, regardless of their legal form, comply with at least two of the following limits for two consecutive years: a) total assets not exceeding four million euros; b) net turnover not exceeding eight million euros; c) average number of employees not exceeding fifty.
2.2. Dependent variable
In this empirical study, the dependent or explained variable is taken as the legal declaration of insolvency. Although Law 16/2022 is currently in force, we have taken the legal regulation of insolvency established in Royal Legislative Decree 1/2020, of May 5, approving the Consolidated Text of the Insolvency Law, because this was the regulation in force during the study period (2010-2020).
According to the latter regulation, a company is in a legal state of insolvency when it cannot regularly meet its payment obligations. The company must be placed in insolvency proceedings by a judicial authority when at least one of the conditions in Table 3 is met.
Table 3. Conditions for the legal declaration of insolvency
| CONDITION | DEFINITION |
|---|---|
| 1 | The existence of a previous judicial or administrative declaration of insolvency of the debtor, provided that it is final. |
| 2 | The existence of a title for which a writ of execution or levy of execution has been issued without the seizure of obtaining liquid assets sufficient for payment. |
| 3 | The existence of attachments for executions in progress that affect the debtor’s assets in a generalised way. |
| 4 | The generalised failure to pay the debtor’s current obligations. |
| 5 | The generalised failure to pay the tax obligations due during the three months before the request for insolvency proceedings; that of social security contributions and related concepts during the same period, or that of workers’ salaries and compensation and other retributions derived from the employment relationship corresponding to the last three monthly payments. |
| 6 | The hasty or ruinous liquidation of the debtor’s assets by the debtor. |
This definition of the dependent variable is appropriate for our study for several reasons. First, when companies receive the legal declaration of insolvency, they are generally in a situation of extreme insolvency and vulnerability. As in countries such as Italy, France and the UK, a high percentage of Spanish companies in this situation (93%) do not survive and pass through bankruptcy and liquidation (García-Posada & Vegas-Sánchez, 2018). Second, the legal declaration of insolvency is an objective and reliable measure, since it is based on mandatory legal criteria for all companies. Third, similar measures of insolvency status have been used by other researchers in this field, such as Gallucci et al. (2022), who studied Italian SMEs using the legal definition in that country, Romero et al. (2021), who took the legal declaration of insolvency applicable to Spanish cooperatives, and Kou et al. (2021) and Ptak-Chmielewska (2021), who assessed insolvency using the legal status of default.
In this empirical study, therefore, the dependent or explained variable \(Y_{it}\) is defined following Royal Legislative Decree 1/2020, as a dichotomous variable with the value 1 if the SME has been legally declared insolvent at time t, or the value 0 otherwise:
\[\begin{equation*} \small Y_{it} = \left\{\begin{matrix} 1 \hspace{0.5cm} \text{if SME i is in statutory declaracion of insolvency at time t } \\ \ \\ 0 \hspace{0.4cm} \text{if SME i is not in statutory declaration of insolvencyat time t} \end{matrix}\right. \end{equation*}\]2.3. Independent variables
Table 4 shows the independent variables jointly analysed in this paper, with their descriptions and the expected sign of the relationship between the explanatory variable and the judicial declaration of insolvency. Following previous literature, we analyse both non-financial and financial variables (Benito & Martínez, 2002; Acosta et al., 2019; Fernández-Gámez et al., 2020; Kou et al., 2021).
The first of the non-financial variables considered is the age of the company (X1). Previous studies of insolvency prediction have found this variable to be significant, with a negative sign. See, for example, Cultrera & Brédart (2016), who studied 7,152 Belgian SMEs for the period 2002-2012, Tobback et al. (2017), who analysed Belgian and English firms for the period 2011-2014, and Ma’aji et al. (2019), who studied 176 Malaysian SMEs for the period 2000-2012. However, Ptak-Chmielewska (2021) did not find this variable significant in their study of 806 Polish SMEs. We expect a negative sign for this variable, in the view that greater age of the company would be associated with longer experience and greater financial competence of the managers.
The second variable considered was the number of employees (X2). Although Ptak-Chmielewska (2021) did not find this variable significant, we believe it may affect the legal insolvency situation because with more employees, fixed costs will be higher and the firm will have less financial capacity. Therefore, we expect a positive sign for this variable.
In addition, we consider categorical variables, which are awarded the value of 0 or 1. Regarding variable X3 (Sector of activity), some previous research papers found no evidence of its influence on insolvency and bankruptcy. This is the case of Fernández-Gámez et al. (2020), who studied 42,398 non-financial firms in 28 European countries, Alaminos et al. (2016), who analysed 440 firms in Asia, Europe and America, and Ptak-Chmielewska (2021). However, Cultrera & Brédart (2016) concluded that the activity sector in question does affect insolvency. We believe this variable may be significant in Spain because some of the characteristics of the firm, such as its economic and financial structure or the importance of some expenses, may be determined by the sector in which it operates, which can condition the volume of investments, its useful life and its form of financing (Rodríguez-Ariza et al., 2022).
Another categorical variable is the legal form adopted by the firm (X4). Although this variable has received little previous research attention, it may affect the company’s financial capacity and requirements such as debt guarantees. Ptak-Chmielewska (2021) concluded that limited liability status is not significantly associated with insolvency, but that other legal forms may be.
Finally, in this area, we include some variables that have not been addressed in previous literature on insolvency but which may be of interest. Firstly, the question of whether a company is a major exporter or importer (X5), given the current instability of the world economy, may impact its risk of insolvency. In this case, we expect the sign of the relationship to be positive. Similarly, the number of court cases in which the firm is involved (X6) would be positively associated with the probability of the firm being declared insolvent. Finally, although a manager should always act with prudence when making decisions (OECD, 2015), this quality is normally heightened when the company has large numbers of shareholders; in consequence, we expect the sign of this variable (X7) to be negative.
In line with previous research, we group the financial variables into five types: turnover, profitability, debt repayment capacity, economic-financial structure, solvency and capacity to generate funds. Among these, Asset turnover (X10) has been analysed by Alaminos et al. (2016), who reported that the influence of this variable is significant three years before insolvency, since the higher the turnover, the greater the possibility of bankruptcy. However, it is not influential for periods closer to the declaration of insolvency. On the other hand, Lisboa et al. (2021), who studied the risk of default in 2,658 Portuguese SMEs for the period 2012-2017, found a negative sign for this variable, while Ma’aji et al. (2019) and Ptak-Chmielewska (2021) concluded that it is not significant. To our knowledge, no previous studies in this field have incorporated the other variables in this group (X8, Inventory turnover, X9, Cash turnover, and X11, Non-current asset turnover). We have selected them for analysis because in each case a rise in the value may favour the generation of financial resources and cash flow, thus increasing the firm’s ability to pay. Thus, we expect a negative sign for these variables.
The second group of financial variables are those related to the firm’s profitability. The variable X12 (Economic profitability) has been studied by Cultrera & Brédart (2016), who found a negative relationship with bankruptcy, and by Tobback et al. (2017) and Acosta et al. (2019), who obtained a similar result in a study of 1,680 Spanish firms in the construction sector for the period 1995-2011. However, other papers on Spanish and Italian SMEs (Fernández-Gámez et al., 2020; Gallucci et al., 2022) have found no evidence of an effect of profitability on the risk of default. The variable X14 (Financial profitability) has been considered in previous literature by Acosta et al. (2019), Fernández-Gámez et al. (2020) and Gallucci et al. (2022), all of whom found no evidence supporting the influence of this variable.
The variable X15 (EBITDA/Sales revenue) has been analysed by Fernández-Gámez et al. (2020), who found a negative sign, and also by Gallucci et al. (2022), who obtained the opposite finding in their study of Italian SMEs. Ma’aji et al. (2019) reported that an increase in the variable X16 (Sales revenue/Equity) was associated with a reduced risk of insolvency.
In addition to the above, we also analysed X13 (Operating profitability), a variable which has not been addressed in previous research, although it may affect the firm’s ability to pay. For this variable and also for profitability, we expect negative signs, in the view that an increase in profitability may be an indicator of resource generation and cash flow with which to meet debt repayment obligations.
A third group of variables (X17 to X22) consists of those representing debt repayment capacity. Of these, only X17 (EBIT/Financial expenses) and X19 (Specific weight of the financial burden), have been analysed in previous research (by Acosta et al., 2019 and by Gallucci et al., 2022, respectively). In neither case was there any evidence of a significant association. The cost of capital is an important benchmark of technical solvency (AECA, 2022). We included this set of variables because their evolution may affect the firm’s ability to pay, according to the loan conditions agreed. We expect to obtain a negative sign for X17 (EBIT/Financial expenses) and X18 (EBITDA/Financial debt) and a positive one for X19 to X22 (Specific weight of the financial burden, Financial expenses/Total assets, Financial expenses/Sales revenue, Financial expenses/Profit (Loss) for the period). In the variable X19, the numerator is formed by the annual repayment instalment, as the sum of the repayment of the loan and the interest.
The fourth group of variables concern the economic and financial structure of the company. X23 (Level of indebtedness) has been used by Alaminos et al. (2016), who found it to be significant and with a positive sign for predicting bankruptcy in European firms. It was also used by Acosta et al. (2019) in a study of Spanish firms, but in this case the association was not significant. Variables X24 (Debt structure by origin) and X25 (Debt structure by maturity) have not been used previously. They are included here because variations in this respect might influence the generation of cash with which to service debt payments. X26 (Current assets/Total assets), on the other hand, has been analysed in previous studies, according to which this variable is associated with the risk of insolvency (Acosta et al., 2019; Cultrera & Brédart, 2016; Fernández-Gámez et al., 2020). We expect a positive sign for variables X23, X24 and X25 because they may be related to increases in default risk, but a negative one for X26 because in this case an increase might favour the short-term availability of cash.
The fifth group of variables (X27 to X32) reflect the solvency of the firm. X27 (Current assets/Current liabilities) has been analysed by Fernández-Gámez et al. (2020), who found a significant negative association for this variable. On the other hand, Tobback et al. (2017), Acosta et al. (2019) and Ptak-Chmielewska (2021) all detected no evidence in this respect. A similar lack of significance was reported by Ptak-Chmielewska (2021) for X28 (Cash and cash equivalents/Current liabilities) and by Acosta et al. (2019) for X30 (Current assets - inventories /Current liabilities). In contrast, Alaminos et al. (2016), Cultrera & Brédart (2016) and Lisboa et al. (2021) obtained evidence of a significant negative relationship between X31 (Reserves/Total assets) and the risk of insolvency.
Although variables X29 and X32 have not been analysed previously in this context, we believe they merit attention because their evolution may indicate the future behaviour of cash flows and hence the capacity to service debt obligations.
We expect a negative sign for all the variables in this group, as any increase in these ratios would reflect a greater capacity to repay debts, thereby helping avoid insolvency.
Finally, the sixth group of variables refers to the firm’s ability to generate resources (X33 to X35). X33 (Cash flow from operations/Sales revenue) has previously been used by Acosta et al. (2019) and by Gallucci et al. (2022). In both cases, the variable was found to be non-significant. The variable X34 ((Amortisation-Depreciation)/EBIT) was used by Fernández-Gámez et al. (2020), who found it to be significant with a negative sign. Finally, X35 ((Amortisation and Depreciation)/Sales Revenue) has not been used in previous research, but we believe it may influence insolvency risks because amortisation and depreciation expense can be seen as part of the firm's maintenance self-financing capacity and, therefore, the higher their relative weight in sales revenue, the higher the financial possibilities arising from the recovery of non-current assets. This greater capacity could imply less need for external financing and, therefore, a higher level of solvency. For this group of variables, the expected sign is negative in every case, since the greater the firm’s capacity to generate resources, the lower the possibility it will later be declared insolvent.
Table 4. Independent variables
| Variables | Name | Description | Expected sign |
|---|---|---|---|
| NON-FINANCIAL VARIABLES | |||
| X1 | Age of the company | Years elapsed since its foundation to the financial year of the accounts | - |
| X2 | Number of employees | Number of employees in the financial year of the accounts | + |
| X3 | Sector of activity | 0 - Agriculture 1 - Industry 2 - Services 3 – Construction | |
| X4 | Legal form | 0 - Cooperative 1 – Limited liability company 2 – Corporation | |
| X5 | Foreign trade | 0 - No 1 – Yes | + |
| X6 | Number of court cases | Number of court cases in the financial year of the accounts | + |
| X7 | Number of shareholders | Number of shareholders in the financial year of the accounts | - |
| FINANCIAL VARIABLES | |||
| TURNOVER | |||
| X8 | Inventory turnover | Consumption of goods / Stocks of goods | - |
| X9 | Cash turnover | Sales revenue / Cash and cash equivalents | - |
| X10 | Asset turnover | Sales revenue / Total assets | - |
| X11 | Non-current asset turnover | Sales revenue / Non-current assets | - |
| PROFITABILITY | |||
| X12 | Economic profitability | Earnings before interest and taxes / Total assets | - |
| X13 | Operating profitability | Net operating profit / Operating assets | - |
| X14 | Financial profitability | Profit (loss) for the period / Shareholders’ equity | - |
| X15 | EBITDA / Sales revenue | EBITDA / Sales revenue | - |
| X16 | Sales revenue / Equity | Sales revenue / Equity | - |
| DEBT REPAYMENT CAPACITY | |||
| X17 | EBIT / Financial expenses | EBIT / Financial expenses | - |
| X18 | EBITDA / Financial debt | EBITDA / Financial debt | - |
| X19 | Specific weight of the financial burden | Annual Repayment instalment / Sales revenue | + |
| X20 | Financial expenses / Total assets | Financial expenses / Total assets | + |
| X21 | Financial expenses / Sales revenue | Financial expenses / Sales revenue | + |
| X22 | Financial expenses / Profit (loss) for the period | Financial expenses / Profit (loss) for the period | + |
| ECONOMIC AND FINANCIAL STRUCTURE | |||
| X23 | Level of indebtedness | (Current liabilities + non-current liabilities) / Equity | + |
| X24 | Debt structure by origin | Financial debt / Commercial debt | + |
| X25 | Structure of debt by maturity | Current liabilities / non-current liabilities | + |
| X26 | Current assets / Total assets | Current assets / Total assets | - |
| SOLVENCY | |||
| X27 | Current assets / Current liabilities | Current assets / current liabilities | - |
| X28 | Cash and cash equivalents / current liabilities | Cash and cash equivalents / current liabilities | - |
| X29 | Cash and cash equivalents / (current liabilities + non-current liabilities) | Cash and cash equivalents / (current liabilities + non-current liabilities) | - |
| X30 | (Current assets - Inventories) / Current liabilities | (Current assets - Inventories) / current liabilities | - |
| X31 | Reserves / Total assets | Reserves / Total assets | - |
| X32 | (Current assets – current liabilities) / (Current liabilities + non-current liabilities) | (Current assets – current liabilities) / (Current liabilities + non-current liabilities) | - |
| CAPACITY TO GENERATE FUNDS | |||
| X33 | Cash flow from operations / Sales revenue | Cash flow from operations / Sales revenue | - |
| X34 | (Amortisation and Depreciation) / EBIT | (Amortisation and Depreciation) / EBIT | - |
| X35 | (Amortisation and Depreciation) / Sales revenue | (Amortisation and Depreciation) / Sales revenue | - |
3. Statistical methodology
3.1. Logistic regression model
In line with the Basel regulations (BCBS, 2017), our logistic regression model starts from the concept of the Ability-to-Pay Process (APP), which measures the capacity of SMEs to meet their payment obligations. APP is a factor or magnitude that depends on the quality of assets and financial resources, and is a latent random variable that is not directly observable. Instead, it is estimated by nonlinear discrete choice probit or binary logit models.
Taking as a dependent variable the legal declaration of insolvency, the credit risk factors that influence the probability of default or financial insolvency are defined as Xi, such that APPi is a linear combination of the explanatory variables of the event according to the following expression:
\[Y_{it} = \alpha + \sum_{i = 1}^{N}{\beta_{i}{X}_{i}} + \mu_{i} \\ \ \ \ \ \ \ i = 1\ldots\ldots\ N,\ \ t = 1\ldots\ldots T\]
In this equation, βi represents the parameters or estimators of the corresponding independent or explanatory variables, and µi represents the remaining effects associated not only with individual heterogeneity but also with periods. \(PD\left( APP_{i} \leq c_{i} \middle| X_{i} \right)\) is then estimated as the probability of the company becoming financially insolvent through the legal declaration of insolvency, which is expressed as:
\[PD\left( APP_{i} \leq c_{i} \middle| X_{i} \right) = \frac{e^{\widehat{\alpha} + \sum_{i = 1}^{N}{{\widehat{\beta}}_{i}{X}_{i}}}}{{1 + e}^{\widehat{\alpha} + \sum_{i = 1}^{N}{{\widehat{\beta}}_{i}{X}_{i}}}}\]
3.2. Artificial neural network model
Neural networks are self-adaptive models based on computational theory. They are widely used in the financial industry to analyse complex nonlinear economic and financial relationships. Taking into consideration the characteristics of our sample database, we constructed a three-layer multilayer perceptron (MLP) neural network (Figure 1) as a function of the predictors obtained, representing the independent variables that minimise the prediction error of the output or dependent variable. This is the reference procedure for nonparametric models or techniques. The first layer of the network has as many neurons (nodes) as there are independent variables in the model. The hidden layer has nodes that connect the input and output layers indirectly using a set of weights that are similar to synaptic connections. The central element in the artificial neural network model is the neural processing unit or neuron located in the hidden layer, whose size is denoted as H. This hidden layer is where the optimal connection weights are determined, through the learning algorithm established in the network. Here, we distinguish {vih, i=0,1,2,...,p, h=1,2,...,H} as the synaptic weights for the connections between the p-size input and the hidden layer, and {wh, h=0,1,2,...,H} as the synaptic weights for the connections between the hidden nodes and the output node.
Figure 1. Three-layer Multilayer Perceptron
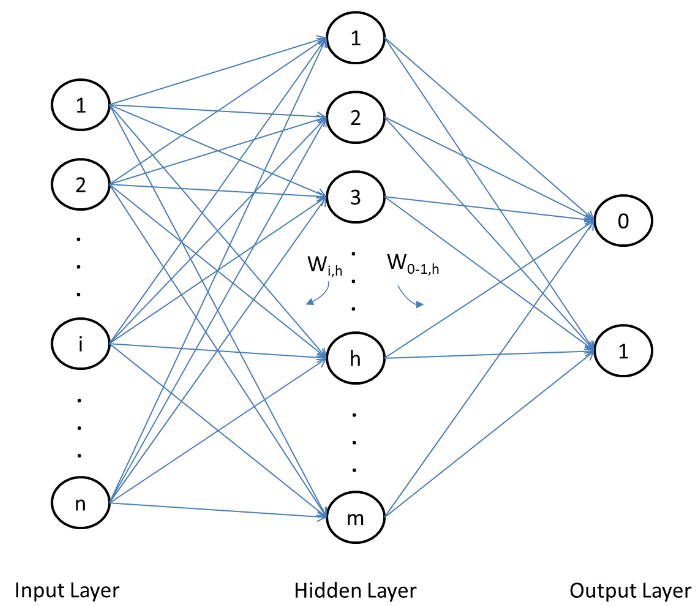
In this analysis, we employ a sigmoid activation function, calculated in the same way as the logit function used in the logistic regression model, and also in the hidden layer of the MLP This function takes real-valued arguments and transforms them into the range (0,1) under
\[g\left( u \right) = \frac{e^{u}}{e^{u} + 1}\]
The output layer contains the target (dependent) variables. The activation function relates the weighted sum of units in one layer to the values of those in the correct layer, taking a vector of real-valued arguments and transforming it into a vector with elements in the range (0, 1) and which have a sum of 1.
Considering all of the above, the output of the neural network from a vector of inputs (x1,…,xp) is:
\[ \hat{y} = g \left ( w_0 + \sum_{h=1}^{H} w_{h} g (v_{0h} + \sum_{j=1}^{p} v_{ih} x_{j}) \right ) \]
The output of this model provides an estimate of the probability of the SME being legally declared insolvent, for the corresponding input vector. The SME classification decision is obtained by comparing this result with a threshold, usually 0.5. The probability of a declaration of insolvency is also estimated. This threshold is also the cut-off point associated with the sensitivity and specificity values that are closest to each other and which present the highest percentage of correct classification.
4. Analysis of results
Statistical analysis of the financial behaviour of the 1,736 companies studied (991 declared insolvent and 745 not declared insolvent) produced empirical evidence enabling us to identify risk factors that can provide early warning of an SME’s financial insolvency. We identified 19 variables that are useful early warning indicators of insolvency situations for SMEs, composed of five non-financial factors and 14 economic-financial factors (see Table 5). Moreover, we are confident in the reliability and robustness of our results as we found controlled correlation and multicollinearity among the explanatory variables, as Table 6 shows.
Table 5. Significant variables within the explanatory and predictive model of legal insolvency
| VARIABLE | β | Standard error | Wald | Sig. | Exp (β) |
|---|---|---|---|---|---|
| X2 | .017 | .002 | 109.494 | <.001 | 1.017 |
| X3 | 18.333 | <.001 | |||
| X3(1) | -.078 | .244 | .102 | .749 | .925 |
| X3(2) | -.069 | .241 | .082 | .775 | .934 |
| X3(3) | -.409 | .248 | 2.712 | .100 | .664 |
| X4 | 78.388 | <.001 | |||
| X4(1) | -1.952 | .837 | 5.433 | .020 | .142 |
| X4(2) | -1.324 | .838 | 2.492 | .114 | .266 |
| X5(1) | .151 | .060 | 6.309 | .012 | 1.163 |
| X7 | -.357 | .019 | 355.008 | <.001 | .699 |
| X10 | .867 | .489 | 3.145 | .076 | 2.379 |
| X11 | -.037 | .010 | 12.418 | <.001 | .964 |
| X13 | -2.605 | .484 | 28.946 | <.001 | .074 |
| X17 | -.010 | .003 | 11.142 | <.001 | .990 |
| X20 | 7.215 | 2.476 | 8.492 | .004 | 1359.064 |
| X21 | 13.760 | 1.995 | 47.580 | <.001 | 945641.961 |
| X22 | .014 | .004 | 11.353 | <.001 | 1.014 |
| X23 | .031 | .010 | 10.232 | .001 | 1.031 |
| X24 | .070 | .020 | 12.456 | <.001 | 1.073 |
| X26 | 1.014 | .145 | 49.168 | <.001 | 2.758 |
| X27 | -.068 | .027 | 6.462 | .011 | .934 |
| X29 | -1.280 | .155 | 68.556 | <.001 | .278 |
| X31 | -.631 | .129 | 24.042 | <.001 | .532 |
| X35 | -1.337 | .764 | 3.062 | .080 | .263 |
| Constant | 1.687 | .879 | 3.685 | .055 | 5.401 |
The classification obtained (see Table 7) shows there was an overall success rate of 72.6% for an optimal cut-off point of 0.54, with a higher level of predictive success in the classification of companies at risk of insolvency.
Table 6. VIF test
| Variable | VIF | 1/VIF |
|---|---|---|
| X28 | 9,56 | 0,1046 |
| X29 | 9,01 | 0,1110 |
| X30 | 7,98 | 0,1253 |
| X27 | 6,48 | 0,1543 |
| X32 | 5,59 | 0,1789 |
| X18 | 2,89 | 0,3460 |
| X33 | 2,74 | 0,3648 |
| X21 | 2,61 | 0,3827 |
| X15 | 2,00 | 0,5008 |
| X16 | 1,74 | 0,5756 |
| X23 | 1,73 | 0,5775 |
| X35 | 1,47 | 0,6783 |
| X24 | 1,47 | 0,6803 |
| X14 | 1,37 | 0,7318 |
| X5 | 1,25 | 0,8009 |
| X2 | 1,23 | 0,8134 |
| X19 | 1,19 | 0,8373 |
| X4 | 1,13 | 0,8814 |
| X12 | 1,10 | 0,9094 |
| X7 | 1,10 | 0,9126 |
| X20 | 1,08 | 0,9218 |
| X13 | 1,06 | 0,9419 |
| X1 | 1,06 | 0,9446 |
| X3 | 1,03 | 0,9688 |
| X26 | 1,03 | 0,9710 |
| X10 | 1,02 | 0,9841 |
| X31 | 1,01 | 0,9867 |
| X6 | 1,00 | 0,9990 |
| X25 | 1,00 | 0,9992 |
| X11 | 1,00 | 0,9993 |
| X9 | 1,00 | 0,9998 |
| X8 | 1,00 | 0,9998 |
| X17 | 1,00 | 0,9999 |
| X34 | 1,00 | 0,9999 |
| X22 | 1,00 | 0,9999 |
| Mean VIF | 3,84 |
* A VIF of 1 indicates that there is no multicollinearity between the variable and the other predictors, while a VIF greater than 5 indicates multicollinearity. A VIF greater than 10 is considered an indicator of a serious multicollinearity problem.
Table 7. Logistic regression model ranking table
| Observed | Predicted | |||
|---|---|---|---|---|
| Y | Correct percentage | |||
| 0 | 1 | |||
| Y | 0 | 2.110 | 1.023 | 67.3% |
| 1 | 942 | 3.103 | 76.7% | |
| Overall percentage | 72.6% | |||
While it is true that the MLP is influenced by all the available variables, the results indicate that some variables have greater weight or relative importance than others (see Figure 2).
Figure 2. Importance and relative weight of the independent variables
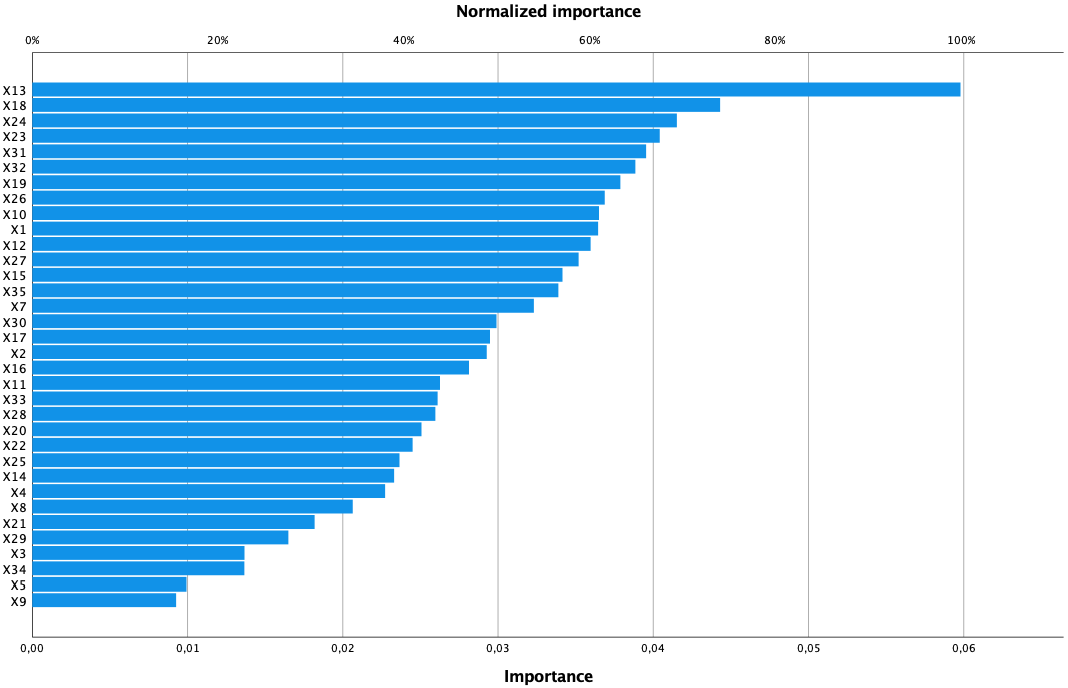
The above graph shows that the variables with the greatest weight or influence on financial insolvency generally coincide with the variables that were found to be statistically significant in the binary logistic regression model.
The classification obtained (Table 8) shows that the neural network performed significantly better than the traditional parametric technique of logistic regression, with an 80.2% correct classification.
Table 8. Neural network model ranking table
| Observed | Predicted | |||
|---|---|---|---|---|
| Y | Correct percentage | |||
| 0 | 1 | |||
| Y | 0 | 2401 | 732 | 76.6% |
| 1 | 692 | 3353 | 82.9% | |
| Overall percentage | 80.2% | |||
Moreover, we are confident in the reliability and robustness of our results as we found controlled correlation and multicollinearity among the explanatory variables (Table 7).
Among the non-financial variables considered, our results show that larger numbers of employees and greater export activity may increase the risk of insolvency. Conversely, it may be alleviated when there is a larger number of shareholders or owners. Furthermore, the sector in which the firm operates may influence the risk of insolvency (a question not considered in previous research). Construction companies are the most likely to present insolvency problems, followed by industrial companies and those in the services sector. The agricultural sector presents the highest level of financial risks for these firms. Another aspect that has not been considered previously is that of the company’s legal form; our results show that this factor, too, may influence the risk of insolvency. Specifically, cooperatives are at greatest risk, followed by public limited companies and private limited companies.
Furthermore, firms with significant export activity (a variable that has not been analysed in previous research) are also more prone to insolvency, possibly because this activity entails greater investment (García-Tabuenca & Crecente-Romero, 2014) and makes the company more vulnerable to exchange rate or interest rate fluctuations. Finally, we found no evidence that the age of the firm or the number of court cases produced had any influence on the risk of insolvency, in contrast to the conclusions drawn by Cultrera & Brédart (2016) in a study of Belgian SMEs, by Tobback et al. (2017) concerning Belgian and English firms and by Ma’aji et al., (2019) for Malaysian manufacturing firms.
Another area in which our findings contradict those of previous research is that of the number of employees. Thus, unlike Ptak-Chmielewska (2021), who found no evidence of this variable affecting the insolvency risk of SMEs in Poland, our results suggest that this variable does constitute a risk factor, as it implies an increase in fixed costs. Our results concerning the influence of the activity sector on the risk of insolvency for SMEs advance the conclusions drawn previously, regarding large and small firms in Europe, America and Asia (Fernández-Gámez et al., 2020; Alaminos et al., 2016) and are consistent with the findings of Cultrera & Brédart (2016) for Belgian firms. In parallel, our results on the influence of the number of shareholders are in line with Gallucci et al. (2022), who detected a significant influence of ownership concentration on insolvency risk in Italian SMEs. From these findings, we deduce that the idiosyncratic characteristics of each country may condition the influence of non-financial variables on SMEs’ risk of insolvency, which further corroborates the need to identify SME-specific early warning indicators of insolvency.
Turning to the economic-financial variables, the risk factors with the greatest explanatory capacity are those in the “Debt repayment capacity” group, with four variables, followed by those in the “Economic and financial structure” and “Solvency” groups, with three variables each. The risk factors with the least influence are those grouped under “Turnover” (two variables), “Profitability” (one variable) and “Capacity to generate funds” (one variable).
In the “Debt repayment capacity” group, our results show that an increase in the Financial expenses/Total assets, Financial expenses/Sales revenue or Financial expenses/Profit (Loss) ratios and a decrease in the EBIT/Financial expenses ratio are associated with an increased risk of insolvency. This finding is novel and contrasts with those reported by Acosta et al. (2019) for Spanish firms in the construction sector and by Gallucci et al., (2022) for Italian SMEs, as these authors detected no evidence that the above variables had any influence on insolvency. However, in line with the approach suggested by the AECA (2022), our results indicate that SMEs may be highly vulnerable to increases in the volume of debt (financial and commercial) and/or interest rates.
Following the above, our results for the “Economic and financial structure” group (Level of indebtedness, Debt structure by origin and Current assets/Total assets) show that an increase in the value of any of these ratios is associated with a greater risk of insolvency. Our results concerning Current assets/Total assets are consistent with the findings of Alaminos (2016) for European, Asian and American firms, but contrary to those of Acosta et al. (2019), who found no evidence of this variable having any significant effect on the insolvency risk of Spanish companies in the construction sector. Our results on the level of indebtedness are in line with Acosta et al. (2019), Cultrera & Brédart (2016) and Fernández-Gámez et al. (2020), on firms from 27 European countries. The influence of this variable was the strongest of all those analysed. Our findings suggest that the insolvency risk is higher when bank borrowing increases; this association is irrespective of the short or long-term maturity of the loan, according to our findings for the variable “Debt structure by maturity”. Furthermore, we show that an increase in the specific weight of current assets may increase the insolvency risk, which is logical to the extent that such an increase will reduce the generation of liquid resources with which to service debts. Accordingly, appropriate working capital management is essential for the company to achieve the best possible structure of its credits, debits and stock. Proper control of this factor will generate a higher cash balance, as has been proposed theoretically (AECA, 2022) and as we demonstrate empirically.
Regarding the indicators of the “Solvency” group, the results obtained show that a rise in the value of any of these indicators (Current assets/Current liabilities; Cash and cash equivalents / (Current liabilities + Non-current liabilities); and Reserves/Total assets) can reduce insolvency risks. These findings are in line with, but extend, those reported previously by Ptak-Chmielewska (2021) on Polish firms, Tobback et al. (2017) on Belgian and English firms, Acosta et al. (2019) on large and small construction firms and Fernández-Gámez et al. (2020) on large and small European firms. With respect to the specific weight of reserves as a factor reducing the risk of insolvency, our results are in line with the work of Alaminos et al. (2016) on large and small construction firms in Spain, Cultrera & Brédart (2016) on Belgian SMEs and Lisboa et al. (2021) on Portuguese family-owned SMEs.
In the “Turnover” group of variables, our results indicate that a rise in asset turnover (Sales revenue/Total assets) may increase the insolvency risk, but that greater non-current asset turnover may reduce this risk. This result is in line with the findings of Alaminos et al. (2016) for Spanish construction firms but contrary to Lisboa et al. (2021) on Portuguese firms. Therefore, we consider our results for this variable to be inconclusive. The non-current asset turnover variable has not been studied previously, although it seems logical that an increase in its value will reduce the risk of insolvency.
Finally, for the “Profitability” variables, we were only able to obtain evidence on the effect of operating profitability (which is not subject to the influence of atypical activities). An increase in the value of this factor is expected to reduce the insolvency risk, a conclusion that is in line with Cultrera & Brédart (2016) and Fernández-Gámez et al. (2020). In contrast, our results do not support the influence of economic profitability or financial profitability on SME insolvency, which corroborates the previous findings of Acosta et al. (2019), Fernández-Gámez et al. (2020) and Gallucci et al. (2022). Concerning the last of these variables, the (Amortisation and Depreciation)/Sales revenue ratio, an increase in this respect may reduce the risk of insolvency. This finding is novel as this variable has not been analysed in previous research, although its importance in this context has been acknowledged (Gallucci et al., 2022; Fernández-Gámez et al., 2020).
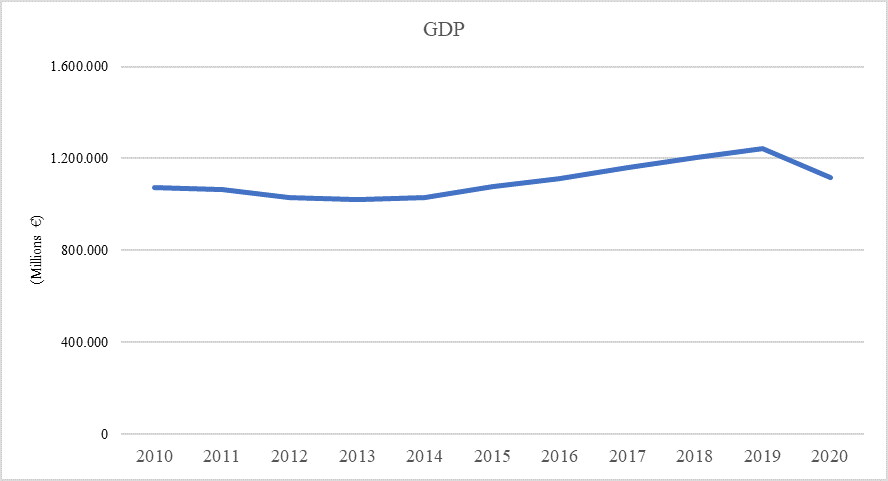
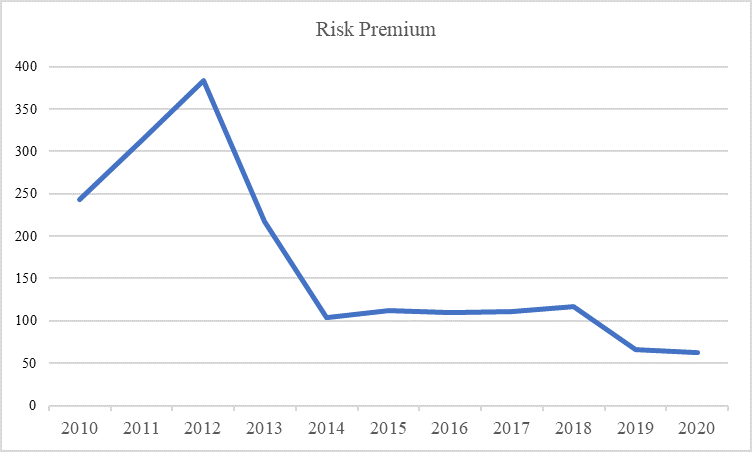
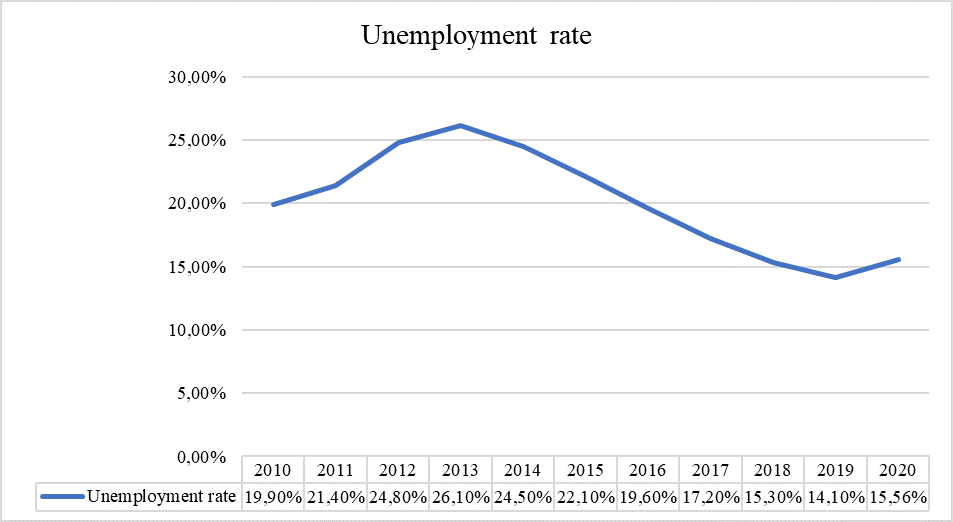
All these results should be interpreted in the context of the evolution of macroeconomic variables in Spain, such as GPD, risk premium and unemployment rate, as shown in Figure 3.
Figure 3. Evolution of the main macroeconomic magnitudes 2010-2020
5. Conclusions
The results obtained from this empirical study of 1,736 Spanish SMEs identify certain financial and non-financial variables as useful early warning indicators for self-diagnosis and for the timely avoidance of potential insolvency.
Among the non-financial indicators considered, our findings reveal that an increase in the number of employees, the existence of significant export activity and a reduction in the number of owners are all predictive signs of future insolvency problems for an SME. Therefore, financial viability restructuring plans should take account of these risk factors in their design of corrective measures and preventive strategies aimed at enhancing the firm’s chances of survival.
Our results also indicate that the effectiveness of such restructuring plans is subject to other factors, namely the nature of the activity sector in which the company is operating; its legal form (which may affect its debt repayment capacity); its economic-financial structure; and, in general, its level of solvency. These conclusions are novel, as previous researchers in this field have not considered the effects on SME insolvency of the activity sector, the company’s legal form or its level of export activity. In addition, we empirically corroborate that predictive analyses should be performed of the insolvency risk to SMEs, by conducting a joint analysis of their financial and non-financial variables. Furthermore, our results suggest that, in addition to the macro effects of the global economy, the socio-economic characteristics of each country may have a specific impact on the influence of non-financial risk factors.
Turning to financial indicators, the accounting variables reflecting the firm’s debt repayment capacity were found to be the most predictive of SME insolvency. According to our analysis, an increase in any of the following ratios is positively associated with insolvency risk: Financial expenses/Total assets; Financial expenses/Sales revenue; Financial expenses/Profit (Loss) for the period. A reduction in the EBIT/Financial expenses ratio is also associated with a greater risk of insolvency. The level of indebtedness, defined as the ratio of current liabilities + non-current liabilities to equity, presents the highest predictive capacity, which reflects the considerable financial vulnerability of SMEs to increases in indebtedness (bank and commercial) and interest rates.
The results obtained for factors related to the economic-financial structure of SMEs show that their risk exposure increases significantly with bank indebtedness, although we found no evidence of any effect on the structure of liabilities according to the short or long-term maturity of the debt. However, according to the evidence obtained, an increase in the specific weight of current assets may increase the insolvency risk, which is logical insofar as deferrals of collection may reduce the generation of liquid resources to service debts.
We identify as a predictor of insolvency risk a reduction in any of the following ratios: Current assets/Current liabilities; Cash and cash equivalents / (Current liabilities + Non-current liabilities); and Reserves/Total assets. This finding represents an advance on the conclusions of previous research because it is based on a sample of SMEs operating in different sectors of activity (agriculture, industry, services and construction). In particular, the result for the ratio of reserves to total assets is important, as it provides a warning of the effect of a firm’s dividend distribution policy on its propensity to incur insolvency problems.
From the above findings, we deduce that, together with the incorporation of non-financial variables, the creation of specific restructuring plans for an SME will increase its chances of success if the analyses and forecasts included in these plans take into account the potential effects of risk factors related to the firm’s debt repayment capacity, its economic-financial structure and its level of solvency.
On the other hand, our findings with respect to turnover indicators are only conclusive as concern the detrimental effect of reduced non-current asset turnover on the insolvency risk. Finally, the variables related to profitability and the firm’s resource generation capacity offer the least predictive potential regarding SME insolvency. In the first case, we only found evidence that a reduction in operating profitability represents an indicator of insolvency risk, but we obtained no evidence to suggest any association with other indicators, such as economic profitability or financial profitability. This finding underlines the importance of analysing the performance of ordinary business activities, rather than atypical ones or financial operations, for the successful design of restructuring plans.
Finally, our analysis shows that reducing the specific weight of technical depreciation may increase the insolvency risk. Thus, the effectiveness of restructuring plans could also be improved by incorporating the future behaviour of operating profitability and the specific weight of technical depreciation. This conclusion represents an interesting advance, as to the best of our knowledge the effect of these two variables on SME insolvency has not been analysed previously.
These findings can provide relevant information for decisions aimed at favouring the survival of SMEs. Firstly, we have identified those variables whose evolution must be monitored to know and avoid risks sufficiently in advance. Secondly, these variables support the selection of measures (financial and non-financial) to include in restructuring plans to enhance the financial viability of these companies and contribute to their solvency and sustainability. In addition, our findings can contribute to obtaining loans with interest rates adjusted to the level of risk of each company as well as attracting investors.
Despite its important contributions, this study has some limitations, which may guide future research. In the dependent variable, we have not identified the specific insolvency conditions that each company meets. In addition, in our statistical analysis, we have not computed the temporary variations of the independent variables, but their values in each year. On this basis, it is interesting to carry out future research work with the following objective: a) analysis of the dependent variable based on the cause (condition) of the legal declaration of insolvency; b) treatment of the independent variables through their interannual variations; c) survival study based on the number of years before insolvency in which the conditions for the legal declaration of insolvency are met, using the Cox regression model; d) analysis by sectors of activity of the companies.