A circularity accounting network: CO2 measurement along supply chains using machine learning
ABSTRACT
This paper proposes to use a type of machine learning network called artificial neural networks to design a circularity accounting network. The network is composed of human and non-human actors and accounts for the impact of products’ CO2 emissions and sequestration along global supply chains. The network serves to connect people and other actors that share a CO2 indicator and allows users to visualize the level of (un-) circularity of different products through specific diagrams calculated by a CO2 estimator drawing on insights from actor-network theory. Unlike most previous circular economy accounting studies that develop some type of framework or indicator that represent measurements at micro, meso or macro levels, the circularity accounting network is not confined to a particular level of analysis but is designed to build relationships between multiple users at different levels (e.g., government, corporate or consumer actors). The paper presents the conceptual design and a preliminary test of the network using real data, helping to advance the underexplored potential of artificial intelligence in the field of circular economy accounting. The main contribution of this network is that data provided by the indicator: (i) is derived from the network itself learning from open sources, the network (ii) is not static but keeps flowing as new relationships are built within the network, moving toward self-regulating, (iii) contemplates both emissions and sequestrations along supply chains.
Keywords: Accounting networks; Circular economy accounting; CO2 indicators; Artificial neural networks; Sustainability accounting.
JEL classification: M40; M41; Q56.
Una red de contabilidad de la circularidad: Medición del CO2 a lo largo de las cadenas de suministro mediante aprendizaje automático
RESUMEN
Este artículo propone utilizar un tipo de red de aprendizaje automático denominado redes neuronales artificiales para diseñar una red de contabilidad de la circularidad. La red está compuesta por actores humanos y no humanos y contabiliza el impacto de las emisiones y el secuestro de CO2 de los productos a lo largo de las cadenas de suministro mundiales. La red sirve para conectar a personas y otros actores que comparten un indicador de CO2 y permite a los usuarios visualizar el nivel de (in)circularidad de diferentes productos a través de diagramas específicos calculados por un estimador de CO2 basado en conocimientos de la teoría de las redes de actores. A diferencia de la mayoría de los estudios anteriores sobre contabilidad de la economía circular que desarrollan algún tipo de marco o indicador que representa mediciones a nivel micro, meso o macro, la red de contabilidad de la circularidad no se limita a un nivel concreto de análisis, sino que está diseñada para establecer relaciones entre múltiples usuarios a diferentes niveles (por ejemplo, actores gubernamentales, corporativos o consumidores). El documento presenta el diseño conceptual y una prueba preliminar de la red utilizando datos reales, lo que contribuye a avanzar en el potencial poco explorado de la inteligencia artificial en el ámbito de la contabilidad de la economía circular. La principal aportación de esta red es que los datos proporcionados por el indicador: (i) se derivan de la propia red que aprende de fuentes abiertas; (ii) la red no es estática, sino que sigue fluyendo a medida que se construyen nuevas relaciones dentro de la red, avanzando hacia la autorregulación; (iii) contempla tanto las emisiones como los secuestros a lo largo de las cadenas de suministro.
Palabras clave: Redes contables; Contabilidad de la economía circular; Indicadores de CO2; Redes neuronales artificiales; Contabilidad de la sostenibilidad.
Códigos JEL: M40; M41; Q56.
1. Introduction
The effects of excessive use of natural resources in anthropogenic patterns of production and consumption have been studied extensively in the last decades. It is widely accepted that crossing boundary thresholds of planetary boundaries (Rockström et al., 2009; see also Lade et al., 2020) may cause important subsystems to shift to a new state, jeopardizing the stability or survival of bio-systems. Recognizing the relevance of planetary boundaries, the European Commission (European Commission, 2014; Schulze, 2016) recognized the use of the circular economy (CE) as a tool to guide the sustainable transition of all sectors.
The CE is widely recognized as a valuable alternative to the prevailing linear model and as a viable path forward (Ellen MacArthur Foundation, 2015a, 2015b; European Commission, 2020, 2015; Ogunmakinde, 2019). Despite a large number of initiatives by practitioners focused on how to transform this linearity in a circular flow model proposed by CE (European Commission, 2014; CIRAIG, 2015 for example), it still presents serious limitations and needs further development for successful implementation (Korhonen et al., 2018).
It has been recognized that accounting and accounting measurements play a pivotal role in the operationalization of the CE (Wishart & Antheaume, 2021). Moreover, it has been claimed that CE could be relevant to improve sustainability accounting, reporting practices and measurement of CE-related activities, however, it has been also acknowledged that the CE from an accounting perspective is still understudied (Llena-Macarulla et al., 2023; Rossi et al., 2020; Scarpellini et al., 2020). Authors such as Murray et al. (2017) and Swensson and Funck (2019) suggested that there is still a long way to go in relation to considering the idea of CE organisation and accountancy. In that respect, Wishart & Antheaume (2021) remarks on the lack of attention given within the accounting field to aspects such as cooperation, innovation, new approaches to cost calculation, capabilities and relationships within the networks, aspects that are fundamental to promoting transformational change towards a sustainable world (e.g., Schröder et al., 2019). This is in line with Aranda-Usón et al. (2022) that calls for finding new collaborative solutions in the value chain.
To date, the CE accounting literature has mainly focused on CE introduction and adoption by business (Aranda-Usón et al., 2019; Aranda-Usón et al., 2020; Scarpellini et al., 2020), frameworks of integration with sustainability accounting (Aranda-Usón et al., 2022), the exploration of CE disclosure (Llena-Macarulla et al., 2023; Marco-Fondevila et al., 2021; Moneva et al., 2023; Scarpellini, 2022) and on indicators at different levels (micro, meso, macro)1 that represent different measurements (e.g., Bentué et al., 2022; Linder et al., 2017; Moneva et al., 2023; Pauliuk 2018; Sassanelli et al., 2019; for a review, see Wishart & Antheaume, 2021). Along the exploration of CE indicators, some pieces of research offered CE-related indicators for sustainability (Ibáñez-Forés et al., 2022).
Despite the considerable amount of research focused on CE implementation, reporting practices, measurement and indicators, less attention has been given to the development of collaborative initiatives providing new and effective CE indicators. The question remains, what type of indicator could help to gradually enhance the closing of materials loops? Additional studies developing innovative and effective indicators are needed. The purpose of this paper is to propose an innovative indicator and accounting network for CO2 emission and sequestration of products along global supply chains. This network is intended to connect human and non-human actors to collaborate in the measurement and sharing of information with the goals of rising awareness about CO2 concentration of consumption and production and providing information useful for decision making. To this end, this study provides the theoretical design of the network drawing on actor-network theory (Latour, 1993, 2005) as a method theory (Lukka & Vinnari, 2014). Additionally, the paper tests the functionality of the network through a collection of data for a set of products.
The first contribution of this paper is a collaborative, open CO2 indicator that does not depend on specific actors, which presents non-static data derived from the network itself, learned from open sources, as opposed to closed, static indicators depending mostly on reporting entity such CDP or GRI indicators (CDP, 2011; GRI, 2011) that have been recognized in previous research as relevant information concerning CE accounting (in example in Bentué et al., 2022). This circularity accounting network (CAN) enables the visualization of the products' CO2 concentration along global supply chains, which is one of the flows that must gradually enhance the closing of material loops in CE.
Second, it contributes to the literature on development of indicators to measure CE material flows. Its use of neural networks responds to calls made by Jose et al. (2020), Liu et al. (2022) and Wilson et al. (2021), who highlight the need to harness the superior data processing capabilities of artificial intelligence-based applications (such as data mining and artificial neural networks) which could prove helpful in the advancement of CE and related decision-making processes (Nikseresht et al., 2022).
Third, the paper modestly extends the use of actor network theory (ANT) in the field of CE accounting, extending the theories that have been used in the field similarly to how stakeholder theory (Walls & Paquin, 2015), institutional theory (Zeng et al., 2017) or resource-based view (Aranda-Usón et al., 2019), have been extended into CE.
The remainder of this paper is organized as follows: section two outlines the theoretical basis of the study by discussing ANT and exploring the relevance of these ideas in the development of the CAN. Section three describes the conceptual design of the CAN, attempting to ensure it can be readily understood by accountants. Section four presents the empirical test of the CAN with real data on two sets of breakfast cereals with and without milk. Section five discusses the network's theory context, its differences from other indicator systems, and how the network models CO2 emission flows. Section six provides some concluding remarks.
2. CO2 (un-)circularity of products: actors and networks
Presentation of the theoretical insights that have guided the development of the CAN is organized into two subsections. The first subsection introduces the interaction between human agency (HA) and non-human agency (NHA) that supports the development and operationalization of the CAN, using key concepts from ANT (Latour, 2005). The second subsection sets out how the CAN might encourage human actors, including individuals, to mitigate the increase in CO2 emissions on a global scale. Viewed through the lens of “dis-hoping” (Latour, 2017), the paper supports the importance of the CAN being an open network when it comes to engaging individual actors in CE performance assessment.
2.1. Actor-network theory and accounting
Actor network theory (ANT) is an approach originally explored in the works of Bruno Latour, Michel Callon and John Law (Callon, 1986, Latour, 1993, 2005, 2010; Law, 1992, 1999, 2000). This approach calls for a rejection of the dualism between nature and culture, instead accepting that the human and natural realms are entwined and cannot be understood separately (Ashmore et al., 1994; Castree, 2002; Fox, 2000; Ivakhiv, 2002; Latour, 1993, 2005; Lee & Brown, 1994; O'Connell et al., 2009). In this view, humans are no more or less part of society than they are a part of nature (Latour, 2005). As such, it has been claimed that ANT may provide a useful lens for environmental accounting researchers to explore the goals of sustainable development (Barter & Bebbington, 2013), such as the CE performance assessment supporting action on climate change. In summary, the analytical framework of ANT rests on the relationships between HA and NHA interacting in the unified nature-culture realm (Ivakhiv, 2002). In this sense, ANT recognizes that the relationships create an interdependence between HA and NHA (Lee & Hassard, 1999; Lowe, 2001; O'Connell et al., 2009). This interdependence is not static but fluctuates with the change of actors and relationships in the group. There is not a fixed group with fixed relationships but instead a continuous process of group formation (Latour, 2005). The agency exercised through artificial neural networks can be categorized as a type of NHA2.
Based on these ideas, this paper proposes an accounting network built using neural networks, intended to establish relationships between HA and NHA. Using artificial neural networks, NHA (e.g., machines including computers) can accomplish many tasks which previously were performed only by humans: for example, writing books, driving vehicles, managing accounting records (Dhamija & Bag, 2020; Jose et al., 2020). This is exemplified by the use of neural networks in stock trading systems3 (see, for example, Sezer et al., 2017; Zhong & Enke, 2017). Moreover, there is evidence that NHA may perform these tasks more quickly and in doing so enable the creation of more NHA, enabling the recursive increase in the speed of agency (Jin et al., 2020).
We propose this recursive increase in the speed of agency as part of the solution to the impact of anthropogenic activity. We propose CAN as an accounting tool that can help visualize and measure the contribution of different products along global supply chains to a global CO2 concentration network, using a CO2 indicator to estimate those impacts. The network may be a helpful tool to approach reduction of CO2 in production-consumption chains. In summary, the design of the CAN incorporates the relationships between people, machines, objects, and other actors to contextualize decisions about CO2. With this information, users might better understand their own relationship with the global CO2 concentration boundary. They can compare the impacts of alternative choices of consumption and production. This understanding might help users to see themselves as a relevant part of a network and, when possible, act against rising CO2 concentration. It is information at the product supply-chain level enabling reflection on a global issue:
“To be accounted for, objects have to enter into accounts. If no trace is produced, they offer no information to the observer and will have no visible effect on other agents. They remain silent and are no longer actors: they remain, literally, unaccountable.” (Latour, 2005, Part 1, page 79).
CO2 concentration must enter accounts: if there is no trace of the CO2 impact of products along global supply chains on global CO2 concentration then there is no information about CO2 on which observers can base decisions relating to their own interaction with CO2. The information visualized in the CAN would make CO2 visible, and therefore no longer a silent actor. The aim of the network is to make CO2 measurable and ensure that the CO2 of products does not remain unaccountable or unmeasurable. CO2 then becomes a visible non-human actor that is interrelated and interdependent with other human and non-human actors. This information may be helpful to visualize the interrelation and interdependence. Users might see what their own contribution to the planetary boundary of CO2 concentration is. This information should be: (i) openly accessible, online (web, applications); (ii) visible and easily understandable by humans.
Differentials of power between different users of the CAN are beyond the scope of this paper. Our focus is on developing an accounting tool that allows users to interact with each other and become part of a network to raise awareness of the contribution of different products in the market to global CO2 concentration. The network is not a fixed group of users, but in ANT terminology, it is a group formation, changing continuously.
In summary, ANT is based on the following principles: (i) there are no groups, only group formation. For our particular study, this means that there is no fixed relationship between humans, CO2 and the CAN but rather dynamic relationships that fluctuate over time within the network. (ii) Objects also have agency and play a role. For example, in this study, CO2 and the CO2 estimator are objects that have agency and can have an effect on other agents such as individuals, governments, corporations, etc. (iii) Power and domination4 lie not in the actors but in the vast array of changing relationships between actors (Latour, 2005). In this sense, we are not making an argument that one actor is more or less powerful than another; rather, the proposed accounting tool CAN provides information about the CO2 impact of products along supply chains, and in doing so helps to visualize the interdependent relationship between actors (including individuals) and the global CO2 concentration boundary. In this way, we open up the discussion about the relevance of an open CO2 accounting network as an actor of CO2 concentration, and therefore climate change. (iv) With ANT the researcher is encouraged to get into the middle of the action and observe the action and the process (Barter & Bebbington, 2013) to understand the relationships within the CAN between users, CO2 and the estimator.
We explain the application of these principles to the CAN extrapolating an example of Latour (Latour, 1999, p. 76). Thus, it could be claimed that the CAN: (i) helps to mitigate anthropogenic climate change, or (ii) does not help to mitigate anthropocentric climate change, but instead users of the CAN help to mitigate climate change. The first proposition places agency only in the object (CAN), while the second places agency only in the subject (users of CAN). However, according to ANT, neither the CAN nor its users, nor indeed CO2, should be the focus. Rather the focus should be on the relationship between these actors in pursuit of a goal; in this case, mitigating anthropogenic climate change. It is thus the relationship between the CAN, CO2, products, regulation, environmental institutions, and CAN users (who might well be individuals, governments, corporations, NGOs, or others) that translates into an outcome.
Drawing on these ideas, the next section presents a discussion of the potential of the CAN for visualizing the interdependent relationship between HA and NHA within the global CO2 concentration boundary, highlighting the relevance of individual agency in the context of Latour's “dis-hoping” (Latour, 2017).
2.2. Dis-hoping: the relevance of individual users in the network
Organizations have been pointed to as being both guilty of and potential alleviators of environmental issues (Bakan, 2004; Gladwin et al., 1995; Gray et al., 1993), nevertheless, many notable voices have identified individual action as also relevant in finding a solution to climate change (Latour, 2017; York et al., 2021). In this regard, Latour argued that a solution will come through action and not merely hoping for a solution (Latour, 2017). In his call for people to “dis-hope”, Latour proposes that individuals' actions are an essential part of the solution within a network, arguing that their agency allows them to intervene in the course of social action, such as the process to mitigate climate change. Furthermore, if humans (individuals) are expected to take action, they must be provided with the necessary tools: “instruments capable of tracing the loops that make the least of our actions react in response to its causes” (Latour, 2017, p. 252). Consequently, HA alone cannot be part of the solution without additional information instruments or tools. Neither can be NHA alone, it is the relationships between NHA and HA which has the potential to translate into an outcome. The thesis here is not about discharging responsibility onto individuals but instead providing users, including individuals, with information to connect the impact of their own action to another scale. More specifically, there is a need for information that allows users to visualize the CO2 contribution of the products that they might produce or consume to global CO2 concentration.
It has previously been claimed that the accounts of individual consumption have the potential to become a catalyst for environmental transformation (Rodrigue & Romi, 2022; see also Gray, 1992, arguing that accounting systems for anthropic relationships with the environment should provide information at the individual level). There are already some initiatives measuring the impact of individual products, which are being carried out by corporations (e.g., Patagonia, for further explanation see Rodrigue & Romi, 2022), as well as by national governments (Zero Waste Scotland, 2019-2021) and transnational institutions (zero tolerance regime for unauthorized genetically modified crops, European Commission, 2011: European Commission Regulation (EU) 619/2011). In this regard, keystone actors such as corporations are expected and needed to bring about an environmental transformation (Bebbington et al., 2019) because of their huge impact in terms of global emissions (Heede, 2019). Nevertheless, individual action could play a pivotal role as a catalyst of environmental transformation (Latour, 2017). Action by individuals does not imply inaction by corporations (Berkes & Ross, 2013). In this regard, our main argument is that the interaction between HA and NHA (with a particular goal) has the potential to leverage the outcomes of new accounting tools applied at different levels (corporate, individual, national).
In the next section we detail the development and operationalization of the proposed CAN. We emphasize the fact that making the CAN an open tool5 means users can access otherwise invisible information on global CO2 concentration.
3. The CAN conceptual design
In this section, the main features of the CAN are presented in two subsections, drawing on the theoretical insights discussed in the above section. The first subsection (3.1) details the main theoretical and accounting issues of the (un-)circularity diagrams produced in the CAN. The second subsection (3.2) focuses on the theoretical exploration of the relationships which arise with the use of the CAN between human (i.e., individual users) and non-human actors (i.e., the estimator and CO2).
3.1. The conceptualization of the (un-)circularity diagrams
The CAN, explained drawing on ANT's words, is designed to operationalize interventions aimed at achieving a circular economy. The CAN uses an estimator, an accounting tool that estimates an indication of the CO2 values of objects6 and produces CO2 (un-)circularity diagrams, which provide a means to describe the contribution of objects to the movement toward the CO2 concentration boundary. The circularity diagrams produced by the estimator are presented to users, who might modify their decisions considering this relationship with the information provided by the network. Users within the network are likely to interact and might share circularity diagrams of alternative products: in ANT, this is group formation and shapes actors' attitudes and actions (Latour, 2005).
Considering the challenge of CO2 limits and the potential for individual reaction, the diagram measures the CO2 (un-)circularity of recognized objects, where a zero CO2 emissions object is circular.
Figure 1 shows a theoretical CO2 circularity diagram. The diagram depicts a measurement of movement toward or away from planetary boundaries as a gap between the beginning and end of the circumference. The diagram design is a response to the need for circular economy tools that can deal with thermodynamic limits and planetary boundaries (Korhonen et al., 2018).
Figure 1. Circularity Diagram
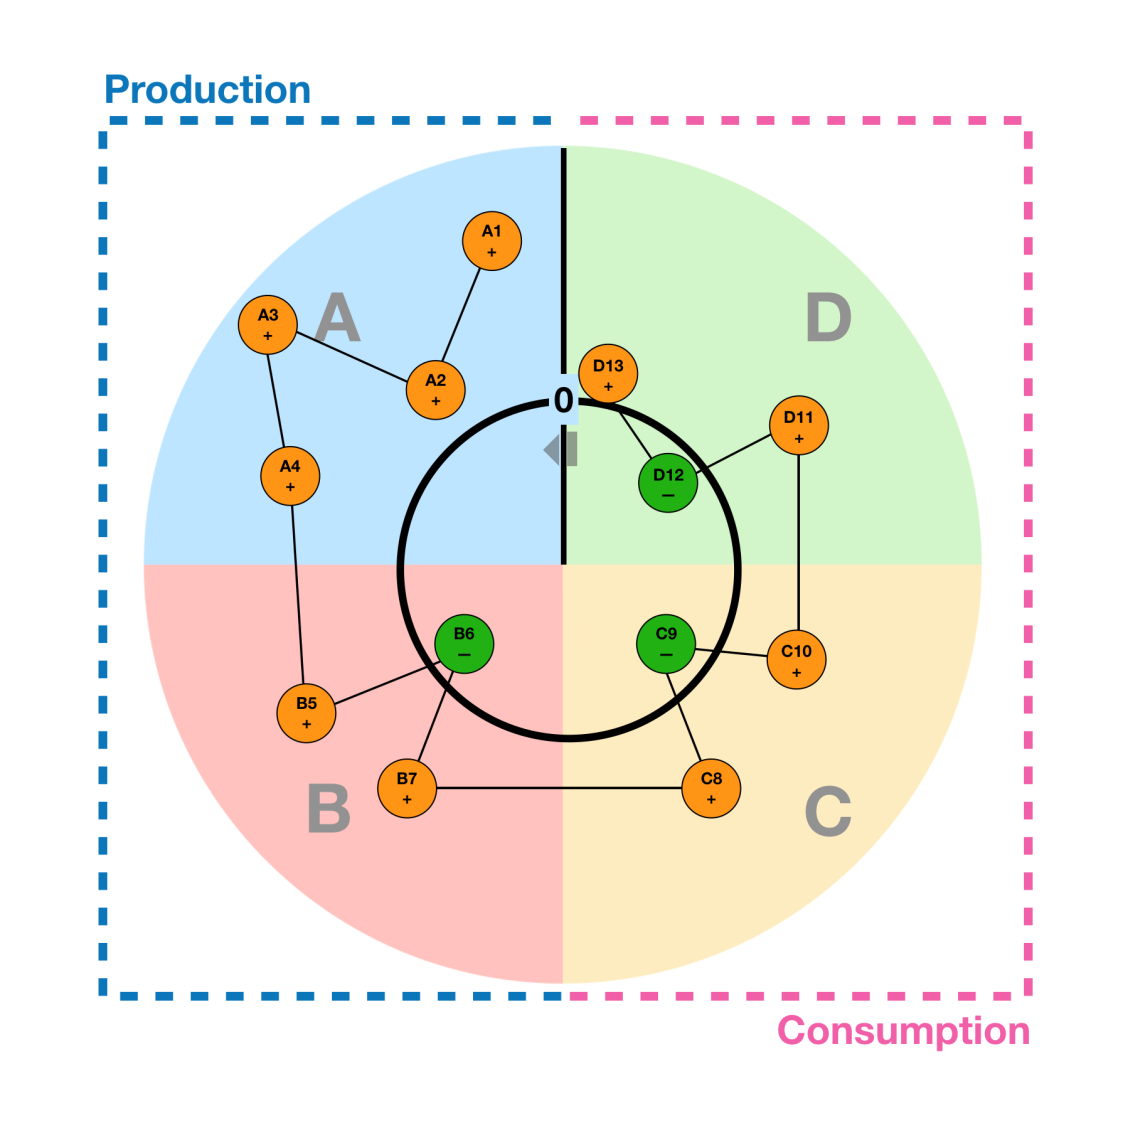
The heavy black circular line represents a cycle starting at a time = 0 point. The CO2 values along a production-to-disposal carbon chain are plotted in a counter-clockwise circular form, ending at the disposal of the object. Positions (orange and green dots) A1, A2, … An, B1, B2, ... Bn represent measurements of CO2 values within the production segments, while points C1, C2, ... Cn and D1, D2, ... Dn represent measurements made in consumption and disposal.
The figure is segmented into named regions as four segments of the CO2 chain, ABCD. A plots the CO2 value of inputs and production; B plots the CO2 value of distribution; C plots the CO2 value of use, and D plots the CO2 value of end-of-life including waste management, following prior accounting literature that raises the need to consider the stages of inputs, production, distribution, use and end-of-life in carbon accounting (Schaltegger & Csutora, 2012). The circle is divided into two regions: the left side, A + B, represents the production side, while the right side, C + D, represents the consumption side of the CO2 chain. At each measurement in the chain, emissions are plotted as positive (outward) and sequestrations as negative (inward) in a counter-clockwise circular form. The diagram represents one ABCD cycle for one object and the 0 point represents both the beginning and end of the cycle. From an accounting perspective, the circularity diagram visualized in the CAN has other important characteristics: (i) It encompasses both emissions and sequestrations considering direct (scope 1) and indirect impacts (scopes 2, 3), as in the greenhouse gas (GHG) protocol (World Resources Institute, 2004). (ii) It accounts for natural capital and uses the physical units of CO2 as the unit of measurement, in line with the tradition of carbon accounting in sustainability research (e.g., Schaltegger & Csutora, 2012). In doing so, it connects CO2 data with the physical objects they proxy, instead of valuing all economic transactions according to market rules and in monetary units (Costanza, 1980). (iii) When accessed from the network, it depicts a vast array of changing relationships between human and non-human actors (Latour, 2005), such as users, the estimator, objects and their CO2.
A theoretical object that has the same total emissions and total sequestrations along its cycle would be plotted as a closed form. Although the overall result is a zero value, the shape of the cycle might not necessarily be a circle due to the existence of both sequestration and emission points along the supply chain. In contrast, a manufactured product will have a variance from zero along its cycle as emissions or sequestrations in its chain, meaning produced objects will likely end on a non-zero value. As non-zero endpoints result in a broken circle, repetitions of cycles will result in the diagram displaying a spiral shape (see Figure 3 in section 4).
For objects, a life cycle inventory (e.g., Thomassen et al., 2008) can tell the story of the different stages from the extraction of raw materials through all the stages of production. It can also tell the story of their disposal. The CO2 impact of an object varies over the cycle, and we can identify it only at a measurable moment in time, t. The measurements taken across moments in time t = 0, t = 1, … can model an object in a simple way. In this figure, the positions marked with orange and green dots indicate the measured CO2 values in a production-disposal chain. We encode the CO2 values as a row vector named the consumption vector of the object. An object's CO2 impact is the sum of all the values in the vector.
3.2. CAN: relationships within the network
A CO2 estimator produces a list of CO2 values for the lifetime of an object, in relation to CO2 circularity (net zero CO2 over the lifetime of the object). The output of the estimator is a CO2 (Un-)Circularity Diagram (section 3.1) for an object. Using a device like a phone or glasses, an augmented reality view of a real object shows the object's CO2 circularity over its lifetime. This perceptual augmentation makes the CO2 circularity of objects visible to people when looking at an object via such a device.
The CAN can be interpreted in the language of ANT (Callon, 1986, Latour, 1993, 2005, 2010; Law, 1992, 1999, 2000) as a transfer function between the estimator (a machine actor) and the user (human actor) at the scale of individual people who make individual decisions. The individual is the venue from which social interaction proceeds to other actors farther away (where distance is a measure of the quantity of network links between actors). In illustration, consider a person making a decision about whether or not to eat broccoli. For the actors outside the CAN, the CO2 characteristics of the broccoli are not available information. Figure 2 represents the product with a hidden and unaccountable CO2 impact along its supply chain (scenario A) and a product in the (un-) circularity context (scenario B).
Figure 2: Object without and with the visualization of (un-)circularity diagram
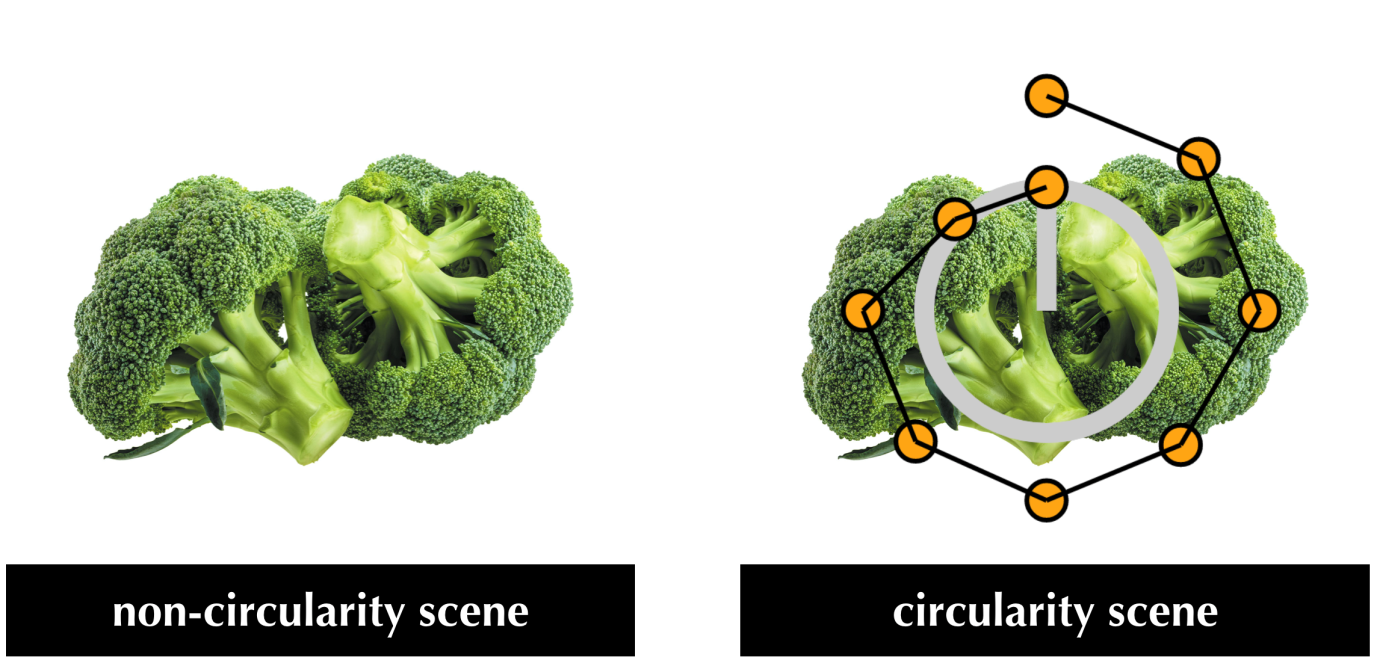
In the CAN, users are provided with information about the CO2 impact that is visualized in the circularity diagram (scenario B). This second scenario requires the use of a viewing device (mobile device with screen, for example) and the product is visualized with additional information about the CO2 via an indicator. In scenario B, CO2 concentration is made visible by the estimator and its social network interface. In this way, this information can be shared with other people as an image or video. When it is shared, the decision about an object may be socially modified as people communicate on the topic of decisions made in this way.
4. Test of CAN implementation with real data: one serving of breakfast in the UK
The beginning of the process is sourcing CO2 sequestration and emissions values from existing reports and databases, which entails HA. These reports and databases are available at the project worksite together with information about inputting CO2 chain data and training models. Additionally, videos of the products were uploaded to the project servers, objects were detected and CO2 chains obtained.
The development and training of the estimator is experimental, and the CAN network is a theoretical design. The estimator is a software tool that takes sensor input data and processes it though an artificial neural network. The result is a classification of the object found in the data, into a category. The category is retrieved from a database that lists known objects, and another neural network makes a prediction of the production-consumption-disposal CO2 chain (please see details about the architecture of the estimator in Appendix 1). In this study, we empirically tested it by collecting data and training the estimator for two products.
The test was applied to one serving of breakfast cereals in the UK. We obtained the preliminary CO2 data to train the artificial neural networks from the CCaLC project (2021). This project contains the CO2 footprint data of the product tested in this study, with information about the CO2 impact in several stages of the supply chain (Schaltegger & Csutora, 2012). It includes the stages of raw material processing, food and drink production, storage, consumption, transport, and waste management. The main raw materials are corn grain, malted barley, milk, corn syrup, sodium chloride, and sugar (CCaLC, 2021) (for further details please see Appendix 1). We selected the tested product within the Food and Drink section (CCaLC, 2021), which is a macro-scale analysis of food and drink systems in the UK, to identify carbon footprints in supply chains. We selected the two sets of “Breakfast cereal” which provided the most comprehensive data to use in this example. The two sets are cereal with milk and cereal without milk. The CCaLC data are measured in functional units of kg, while the estimator (estimator and CO2 chain predictor) is trained with expected standard units and sizes: one serving of breakfast cereal (with milk) is 37 grams (SmartLabel, 2021), and the estimator must multiply this value by the functional unit. Other sizes and units can be trained as required, and in the future a more developed estimator could indicate the quantity present.
We refer to the breakfast cereal with milk as “BC_milk” and to breakfast cereal without milk as “BC_nomilk”. Milk refers to semi-skimmed cow's milk.
Figure 4 shows the (un-)circularity diagrams produced for both sets of products as they would be visualized by users of the network.
Figure 3. Circularity Diagram: Comparison of two sets of breakfast cereals with and without milk
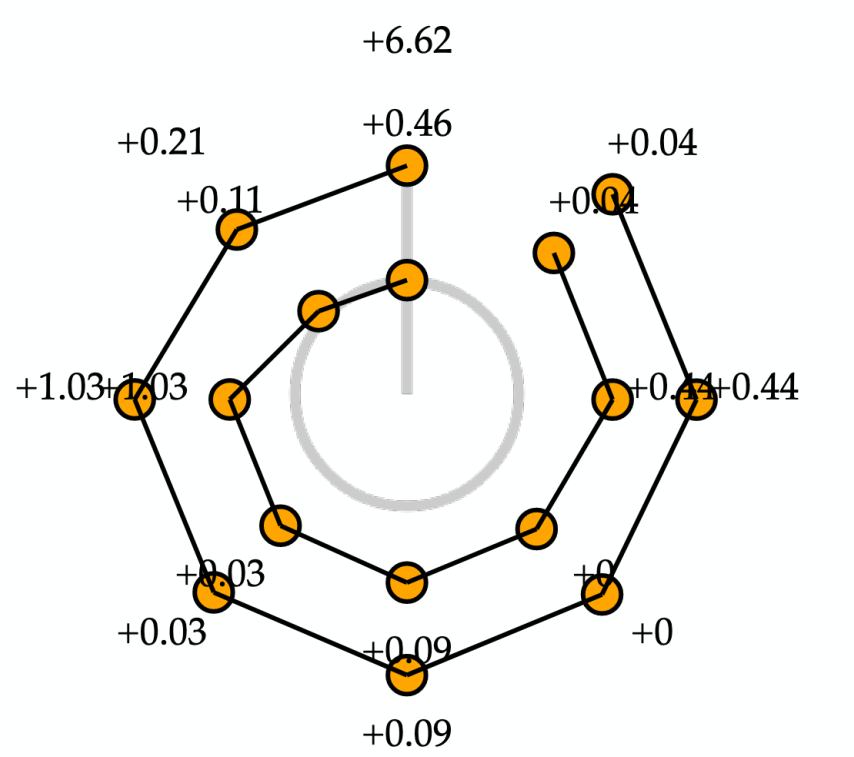
In all figures, values are expressed in kg CO2. The first measurement in the inputs stage is 6.62 for BC_milk and 0.46 for BC_nomilk. In the subsequent stages of production, storage, use, transport (transport in several points of the supply chain) and waste production BC_milk has [0.21, 1.03, 0.03, 0.09, 0, 0.44, 0.04, 0] whereas BC_nomilk has [0.11, 1.03, 0.03, 0.09, 0, 0.44, 0.04, 0]. At the end of one cycle, the estimator output for BC_milk is 8.46 kg CO2, and 2.20 kg CO2 for BC_nomilk (see Appendix 2 for further details). This final total is the sum of all measurements from all the stages in the CO2 chain (inputs, production, distribution, use and end-of-life in carbon accounting) (Schaltegger & Csutora, 2012). The information in the database is expressed in kg; the information was therefore transformed to servings with a size of 37 grams. After this calculation, each serving of cereal with milk was found to account for 0.31302 kg of CO2 emissions, and cereals without milk for 0.0814 kg of CO2 emissions. The deviation of these products from net-zero CO2 in this case is overall a positive figure, indicating (un-)circularity and movement toward the planetary boundary of CO2 concentration. According to the evidence of this empirical test, the estimator calculates that cereals with milk represent an environmental burden in terms of CO2 that is 284% greater than that of cereals without milk. This test suggests that cereal without milk would be a better choice from a CO2 boundary perspective (details about the potential uncertainty of the results are provided in appendix).
This is a test of the functionality of the estimator and the production of circularity diagrams for visualization. Future research could examine the effect of the visualization of CO2 impacts on relationships of the human users of the CAN.
5. Discussion
In contrast to the existing literature on CE accounting that has studied indicators at different levels (micro, meso, macro) representing different measures (e.g. Bentué et al., 2022; Linder et al., 2017; Moneva et al., 2023; Pauliuk 2018; Sassanelli et al., 2019; for a review, see Wishart & Antheaume, 2021), this paper provides a: (i) collaborative, holistic and open CO2 indicator containing data derived from the network itself. (ii) This indicator is not static and does not closely depend on specific actors: the data is learned from open sources and the network develops toward self-regulation over time.
Regarding collaboration, ANT proposed collaborative network between humans and non-human actors as a potential tool to solve complex environmental issues. Previous literature in CE accounting (Bentué et al., 2022) is mostly based on widely used such as the GRI and CDP. In these initiatives the indicator comes from one actor, the reporting entity, thus is not based on collaboration of different actors within society. GRI and CDP reports are organized toward communicating information or perceptions to people (readers of reports) who may then make decisions based on the communication. Hearing different voices from different actors within the network might be a way of finding new solutions.
Regarding dependence on specific actors, the lack of collaboration makes impossible for other than the reporting entity to produce information. Initiatives used in previous studies are strictly a report guidance. Thus, information in indicators is highly influenced by the reporting entity (usually corporations). In contrast to existing indicators like the Global Reporting Initiative (GRI) and Carbon Disclosure Project (CDP) communication outputs (reports), the CAN is trained from public data. From both the training process and diverse data sources, incentive to signal falsely may be avoided at large network sizes. The creation of both the circularity network that generates diagrams, and the diagrams themselves, are partly the work of HA (people) and partly the work results of NHA. From the ANT perspective, it is neither HA nor NHA alone which we should consider, but the interaction between both. When the actors interact toward the same purpose - to reduce CO2 concentration, that purpose may translate into a result.
From an applied perspective, the circularity accounting network describes and models emissions flows in the production-consumption chain by developing representations in neural network models7, which integrate training data into generalities. By using this modelling methodology, positions in production-consumption chains can be generalized between each other and between objects. Inferences, predictions, made by the models can produce similar results for similar objects. For example, broccoli and asparagus can be similar in a model. This makes it efficient for models to generalize objects and products.
The CAN serves to measure and analyse emissions flows using network models trained on large quantities of data. These modes are less dependent on particular data sources. For example, by generalizing the data found in many videos we might obtain a realistic image of the world even when much of the video is of poor quality. In the long term, as representations of objects are trained toward more realistic output, the invariant parts of the data can be found, even from less than perfect data.
6. Concluding remarks
This study has focused on developing the CAN, an accounting tool for assessing CE performance in relation to planetary CO2 concentration. A review of the literature suggests that the field of CE accounting is still underdeveloped in analysis and use of CE indicators, especially in the case of machine learning and neural network models. Accounting networks and individual action are rarely the subject of CE accounting research, and yet both issues could become relevant to reducing CO2 emissions.
This paper proposes the CAN, an accounting network built on neural networks, which aims to establish relationships between HA and NHA to share information about the impact of different products in terms of the planetary boundary of CO2 concentration. More specifically, the CAN provides a way to estimate the contribution to CO2 concentration of objects/products along global supply chains, using a CO2 indicator and visualizing the resulting information in an (un-)circularity diagram. Visualizing these diagrams might help users to better understand their own relationships with the global CO2 concentration boundary, which might have an influence in their decision or opinions. This paper argues that the interaction between HA and the recursive increase in the speed of NHA could be useful in managing the rising CO2 concentration, the main driver of climate change.
The paper includes a test of the CAN as a tool showing its estimator and (un-)circularity diagrams. The used data from institutional sources (data sources used in this study are listed in Appendix 2) the estimator and its tools are accessible online (URL in footnote 5). Incoming data reviewed by researchers may be used in training neural networks that make up the CO2 estimator in an offline process.
Considering that the designed network is intended to interact with users at different levels (macro, meso and micro), a key aspect for progress in CE (Kirchherr et al., 2017), this paper has practical implications for a variety of actors such as policymakers, firms and consumers and for accounting processes.
For policymakers, the network proposed in this paper could help in the discussion about policies and market mechanisms focused on developing tools for implementing the CE, considering the planetary CO2 concentration boundary. The development of such tools is essential in the current scenario characterized by volatility, uncertainty, complexity, and ambiguity (Nikseresht et al., 2022), promoting the role that accounting plays through evaluation. At a macro and meso level, this information intervention may influence policy decisions related to the CO2 impact of products. The information provided by CAN could be relevant for guiding economic policies aimed at transforming the production system to a green economy (Ghisellini et al., 2016; Su et al., 2013), for example by spotlighting high CO2 emitting objects and processes. Reactions to the information presented via the CAN could include taxes levied on the polluting parts of a value chain, or the restructuring of chains. The former would be in line with the new European strategy for the reform of taxation systems or green taxes.8 Furthermore, policymakers can be relevant actors in harnessing the CAN promoting the application of the CAN in further research (for example, by allocating resources).
For firms, at a micro level, the CAN provides detail information useful for producers on where the main CO2 emissions come from. For example, in relation to an electric car, the CAN may indicate that the production of the battery has high emissions, despite the fact that the car itself is marketed as low emissions. The CAN also has implications for firms, which may participate in the network and use it as a key performance indicator for benchmarking and comparing the level of (un-)circularity of their own supply chains with other companies, industries, and products, using the information provided by the estimator to direct production systems.
For consumers, the CAN can be a practical implementation in app form, users can touch it through the mobile screen. The CAN develops with the project and as the models grow in capability. Users may obtain a CO2 circularity diagram for objects that they view on the screen, in this process, users are operating the models. They may also contribute to training when they send video and make selections.
Finally, in terms of implications for accounting processes, the CAN will play a key role in promoting the decarbonisation of emissions and CO2 sequestration targets, which is essential for strategies such as the Climate 2030 Target Plan. CAN could become a key carbon accounting tool, providing companies which otherwise do not have such ability, with a means to quantify and measure carbon emissions and enabling them to make informed decisions on decarbonisation.
This study is limited to implementing the machine learning parts and training artificial neural network models on institutional data, while proposing a design for the social parts of the network for operationalization. This paper outlines the theoretical basis and conducts the first experiments in laboratory conditions. Future research efforts can examine larger scale studies of the use of the CAN. As Wishart & Antheaume (2021, p.260) explain: “Accounting for circularity can never be complete if it does not take into account a larger picture”, and social aspects are a very important aspect of that picture. Additionally, future research could conduct more research with a particular focus on linking accounting to the development of a CE that respects planetary boundaries and individual action. Finally, further studies exploring estimators from the consumer's and producers' perspectives, analysing whether and how the information derived from the estimator influences their decision-making, could yield useful insights (in line with e.g., Grunert et al., 2014; see also de-Magistris et al., 2017, for further discussion of consumers' decision-making).
Colonialism statement
The University of Washington stands on the land of the Coast Salish peoples; we acknowledge the Coast Salish peoples of the land which touches the shared waters of all tribes and bands within the Duwamish, Puyallup, Suquamish, Tulalip and Muckleshoot nations.
CO2 generation and power consumption
Deep learning models were trained in Beijing using an estimated 1008kWh generating 980.2 kg CO2 from coal (5.65%), petroleum (33.8%), natural gas (31.8%), external transmitted electricity (25.99%), and others (2.77%); and in Seattle using a measured 25kWh generating 24.75 kg CO2 from hydro (84%), unknown (6%), nuclear (5%), wind (4%), biogas (1%).
Appendix 1: Architecture of the CO2 estimator
We encode the CO2 values as a row vector named the consumption vector of the object. An object's CO2 impact is the sum of all values on the vector. Individual and aggregate CO2 consumption vectors are learned by modular artificial neural networks. The circularity diagram becomes the structure on which we develop several neural network models and support with a related database. The production stages or steps that make up the positions on the circularity diagram, are measurements of CO2 at that position or stage, referred to as 'nodes'.
We compute the diagram lines between nodes as transformations, over multiple production periods, each period is one cycle, and multiple cycles are multiple copies of an object. The transformation process between nodes is described in detail Figure 1 below. Each node in a production-disposal chain, for example transport, or retail sale, may also be modeled in detail, however we model only those nodes which interact with a user.
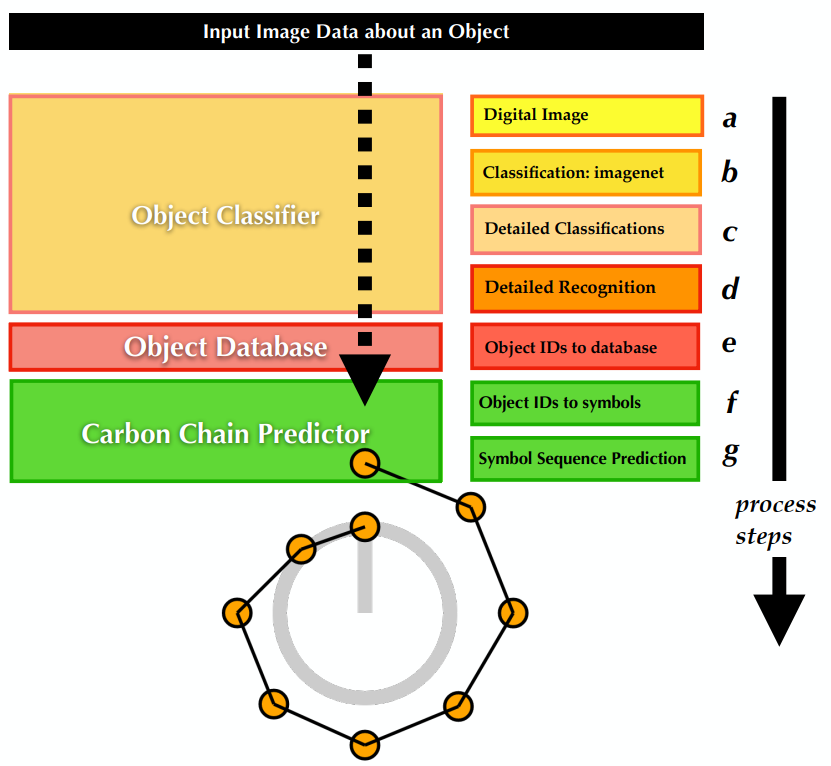
The Figure 1 below shows the architecture of the estimator in three components delivered in seven steps: (i) The object classifier, where the digital image of the object is captured and classified (steps a to d). (ii) The object database, where data is collected and organized (step e). (iii) The CO2 chain predictor, which estimates the CO2 values of each object analysed (steps f and g).
Appendix 1 Figure 1
At the start of the process, building and training the models of objects and sourcing the initial information about their CO2 sequestration and emissions values from existing reports and databases is the work of HA: humans are needed to acquire samples of data, such as visual images or video of the object to be estimated, and to assign CO2 values to the objects. These steps are currently performed by specialist researchers (Barter & Bebbington, 2013), and so this process is only partly open to the public. After acquiring sufficient training data and performing the training, the neural networks learn to make inferences about novel input and become less dependent on new information from human actors. Different architectures and strategies exist for training networks (see, for example, Bengio et al., 2015), but a common goal is to make them function independently.
In developing the CO2 estimator, we investigate defining objects as encoding in artificial neural networks, so that a network identifies objects and contains the definitive model of the object. Using neural network detectors to define objects stands in contrast to previous approaches for doing so: in legal and commercial contexts, objects are often defined in terms of language (patents for example) and entail HA, where a person physically creates a definition of an object, or through a social or legal framework that is enforced by HA. Neural network detectors, in contrast, learn details from examples of objects and generate their own representation. Features of an object are encoded in a series of values, a feature vector, and constitute the network's definitions of objects. The neural network thus acts to produce human-independent definitions of objects which do not require the continuous intervention of HA.9 The CO2 estimator models the CO2 values of objects based on those definitions.
The topic of using artificial neural networks to assist in implementing analysis or action on atmospheric CO2 has seen great attention and development in the recent period. Recent research includes carbon capture (Chan et al., 2017; Sipöcz et al., 2011; Rahimi et al., 2021), sequestration CO2 storage (Koperna et al., 2020), soil (Cheshmberah et al., 2020), saline aquifers (Song et al., 2020), oil recovery (Thanh et al., 2020), and emission prediction (Jin, 2021). In this study, object estimators and production-consumption chain predictor models are developed using neural networks and a database:
a) Object estimators encode an object based on its features, when the object has been measured at some position in a production-consumption process. The estimators span a variety of model architectures, including ImageNet, single-shot detector models, and autoencoder based image detectors.
b) Chain predictor models encode the production-consumption process but not object features. These are a linear symbol-sequence model, from the seq2seq design (Sutskever et al., 2014; Britz et al., 2017).
(a,b) are two model structures which are trained independently.
Appendix 2: Story of two breakfast cereals
We obtained CO2 data for production-disposal chains from the CCaLC project (2021) and made predictions of the CO2 consumption vector for two objects. The first prediction is shown in detail in the figure below, where (f) shows a consumption vector of CO2 values, and under (f) is a beam search graph. In this graph, the first line below each circle is the CO2 label, then the node number, and the second line is the mean error. In the figure below, (g) sums the CO2 consumption vector.
Following, the names of the parts of the system are used as titles and their actions are then described.
Appendix 2 Figure
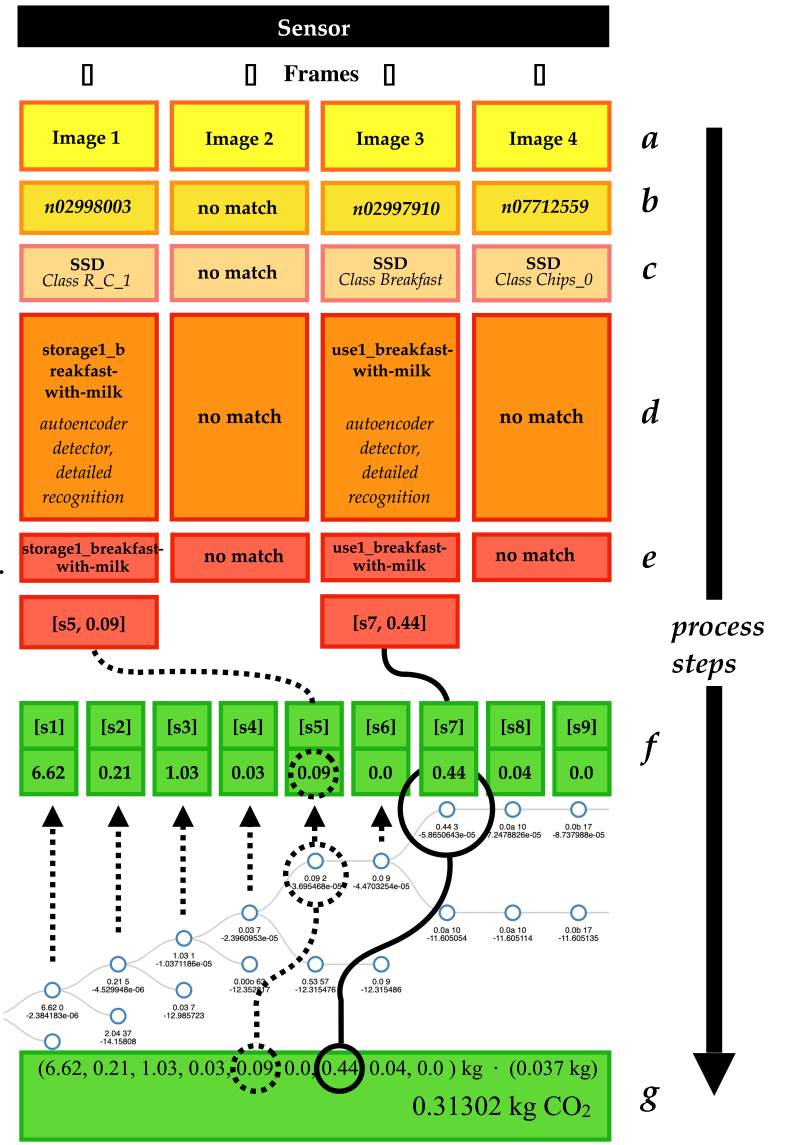
Object classifier: Video images were acquired from a video stream captured on a mobile phone. An ImageNet detector model (see main text for more information on this detector) detected class n02998003, which was matched to database symbol storage1_breakfast-with-milk, and no further recognition was undertaken. This symbol was added to a record of events in this processing session. The next data frames were skipped. ImageNet then detected class n02997910, which was matched to symbol use1_breakfast-with-milk, and no further recognition was undertaken.
A refined autoencoder for specific or exact objects could be used as a final classification stage but was not needed for BC_milk/nomilk. We trained neural networks models to detect particular classes from images that we collected in the field. However, a detector trained generally, for example on MSCOCO (Lin et al., 2014) or other datasets, could be helpful for coverage of other objects.
Object database: The symbol use1_breakfast-with-milk is an entry in a database, which allows detected objects to be linked to positions in CO2 chains. The symbol is stored in the database with its CO2 chain as a graph. During preparation and training, the CO2 chains for BC_milk and BC_nomilk were given as training data to seq2seq models, which learned the chains.
CO2 chain predictor: On prompting the models with the detected object use1_breakfast-with-milk, the forward and backward production chain sequences were recovered, and their corresponding CO2 chain was inferred by the seq2seq model. use1_breakfast-with-milk was found to have a CO2 value of 0.44 kg CO2 at position 7 in its chain. The entire CO2 chain was then inferred as [6.62, 0.21, 1.03, 0.03, 0.09, 0, 0.44, 0.04, 0]. The precision in this test case is only 2 significant figures after the decimal due to training data input; however, the model may express an arbitrary quantity of significant figures.
With training on additional object data and CO2 chains, we can present other breakfast cereals or other objects to the estimator to infer a chain of CO2 values (of input A, through BCD disposal) showing deviation from circularity.
Additional information about the values used in the empirical test:
| (kg CO2 eq./f.u.) | Difference | breakfast cereal with milk | breakfast cereal without milk |
|---|---|---|---|
| rawmaterials | 6.16 | 6.62 | 0.46 |
| trans7 | 0.10 | 0.21 | 0.11 |
| production | 1.03 | 1.03 | |
| trans6 | 0.03 | 0.03 | |
| storage | 0.09 | 0.09 | |
| trans5 | 0 | 0 | |
| use | 0.44 | 0.44 | |
| trans4 | 0.04 | 0.04 | |
| wastefinal | |||
| wasterawmaterials | |||
| w1, 2, 3… | |||
| trans2 | 0.00459 | 0.00459 | |
| wasteproduction | |||
| trans3 | |||
| wastestorage | |||
| Total | 6.26 | 8.46459 | 2.20459 |
Source: CCaLC database.