Sustainability in the Waste Management Sector: An Analysis through the GRI Reports
ABSTRACT
This work aims to determine if the characteristics of the sustainability reports issued by companies in the waste management sector of the European Union in their GRI reports are influenced by the particularities of these companies. Specifically, we study their location (country), the type of company, whether it is listed on a stock market, and its size and explain the relationships between sustainability GRI reports and these variables. The waste management sector is highly relevant in achieving sustainability objectives. Therefore, this paper is focused on studying the factors that determine the disclosure level of the sustainability reports of European companies in this sector.
The background shows how certain factors that characterize the companies that issue sustainability reports influence the level of transparency or voluntary disclosure and the reports’ characteristics. Specifically, much of the research finds evidence that relates these aspects to factors such as the country in which the company is located, its size, its public or private nature, or the fact that the company is listed on a stock exchange, characteristics that are analyzed in this study.
A statistical study is carried out on the reports reported in the GRI database for a sample of all the European companies in the waste management sector through the statistical technique of Chi-square contrast on the independence of variables, adjusted standardized residual analysis, and logistic regression model. The factors analyzed have been determined based on the experience of previous studies. This is the case of the country variable that has been characterized based on Hofstede´s dimensions.
The results show that the factors analyzed are consistent and influence some of the elements selected for the characterization of the reports. Specifically, the type of report, its level of adherence, the inclusion of the OECD guidelines, the mention of the UNGC pact, or the existence of external verification depends on the company´s characteristics. Furthermore, the explanatory analysis was done by running a logistic regression model, allowing us to add knowledge to the current process of sustainability standardization and to explain the differences in sustainability information in a sector crucial for the circular economy.
Keywords: GRI; Sustainability reporting; Waste management; Corporate social responsibility.
JEL classification: MOO; M14; L80.
Sostenibilidad en el sector de gestión de residuos: un análisis a través de los informes GRI
RESUMEN
Este trabajo se propone determinar si las características de los informes de sostenibilidad que emiten las empresas del sector de gestión de residuos de la Unión Europea en sus informes GRI están influenciadas por las particularidades de estas empresas, en concreto, por su ubicación (país), el tipo de empresa, si cotiza en un mercado de valores y su tamaño, así como explicar la relación entre los informes GRI de sostenibilidad y estas variables. El sector de gestión de residuos tiene gran relevancia en la consecución de los objetivos de sostenibilidad, no abundando la literatura relativa a la información no financiera de este sector, por lo que el presente trabajo se va a centrar en el estudio de los factores que determinan el nivel divulgativo de los informes de sostenibilidad de las empresas europeas de este sector.
Los antecedentes muestran cómo determinados factores que caracterizan a las empresas emisoras de los informes de sostenibilidad influyen en el nivel de transparencia o en el nivel de divulgación voluntaria y las características de los informes emitidos. En concreto, gran parte de las investigaciones encuentran evidencias que relacionan estos aspectos con factores como el país de ubicación de la empresa, su tamaño, su carácter público o privado o el hecho de que la empresa cotice en una bolsa de valores, características que son analizadas en este estudio.
Se realiza un estudio estadístico sobre los informes reportados en la base de datos GRI para una muestra de todas las empresas europeas del sector de gestión de residuos, mediante la técnica estadística de contraste Chi-cuadrado sobre la independencia de variables, el análisis de los residuos tipificados ajustados y el modelo de regresión logística. Los factores analizados se han determinado en base a la experiencia de estudios previos. Este es el caso de la variable país que se ha caracterizado siguiendo el modelo de dimensiones de Hofstede.
Los resultados muestran que los factores analizados son consistentes y evidencian que los factores analizados influyen en algunos de los elementos seleccionados para la caracterización de los informes. En concreto, en el tipo de informe, su nivel de adherencia, la inclusión de las directrices OECD, la mención al pacto UNGC o la existencia de verificación externa. Además, el análisis explicativo se ha realizado mediante un modelo de regresión logística, lo que nos ha permitido agregar conocimiento al actual proceso de normalización de la sostenibilidad y explicar las diferencias en la información en materia de sostenibilidad en un sector vital para la economía circular.
Palabras clave: GRI; Sostenibilidad; Gestión de residuos; Responsabilidad social corporativa.
Códigos JEL: MOO; M14; L80.
1. Introduction
There is an international consensus to guide countries' economic growth on sustainable development. The waste management sector, on which this research is focused, is no stranger to this orientation. Indeed, it is a crucial sector to improve this sustainable development.
According to Kaza et al. (2018), if we analyze the global generation of waste by region, a significant change has been observed in its distribution in recent years. The OECD countries have gone from generating 572 million tons of solid waste per year, 44% of the total (Hoornweg & Bhada-Tata, 2012) to Europe and Central Asia together accounting for 20% of the world’s waste (392 million tons), while Africa and South Asia, which were listed in the 2012 report as the regions that produced less waste (5% in both cases) have significantly increased their generation. Despite this notable decline, the projection for 2050 estimates a 25% increase in the figures for Europe and Central Asia.
Moving to sustainable waste management requires a great effort. It entails a high economic cost, which can represent a high percentage of the budget expenditure of local governments, which gives us an idea of the importance of the waste management sector at the world level and, in particular, for European countries.
The Directive 2014/95/EU establishes non-financial information disclosures that large companies have to publish to improve transparency by facilitating the understanding of the business organization and the business of the company in question.
When providing this information, obliged companies must rely on national frameworks, European Union frameworks or recognized international frameworks, such as the standards issued by GRI, Global Sustainability Reporting Initiative.
Since the publication of the GRI standards in 2003, more and more companies have voluntarily adhered to its sustainability reporting framework.
In 2020, a significant majority of companies, according to The KPMG Survey of Sustainability Reporting 2020, used some form of guidance or framework to support their sustainability reporting (KPMG, 2020). Although there are other options, such as the Sustainability Accounting Standards Board (SASB) framework or International Standards Organization (ISO) standards, GRI remains the most widely used reporting standard. Two-thirds of the global sample of 5,200 companies analyzed by KPMG (2020) in its survey (N100, which comprises the top 100 companies by revenue in each of the 52 countries and jurisdictions investigated in the KPMG study), and about three-quarters of the G250 organizations (refers to the 250 largest companies in the world by revenue, as defined in the Fortune 500 ranking of 2019) adhered to GRI.
Most research on corporate CSR disclosure focuses primarily on agency theory, followed by stakeholder and legitimacy theory, rather than investigating factors that drive the issuance of voluntary reports (Benito et al., 2023a; Benito et al., 2023b; Zamil et al., 2023). Furthermore, there are hardly any references to research on non-financial information produced by the waste management sector. However, the waste management industry is so essential worldwide for some products, as is the case of plastics, that the analysis of its contributions to the circular economy adds essential knowledge to contribute to sustainability (Fletcher et al., 2021; Hossain et al., 2022), Taking advantage of the availability of sustainability reporting and given the importance of this sector, it is considered relevant to study whether the level and characteristics of the sustainability reports are influenced by certain particularities of the companies operating in this sector. These characteristics may be the country in which they are located, the legal form they present, their possible listing on a stock exchange, and the company's size. However, sustainability reporting should not be determined by these characteristics because analyzing waste management sector contributions is crucial.
This work is structured as follows. First, the theoretical framework on which the research carried out is based and developed. Next, it is presented the methodology followed, as well as the sample analyzed. Then, the results section shows the main findings obtained from the statistical analysis of the data. Finally, there are drawn the most relevant conclusions.
2. Background
One of the lines of research followed in empirical studies related to sustainability information published by companies is to determine its impact on the market or the decisions that companies make.
Other works focus on establishing the influence that certain factors related to the characteristics of these organizations have on the type and/or quality of the information they disclose in their reports and being one of these factors to be analyzed the size of the company.
A priori, the hypothesis to check about size and disclosure is that there is a positive relationship. In the systematic review of the drivers of voluntary corporate disclosure, this positive relationship is found in 42 of the 49 studies in the Scopus database analyzed by Zamil et al. (2023).
Regarding the measurement of company size, it differs slightly in the studies, or it is a combination of different constructs. For example, some of them consider total assets or their natural logarithm or market capitalization (Albers & Günther, 2010; Chiu & Wang, 2015; Clarkson et al., 2008; de Oliveira et al., 2022; Góis et al., 2015; Reverte, 2009), others consider the classification that establishes GRI for companies that publish reports in their database (Vaz Ogando et al., 2012). The size variable has also been defined by the number of employees (Gamerschlag et al., 2011), and in other cases, it is not specified how to measure it (Sierra- García et al., 2014).
Due to the availability of corporate social responsibility (CSR) or sustainability information issued by companies, the studies are based on large companies. This is the case of Reverte (2009), who analyzes a significant positive relationship between the size of the company and the disclosure of corporate social responsibility (CSR). This study is based on a sample of Spanish companies listed on the Madrid Stock Exchange and included in the IBEX35 index, concluding that, after exposure to the media, the size of the company and the industry are potential determinants of CSR disclosure practices in this type of company. Some studies conclude this positive relationship but based on GRI reports, as is our case in this paper, such as Albers & Günther (2010), who conclude that the size of the company (represented by the logarithm of total assets) has a significant positive influence on the GRI reports. They conduct an analysis using a logistic regression model on 600 STOXX Europe firms. The results are justified because it is assumed that large companies have more powerful stakeholders who are pressured to provide more information than their financial reports. Furthermore, this helps to reduce the information asymmetry between shareholders, who are supposed to be different in large companies. Although they are focused on the Latin American environment, Sierra-García et al. (2014) use a sample of companies that published their reports in the GRI database from 2006 to 2010. They go further in these conclusions because they concluded that the decision to get external assurance depends significantly on the size of the company, sector or country.
Also, being a large company significantly increases the chances of having a verified sustainability report. Vaz Ogando et al. (2012) review the existing literature on the explanatory factors of the willingness or not of companies to communicate information on their corporate responsibility. They list at least 17 studies that have dealt with the subject, most focused on the scope of the OECD. In these studies, size and sector are the most cited factors to explain the existence, quality, and quantity of CSR information (specifically, size is in 14 of them). The results of their statistical study carried out on a sample of Spanish companies that had published information in the GRI database up to the first quarter of 2011, are consistent with this background. They conclude that the factors that, among those studied, can influence the determination of the nature of the external verifier are the size and the sector. Even in a so different sector, such as banking, this positive relationship when GRI Standards are followed, like point out de Oliveira et al. (2022) with a sample of Brazilian banks due to count with a better technological infrastructure that allows them to disclose at a lower cost. Vogt et al. (2017) assure that the larger the company's size examined, the greater the degree of environmental disclosure with a sample of 97 Brazilian companies. However, they find that this positive influence does not occur in all the years studied, moderating the effect of the variable compliance with the GRI guidelines.
Referring to listed Brazilian and Spanish companies, Góis et al. (2015) find through multiple regression models that both, age and size, are factors that influence the level of disclosure of sustainability information. In addition, they consider that larger companies tend to be more structured and organized in their operations and manage to attract better professionals and thus produce better quality information.
Therefore, these relationships between disclosure and size are mainly based on different theories. Stakeholders theory argues that sustainability and CSR practices are disclosed to seek legitimacy from stakeholders on the practices shareholders adopt in the corporate organization (Fatma et al., 2014). Chiu determine that the size of the company, together with other measures of power within the framework of the stakeholder theory, such as strategic position, economic resources, and visibility in the media, are related to the quality of social disclosure. Hence, economic resources and a good structure and organization in the company are also the basis of other theoretical approaches that claim a positive cost-benefit assessment to issue sustainability information. The lack of resources is a handicap, and resources are positively associated with size (Cantele & Zardini, 2020). It is also assumed that bigger companies will tend to issue greater disclosure because they have to avoid information asymmetries, as shown by the Agency Theory (Jensen & Meckling, 1976).
Based on all this background about the influence of size on disclosure, the following hypotheses are proposed:
Hypothesis 1a: The size of the company is independent of the type of report.
Hypothesis 1b: The size of the company is independent of the level of adherence to GRI standards.
Hypothesis 1c: The size of the company is independent of the explicit reference to the use of the OECD guidelines in the report.
Hypothesis 1d: The size of the company is independent of the explicit reference to the use of the United Nations Global Compact and its principles in the report.
Hypothesis 1e: The size of the company is independent of the Implementation of the standard International ISO 26000.
Hypothesis 1f: The size of the company is independent of the existence of the opinion of experts and stakeholders in the report.
Hypothesis 1g: The size of the company is independent of whether the reports have been subjected to external verification.
Another widely studied factor concerning its influence on the disclosure and uniqueness of sustainability information is the country of origin of the companies analyzed. Numerous studies show a relationship between the country and the level of voluntary disclosure of information related to sustainability. The study by Gray (1988) can be the seminal research on the patterns followed by a country's accounting system. He establishes patterns between the cultural characteristics of the countries and the development of accounting systems, regulation of the accounting profession, and attitudes (more or less conservative) towards financial management, as well as transparency or secrecy in disclosure. In this study, he concludes that the higher a country’s ranking in uncertainty aversion and power distance, and the lower it is in terms of individualism and masculinity, the more propensity exists for secrecy. Although, in his opinion, aversion to uncertainty and individualism are the most important in the accounting value system, he also considers the influence of distance to power and masculinity to be significant. However, the latter has somewhat less significance. In this line of research, Hofstede's model of national cultures is based on the cultural attributes of the country and its influence on sustainability reporting establishing different dimensions. Specifically, his abbreviated definition of culture is: "Culture is the collective programming of the mind that distinguishes members of a group or category of people from others" (Hofstede, 2011, p. 3). Initially, these dimensions were four: power distance, uncertainty avoidance, individualism, and masculinity (Hofstede, 2001), with two more, later added: long-term orientation and indulgence (Hofstede, 2011). Authors such as Salter & Niswander (1995), Zarzeski (1996), Mitchell Williams (1999) and Gallén & de Grado (2016) study the relationship found (positive or negative) between
certain cultural dimensions of Hofstede and the characteristics of CSR information (secrecy, transparency and/or voluntary disclosure). Somoza (2023) studies the possible influence of Hofstede’s cultural dimensions on the decision of SMEs to obtain guarantees for their sustainability reports, concluding that power distance, uncertainty avoidance, and masculinity have a significant and negative impact on the insurance of its sustainability reports.
Therefore, there is a correlation (positive or negative) between Hofstede's cultural dimensions and aspects of sustainability disclosure, and there are even studies based on GRI reports, as Gallén & de Grado (2016). They study the differences in the macroeconomic context of the countries to identify the factors that explain the differences in the supply of sustainability information. For this, they are based on a sample of the 9,570 reports available on the GRI website from 2007-2012, whose countries are quantified in Hofstede's model. Analyzing factors such as governance or globalization, they empirically show that the macroeconomic context of the countries can explain the disclosure of corporate social responsibility information. Disclosure depends on the country’s culture, governance (understood as the set of traditions and institutions that determine how authority is exercised in a country), and economic factors such as foreign direct investment. Their analysis shows different works that have considered the cultural dimensions of Hofstede to assess aspects such as transparency versus secrecy or voluntariness in disclosure.
As a country can not only be defined by its cultural dimensions, the approaches dealing with the country variable in different analyzed investigations are very diverse. For example, some studies focus on aspects of the country, such as the legal or financial framework (Albers & Günther, 2010; Gallén & de Grado, 2016; Ho & Taylor, 2007; Webb et al., 2008); cultural aspects (Bonsón & Escobar, 2004; Frías Aceituno et al., 2013; Gallén & de Grado, 2016); geographic location (Rojas et al., 2020) or per capita income (Gallén & de Grado, 2016). There are also studies focused on specific countries (Gamerschlag et al., 2011).
It can be seen that there is considerable consensus that individualism (and uncertainty avoidance) is negatively (positively) related to secrecy and positively (negatively) related to transparency and voluntary disclosure of information. However, the results are more disparate regarding the rest of the dimensions, masculinity and power distance.
Based on this literature, it is considered that the country's characterization according to the cultural dimensions of Hofstede is relevant and influences the disclosure and the type of sustainability information companies provide. Therefore, the following hypotheses are formulated to be tested in this work:
Hypothesis 2a: The country is independent of the type of report.
Hypothesis 2b: The country is independent of the level of adherence to GRI standards.
Hypothesis 2c: The country is independent of the explicit reference to the use of the guidelines of the OECD in the report.
Hypothesis 2d: The country is independent of the explicit reference to the use of the Global Compact for the United Nations and its principles in the report.
Hypothesis 2e: The country is independent of the Implementation of the ISO international standard 26000.
Hypothesis 2f: The country is independent of the existence of an expert opinion and stakeholders in the report.
Hypothesis 2g: The country is independent of whether the reports have been verified externally.
Among the factors studied to verify their influence on the disclosure of sustainability information is the public or private nature of the entity. Although most of the research has focused on private-sector organizations, some publications have analyzed the disclosure of sustainability reports in the public sector.
The sustainability reports of the public sector advance more slowly than other sectors, despite its relevance in society (50% of the economic activity and the employees of a country go through this type of organization), and that this sector assumes more social and environmental responsibility than private companies (de Oliveira Bellini et al., 2019). It is supported that it is necessary to expand research on the sustainability information reported by the public sector, highlighting that the studies focus mainly on developed nations, with a significant lack of knowledge regarding what they are reporting in developing countries (Kaur & Lodhia, 2019). Public companies have to promote the preparation of sustainability information, given that this information allows for exploring environmental or social problems, such as climate change, waste management, biodiversity, or water.
If we focus on the GRI standards, a possible reason for not obtaining conclusive results could be their inadequacy for the public sector, which should be differentiated from those of the private sector (Dumay et al., 2010). This same assessment is observed in the study of Colombian companies in the public and private sectors carried out by Suárez-Rico et al. (2021). They highlight that in the public sector, there are limitations in sustainability information due to the extrapolation of private sector issues that are incorporated in the reports of public entities. Therefore, according to these studies, there is no pattern between sustainability reporting and
the type of organization, as sustainability standards and frameworks are designed for private entities.
On the other hand, de Oliveira Bellini et al. (2019) analyze the adherence and disclosure according to GRI of 177 public and state institution's sustainability reports from 2011 to 2017, observing a low percentage of public and state institutions over the total, only 1.8%. In addition, these types of institutions have disclosed their reports with low quality and reliability, the majority being non-integrated reports, without external assurance, and without formalized contributions or comments on the report provided by a panel of interested parties or experts. Ku Ismail & Ibrahim (2008) also conclude from the analysis of annual reports that companies with high state participation tend to have lower disclosure than companies with low state participation (Ku Ismail & Ibrahim, 2008). Nevertheless, some studies show the opposite relationship. For example, Zaid et al. (2020) study the influence of ownership structure on the disclosure of company CSR reports, specifically in companies listed on a stock exchange in Palestine. They find that publicly owned companies result in a more significant number of CSR reports, the most positive effect being when the board’s level of independence is high, in line with the agency’s theory.
In any case, the motivations for disclosing sustainability information are not the same, depending on the type of organization in question, which leads us to include the type of organization in the hypotheses of this study:
Hypothesis 3a: The type of organization is independent of the type of report.
Hypothesis 3b: The type of organization is independent of the level of adherence to GRI standards.
Hypothesis 3c: The type of organization is independent of the explicit reference to the use of OECD guidelines in the report.
Hypothesis 3d: The type of organization is independent of the explicit reference to the use of the United Nations Global Compact and its principles in the report.
Hypothesis 3e: The type of organization is independent of the implementation of the standard International ISO 26000.
Hypothesis 3f: The type of organization is independent of the existence of an opinion of experts and stakeholders in the report.
Hypothesis 3g: The type of organization is independent of whether the reports have been submitted to external verification.
Another aspect to consider is whether or not the company is listed on a stock exchange. The Legitimacy theory justifies more sustainability disclosure by listed companies because it is a way to enable companies to send a sign of credibility to the markets and to satisfy the informative needs of stakeholders (Brammer & Pavelin, 2006). The results of Schiehll & Kolahgar (2021) suggest that share price information is sensitive to specific components of environmental, social, and governance disclosure, in this case, under the Accounting Standards of Sustainability (SASB), for a sample of Canadian companies listed on the S&P/TSX Composite Index. Legitimacy theory supports a relationship between the disclosure of sustainability information and positive capital market impact, as has been checked by other studies such as Haro de Rosario et al. (2011). They conclude that being listed on the stock market positively impacts the volume of information disclosed on CSR. Monteiro & Aibar- Guzmán (2010) investigate the relationship between environmental disclosure and the stock market listing of a sample of 106 large companies in Portugal in the period 2002-2004, finding a positive relationship between being listed on a stock market and the scope of environmental disclosure, this being similar in the context of large companies.
The “win-win proposition” (Levy et al., 2010, p. 90) claims informed stakeholders as a way to reduce information asymmetry and so the cost of capital for companies (Leuz & Verrecchia, 2000). Listed companies go to capital markets to get financial resources and are under the public eye. The win-win proposition works for listed companies, usually large because they find advantages in disclosing sustainability reporting. When analyzing companies that mainly invest in Latin America, these are the results obtained by Ortiz-Martínez & Marín-Hernández (2016) to study the reasons that lead to listed and unlisted companies (in the latter case, with investment abroad) to publish non-financial information. In the cost-benefit assessment, the reduction of capital costs is considerably supported by all the background when greater disclosure and transparency (Botosan, 2006). Although there is very little evidence regarding non-listed companies (Zamil et al., 2023) mainly due to the lack of databases with sustainability information, it is pertinent to increase the knowledge investigating the influence of the listing variable on the characteristics of the GRI reports analyzed.
Requirements of the stock markets regulatory bodies should also be borne in mind because they may constitute an essential factor in determining greater dissemination of sustainability information by listed companies. This significant relationship is found because the company is required or voluntarily seeks to follow international standards where there are more requirements in terms of disclosure and quality of information, as Fathi (2013) defends. Other authors, such as Singhvi & Desai (1971), Cooke (1989), Hossain et al. (1994, 1995) and Robb et al. (2001) reach similar conclusions, considering that international listing is a significant determinant of the level of voluntary disclosure. However, other authors, such as Galani et al. (2012), find that listing in companies does not seem to explain the differences in environmental disclosure practices in Greek companies.
According to this background, we include the last hypotheses to be considered in this work:
Hypothesis 4a: Whether or not the company is listed is independent of the type of report.
Hypothesis 4b: Whether or not the company is listed is independent of the level of adherence to GRI standards.
Hypothesis 4c: Whether or not the company is listed is independent of the explicit reference to the use of the OECD guidelines in the report.
Hypothesis 4d: Whether or not the company is listed is independent of the explicit reference to the use of the United Nations Global Compact and its principles in the report.
Hypothesis 4e: Whether or not the company is listed is independent of the implementation of the ISO 26000 international standard.
Hypothesis 4f: Whether or not the company is listed is independent of the existence of an opinion of experts and stakeholders in the report.
Hypothesis 4g: Whether or not the company is listed is independent of whether the reports have been subjected to external verification.
3. Methodology and sample
The statistical study is based on the information provided by the list of GRI reports that, until December 2021, was published on the GRI website: (after December 2021, it is no longer possible to access the information in the GRI database).
Specifically, the study's information was obtained from the sustainability disclosure database published by the Global Reporting Initiative (GRI) on the 10th. October 2021. This database has been used in other previous studies about sustainability reporting, such as Ortiz-Martínez & Marín-Hernández (2020, 2022).
The sample analyzed comprises a total of 99 reports issued by 45 companies in the waste management sector belonging to the European region. These companies are all those that have published their report in the GRI database in the 2014-2020 period. Hence, the sample coincides with the entire population of companies reported under the GRI standard for that sector and period. The selection made to obtain the sample is included in Table 1.
Table 1. Sample selection parameters
| Selection made | |
|---|---|
| Size | No selection (all companies) |
| Sector | Waste Management |
| Country | No selection (all countries) |
| Region | Europe |
| Report Type | GRI - G4, GRI – Standards |
| Report Year | No selection (all years) |
Source: Own elaboration.
Firstly, a descriptive study has been carried out to determine if there is any type of influence of the country, the size of the company, the type of organization, or the fact that it is a listed company that issues the reports, in the disclosure's characteristics. All this information has been obtained from the GRI database.
Next, the degree of relationship between the independent categorical variables will be determined: country, company size, type of organization, listed company and the dependent variables shown in Table 2. The methodology used is to calculate the statistic Chi-squared proposed by Pearson and its significance level.
The observed level of significance is less than 0.1. So, the result of the test Chi-squared (goodness of fit with categorical variables for a sample) allows us to check the previous hypothesis. When the independence hypothesis is rejected, it is concluded that the variables involved are related, although this statistic will not indicate the strength of association between the variables studied.
The analysis of the existing relationships among the studied variables has been carried out by studying the adjusted typified residues. Using a 95% confidence level, we can say that residues greater than 1.96 report relationships with more cases than should be present if the variables studied were independent. In comparison, residues less than -1.96 indicate associations with fewer cases than expected under the condition of independence.
Finally, a logistic regression analysis establishes the relationships between the dependent variables and the independent variables with which some type of association has been demonstrated.
The indicators analyzed, selected among those reported by the organizations and collected in the GRI database, are shown in Table 2. These indicators are the dependent variables to be considered in the study.
Table 2. List of indicators from the GRI database analyzed (dependent variables)
| VARIABLE | DESCRIPTION | VALUES | HYPOTHESES | |
|---|---|---|---|---|
| 1 | Report Type | The most current reports have been considered: GRI - G4 (published in 2013), valid until June 30, 2018 and GRI - Standards (published in 2016), currently valid. | GRI - GR4 GRI - Standards | 1a,2a,3a,4a |
| 2 | Adherence Level | Reflects the extent to which the Sustainability Reporting Framework has been applied to a report of GRI and the GRI Standards. | Essential Comprehensive Undeclared | 1b,2b,3b,4b |
| 3 | Guidelines of the OECD | Explicit reference to the use of the OECD Guidelines for Multinational Enterprises in the report. | YES NO | 1c,2c,3c,4c |
| 4 | UNGC | Explicit reference to the use of the Global Compact on United Nations and its principles in the report. | YES NO | 1d,2d,3d,4d |
| 5 | ISO26000 | Implementation of the international standard ISO 26000 | YES NO | 1e,2e,3e,4e |
| 7 | Opinion of experts and stakeholders | Formal input or comments on the report provided by a panel of experts | YES NO | 1f,2f,3f,4f |
| 8 | External verification | Reports are subject to external verification | YES NO | 1g,2g,3g,4g |
Source: Own elaboration based on
The level of adherence can be an indicator of the quality of the sustainability reports. For example, Rudyanto & Wimelda (2019) find that companies that report at the comprehensive level focus more on the quality of their report and that shareholders initially perceive that reports at this level are of better quality than those that are made with an introductory or basic adhesion level.
Also, the existence of an external assurance implies a higher quality of non-financial information. According to Ortiz-Martínez & Marín-Hernández (2016), external assurance increases the company's credibility in the eyes of stakeholders. In line with Sìmnett et al. (2009), who conclude that sustainability reports have better quality when external parties audit. The external guarantee in these reports can be seen as a means to improve their reliability, generating a positive influence on the perception of the company's reputation by the interested parties and, therefore, on the company's value.
4. Results
4.1. Profile of companies in the waste management sector that use GRI, characteristics of their non-financial information, and assurance
The 45 companies included in the sample are located in 10 countries with their headquarters (Figure 1).
Figure 1. Countries where the headquarters of the organizations are located
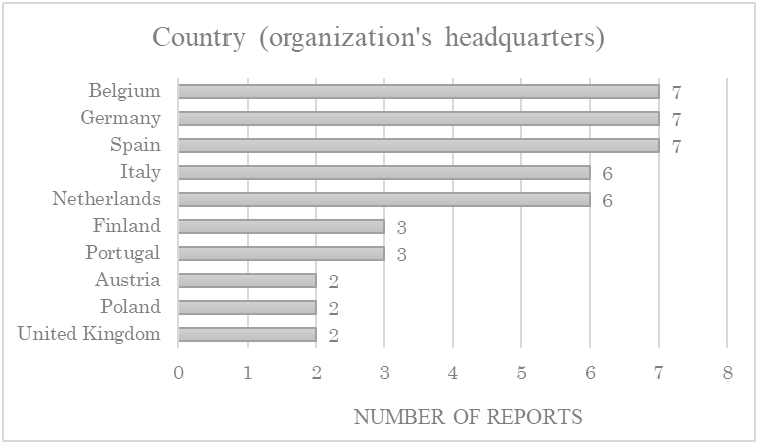
Source: Own elaboration.
Of the companies that make up the study, only 9% are multinationals, with the percentage of SMEs and large companies being 42% and 49%, respectively, as shown in Figure 2 (see classification criteria in Table 3).
Figure 2. Distribution of companies according to their size
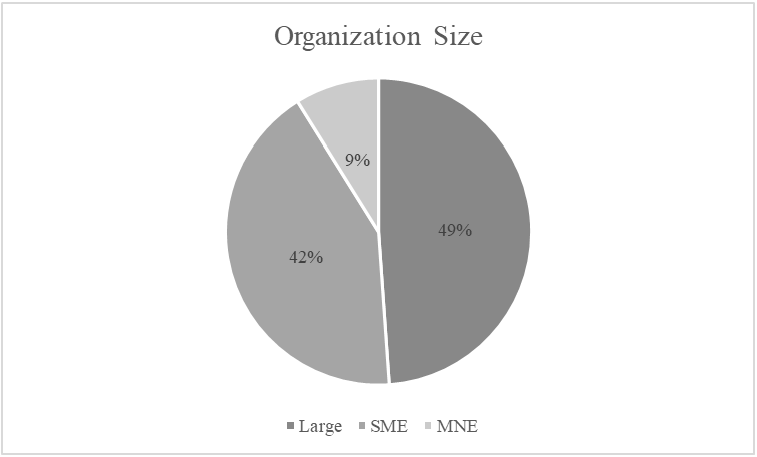
Source: Own elaboration.
Table 3. Classification of companies according to size based on GRI criteria
| Company type | Employees | Turnover | Balance sheet total |
|---|---|---|---|
| SME | < 250 | ≤ € 50 million | ≤ € 43 million |
| Large enterprise | ≥ 250 | > € 50 million | > € 43 million |
| MNE | ≥ 250 and multinational | > € 50 million | > € 43 million |
Source: Own elaboration based on
In Figure 3, we can see that private companies are the ones that mostly report this type of report, representing more than 55% of the total companies analyzed. The next most representative type of organization is non-profit companies, with the rest of the types of organizations being a minority.
Figure 3. Number of companies by type of organization
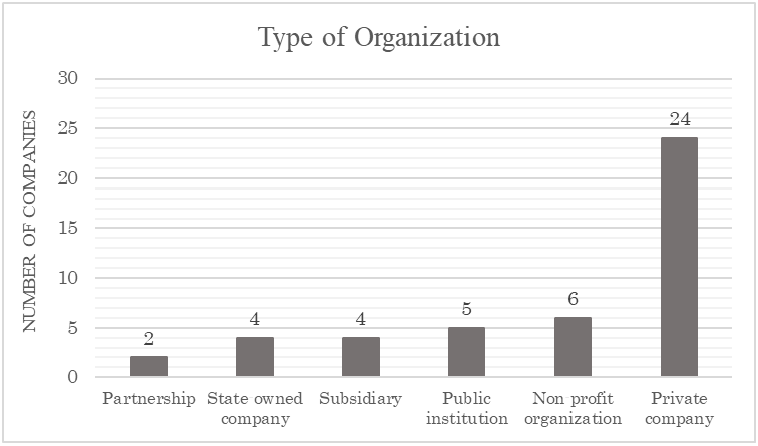
Source: Own elaboration.
According to GRI, most of the waste management sector that discloses sustainability information is unlisted companies, 84%, while 16% of the companies are listed on a stock exchange. These are primarily multinationals, large companies, or SMEs only in the case of Spain. Figure 4 shows the distinction between listed companies and non-listed ones.
Figure 4. Characterization of companies in terms of their listing
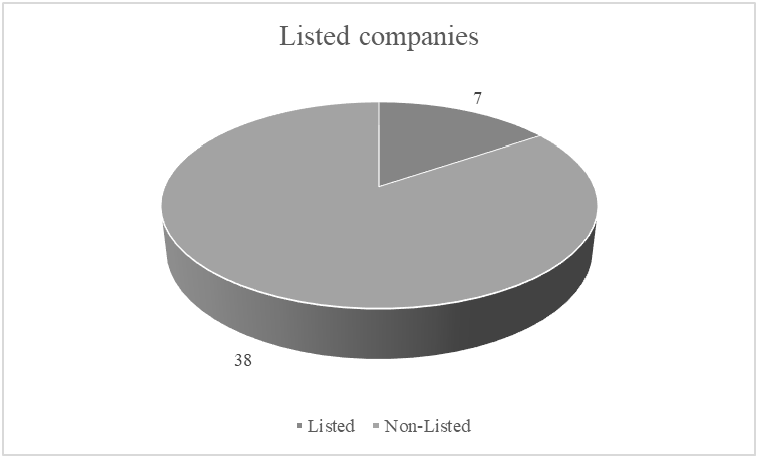
Source: Own elaboration.
Regarding the number of reports per year in which they are published, a growing trend was observed until 2016. The number of published and registered reports gradually decreases, until it represents 5% of the total in the 2020 financial year, as can be seen in Figure 5.
Figure 5. Number of reports by year of publication
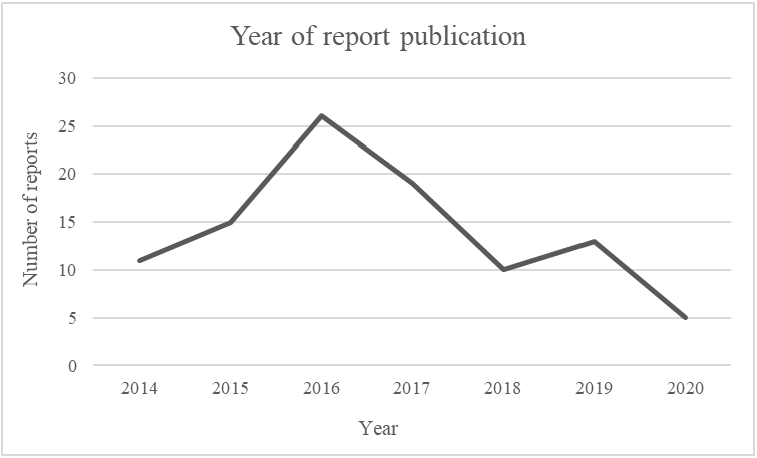
Source: Own elaboration.
The decrease in reports published after 2016 may be because in 2016 the new GRI standards were published, replacing the previous G4 version. However, the use of the new standards was not required until July 1, 2018, the year from which, the graph shows a change in the upward trend in the publication of reports in the GRI database.
Two most recent versions of the GRI Guidelines applied in the report have been considered: GRI - G4 (published in 2013 and valid until June 30, 2018) and GRI - Standards (published in 2016 and valid for reports published until December 31, 2021). In addition, on May 19, 2020, the new GRI 306: Waste 2020 standard was published, which replaces the old GRI 306: Effluents and waste 2016, so that, after January 1, 2022, it will be the most recent that companies must apply if they want to use GRI as a framework for preparing their non-financial or sustainability information.
The reports published per year, based on the version of the GRI Guidelines that are applied, are shown in Table 4. It also shows their level of adherence, which reflects the extent to which the framework for preparing sustainability reports and GRI standards has been applied.
As can be seen, companies have used the GRI-G4 report type until 2017, adopting the GRI- Standards version after that year. In addition, mostly the level of adherence is Essential, that is, the report has been prepared following the standard at its basic level (73%), while only 20% follow the GRI guide thoroughly (adherence level: Comprehensive).
On the other hand, in the case of the GRI - G4 reports, we find 7% of them in which there is no explicit statement “agree”, but the report contains a complete G4 content index.
Table 4. Type of reports by year of publication
| Number of reports | |||||||||
|---|---|---|---|---|---|---|---|---|---|
| Report type | Adherence Level | 2014 | 2015 | 2016 | 2017 | 2018 | 2019 | 2020 | Total |
| GRI - G4 | In accordance - Core | 9 | 12 | 15 | 12 | 1 | 0 | 0 | 49 |
| In accordance - Comprehensive | 2 | 2 | 7 | 3 | 0 | 0 | 0 | 14 | |
| Undeclared | 0 | 1 | 4 | 1 | 1 | 0 | 0 | 7 | |
| TOTAL GRI - G4 | 11 | 15 | 26 | 16 | 2 | 0 | 0 | 70 | |
| GRI - Standards | In accordance - Core | 0 | 0 | 0 | 3 | 6 | 10 | 4 | 23 |
| In accordance - Comprehensive | 0 | 0 | 0 | 0 | 2 | 3 | 1 | 6 | |
| GRI-Referenced | 0 | 0 | 0 | 0 | 0 | 0 | 0 | 0 | |
| TOTAL GRI - Standards | 0 | 0 | 0 | 3 | 8 | 13 | 5 | 29 | |
| TOTAL | In accordance - Core | 9 | 12 | 15 | 15 | 7 | 10 | 4 | 72 |
| In accordance - Comprehensive | 2 | 2 | 7 | 3 | 2 | 3 | 1 | 20 | |
| Undeclared | 0 | 1 | 4 | 1 | 1 | 0 | 0 | 7 | |
| TOTAL REPORT | 11 | 15 | 26 | 19 | 10 | 13 | 5 | 99 | |
Source: Own elaboration.
Concerning the indicators in Table 5, only four reports indicate an explicit reference to links with the OECD guidelines for multinational companies (2011). Moreover, these are reports from two companies, not multinationals, but SMEs, one based in Finland and the other in Spain. It is also noted that 12 reports explicitly reference to links with the principles of the United Nations Global Compact (2000), corresponding to 7 companies, four Spanish, one Italian and two Finnish. However, only one of them systematically mentioned it in all the years in which the report was published.
Regarding the international standard ISO 26000, which guides how to integrate socially responsible behaviour into existing organizational strategies, systems, practices, and processes, only 6% of the reports indicate its implementation.
None of the companies has incorporated a Sustainability Assurance Management system under the AA1000 standard.
Finally, only 12 out of 99 reports include external experts’ opinions or stakeholders’ panels, which represents 12% of the total reports, which mostly correspond to companies that are SMEs (67%). As can be seen, there has been a significant decrease in the inclusion of stakeholders' panels after 2016.
Table 5. Number of reports that include indicators by year of publication
| Number of reports | ||||||||
|---|---|---|---|---|---|---|---|---|
| 2014 | 2015 | 2016 | 2017 | 2018 | 2019 | 2020 | Total | |
| OECD Guidelines | 0 | 0 | 0 | 1 | 0 | 2 | 1 | 4 |
| UNGC | 2 | 2 | 2 | 2 | 1 | 2 | 1 | 12 |
| ISO 26000 | 0 | 0 | 2 | 1 | 0 | 2 | 1 | 6 |
| AA1000 | 0 | 0 | 0 | 0 | 0 | 0 | 0 | 0 |
| Stakeholder Panel/Expert Opinion | 4 | 1 | 6 | 0 | 1 | 0 | 0 | 12 |
Source: Own elaboration.
Finally, after 1st January 2012, information on the assurance by a third party that verifies the level of guarantee of the reported information is recorded in the database.
In this sense, GRI recommends external verification, although it is not mandatory for the report to be “in accordance” with the Guide.
Table 6 shows that 39% of the reports have external verification, 50% of the firm Pricewaterhouse Coopers which provides 36% of the verified information, and therefore one of the Big Four.
Table 6. Number of reports with external verification and providers of verification
| Number of reports | ||||||||
|---|---|---|---|---|---|---|---|---|
| External verification (EV) | 2014 | 2015 | 2016 | 2017 | 2018 | 2019 | 2020 | Total |
| AENOR | 0 | 0 | 0 | 1 | 0 | 1 | 0 | 2 |
| Bureau Veritas | 0 | 0 | 0 | 1 | 1 | 0 | 0 | 2 |
| Ernst & Young | 2 | 1 | 1 | 1 | 1 | 3 | 0 | 9 |
| KPMG | 0 | 1 | 2 | 2 | 0 | 1 | 1 | 7 |
| Pricewaterhouse Coopers | 1 | 1 | 6 | 4 | 1 | 1 | 0 | 14 |
| Other | 0 | 1 | 2 | 1 | 0 | 0 | 1 | 5 |
| Total | 3 | 4 | 11 | 10 | 3 | 6 | 2 | 39 |
| Total reports | 11 | 15 | 26 | 19 | 10 | 13 | 5 | 99 |
| % of reports with EV | 27% | 27% | 42% | 53% | 30% | 46% | 40% | 39% |
Source: Own elaboration.
This percentage is far from the 51% independent assurance of sustainability information reflected in the KPMG report (KPMG, 2020) for the N100 sample and the 71% in the G250 companies that report sustainability reports.
4.2. Size, country, type of organization, and listing on a stock exchange as determinants of the characteristics of the non-financial information of the waste management companies that use GRI
The study's objective is to determine the influence of certain characteristics of the waste management companies that report their sustainability reports under the GRI standards. The analyzed characteristics are their size, the country in which they are geographically located, the legal form they adopt, and whether or not they are listed on a stock market. Nevertheless, first, an analysis has been carried out to predict whether the size variable is significant in determining the characteristics of the GRI reports of the companies studied in terms of the dependent variables considered.
As mentioned above, the values taken by the size variable in the GRI database are SME, large company, and large company and multinational. Given that the economic parameters taken into account for the last two values are the same, differing only in whether the company is
multinational, these two categories have been gathered in a single one. Therefore, the categories of size variable are SME or large company (understanding, in the latter case, that it also includes multinationals).
Regarding the host countries of the organizations considered in the sample (Austria, Belgium, Finland, Germany, Italy, the Netherlands, Poland, Portugal, Spain, and the United Kingdom), their cultural dimensions have been analyzed according to the model of Hofstede’s national culture (Hofstede, 2001). To do this, have borne in mind the scores of these dimensions available at . Table 7 shows the values of each of the six dimensions of the model (PDI: Power Distance, IDV: Individualism, MAS: Masculinity, UAI: Uncertainty Aversion, ITOWVS: Long-Term Orientation, IVR: Indulgence).
Table 7. Quantification of the Hofstede dimensions for the countries in the sample
| DIMENSION | ||||||
|---|---|---|---|---|---|---|
| COUNTRY | PDI | IDV | MAS | UAI | ITOWVS | IVR |
| Germany | 35 | 67 | 66 | 65 | 83 | 40 |
| Austria | 11 | 55 | 79 | 70 | 60 | 63 |
| Belgium | 65 | 75 | 54 | 94 | 82 | 57 |
| Spain | 57 | 51 | 42 | 86 | 48 | 44 |
| Finland | 33 | 63 | 26 | 59 | 38 | 57 |
| Italy | 50 | 76 | 70 | 75 | 61 | 30 |
| Netherlands | 38 | 80 | 14 | 53 | 67 | 68 |
| Poland | 68 | 60 | 64 | 93 | 38 | 29 |
| Portugal | 63 | 27 | 31 | 104 | 28 | 33 |
| United Kingdom | 35 | 89 | 66 | 35 | 51 | 69 |
Source: Own elaboration from
There is evidence of the influence of individualism and aversion to uncertainty in the transparency or voluntariness of sustainability disclosure. In line with these results, the countries have been grouped according to the relationship: individualism - aversion to uncertainty, which is reflected in Figure 6, from which three groups of countries have been established:
- Group 1: Countries with a high score in individualism and uncertainty avoidance.
- Group 2: Countries scoring high on individualism and low on uncertainty avoidance.
- Group 3: Countries scoring low on individualism and high on uncertainty avoidance.
None of these countries correspond to a low score in both dimensions.
Figure 6. Culture dimensions in 2-D: Individualism (IDV) and aversion to uncertainty (UAI)
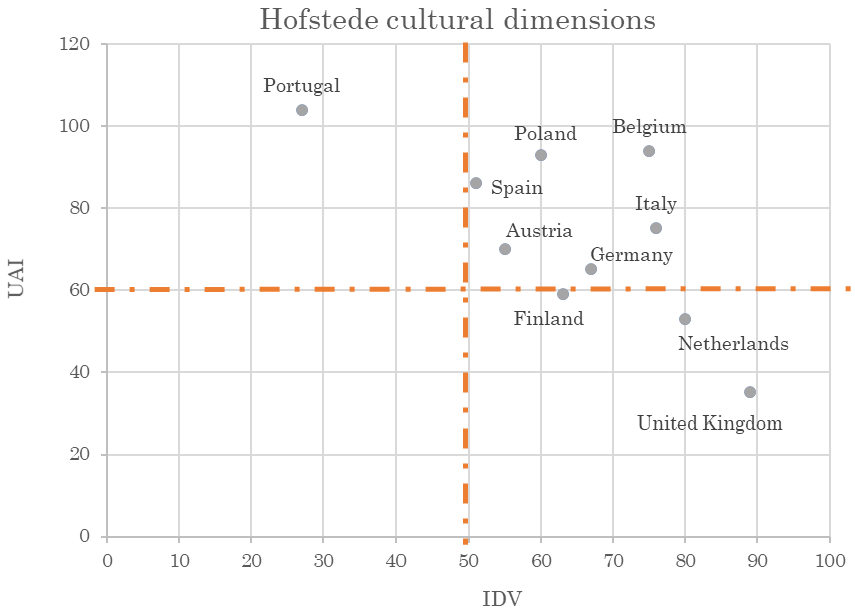
Source: Own elaboration from https://geerthofstede.com/research-andvsm/dimension-data-matrix/
The different types of organizations that GRI considers when classifying the companies that report information in its database are state companies, private companies, public institutions, subsidiaries, associations, and non-profit organizations.
To determine whether public or private ownership is a determining factor in the way in which organizations report their sustainability information, a new grouping of the types of organization has been made based on the predominant nature of their ownership, this being:
- Public organization: state company and public institution.
- Private organization: private company, subsidiary and association.
- Non-profit organization: non-profit organization.
Regarding the listing on a stock exchange, the possible values offered by the GRI database are: listed, unlisted and not applicable. Only 3 of the 45 companies analyzed have information on this variable that does not apply, two public institutions and the third a non-profit organization, which have been reclassified as unlisted. Therefore, this variable will take two possible values: listed and unlisted.
The independent variables considered are those shown in Table 8.
Table 8. Independent variables of the study
| VARIABLE | DESCRIPTION | VALUES | HYPOTHESES | |
|---|---|---|---|---|
| 1 | Size of the company | SME: Less than 250 employees, turnover ≤ €50 million, balance sheet total ≤ €43 million. Large company: More than 250 employees, turnover > €50 million, balance sheet total > €43 million. | SME Large company | 1a,1b,1c,1d,1e,1f,1g |
| 2 | Country | Group 1: Countries with a high score in individualism and uncertainty aversion. Group 2: Countries that score high on individualism and low on aversion to uncertainty. Group 3: Countries with a low score on individualism and a high score on uncertainty aversion. | Group 1: Portugal Group 2: Germany,Austria, Belgium,Spain, Italy and Poland Group 3: Finland, Netherlands and United Kingdom | 2a,2b,2c,2d,2e,2f,2g |
| 3 | Organization Type | Public organization: state-owned company, public institution. Private organization: private company, subsidiary, partnership, non-profit organization. | Public Private Non-profit | 3a,3b,3c,3d,3e,3f,3g |
| 4 | Listing | Listing of the reporting company on a stock exchange. | Listed Non-listed | 4a,4b,4c,4d,4e,4f,4g |
Source: Own elaboration.
Next, the contingency tables are included, including the frequencies (in number and percentage) that result when crossing each category of each of the four independent variables considered with the categories of the dependent variables of the study.
Table 9 shows the contingency table for the independent variable Size for each dependent variable.
Table 9. Contingency table for the Size variable
| SIZE (number / %) | |||||||
|---|---|---|---|---|---|---|---|
| Large | SME | Total | |||||
| Report type | GRI - G4 | 37 | 78.7% | 33 | 63.5% | 70 | 70.7% |
| GRI - Standards | 10 | 21.3% | 19 | 36.5% | 29 | 29.3% | |
| Total | 47 | 100.0% | 52 | 100.0% | 99 | 100.0% | |
| Adherence Level | IA - Comprehensive | 6 | 12.8% | 14 | 26.9% | 20 | 20.2% |
| IA - Core | 37 | 78.7% | 35 | 67.3% | 72 | 72.7% | |
| Undeclared | 4 | 8.5% | 3 | 5.8% | 7 | 7.1% | |
| Total | 47 | 100.0% | 52 | 100.0% | 99 | 100.0% | |
| OECD Guidelines | YES | 0 | 0.0% | 4 | 7.7% | 4 | 4.0% |
| NO | 47 | 100.0% | 48 | 92.3% | 95 | 96.0% | |
| Total | 47 | 100.0% | 52 | 100.0% | 99 | 100.0% | |
| UNGC | YES | 3 | 6.4% | 9 | 17.3% | 12 | 12.1% |
| NO | 44 | 93.6% | 43 | 82.7% | 87 | 87.9% | |
| Total | 47 | 100.0% | 52 | 100.0% | 99 | 100.0% | |
| ISO 26000 | YES | 2 | 4.3% | 4 | 7.7% | 6 | 6.1% |
| NO | 45 | 95.7% | 48 | 92.3% | 93 | 93.9% | |
| Total | 47 | 100.0% | 52 | 100.0% | 99 | 100.0% | |
| Expert Opinion | YES | 4 | 8.5% | 8 | 15.4% | 12 | 12.1% |
| NO | 43 | 91.5% | 44 | 84.6% | 87 | 87.9% | |
| Total | 47 | 100.0% | 52 | 100.0% | 99 | 100.0% | |
| External verification | YES | 19 | 40.4% | 20 | 38.5% | 39 | 39.4% |
| NO | 28 | 59.6% | 32 | 61.5% | 60 | 60.6% | |
| Total | 47 | 100.0% | 52 | 100.0% | 99 | 100.0% | |
Source: Own elaboration.
Regardless of their size, most companies report under the GRI-GR4 report type, and with a fundamental adherence level, the trend is more pronounced in large companies than in SMEs.
Only four of 99 reported reports follow the OECD guidelines, corresponding to two SMEs and private companies. The rest of the SMEs and all large companies do not expressly indicate the adoption of these guidelines in their information.
Nor is the general rule the explicit reference to the use of the United Nations Global Compact and its principles (UNGC) in the report. Only 12.1% of the reports include this reference, mainly SMEs, which is reproduced in the implementation of the ISO 26000 standard, which only occurs in 6.06% of the reports, mostly reported by SMEs.
12.1% of the reports contain a formal contribution from a panel of experts, being 8.5% in the case of large companies, somewhat lower than in the case of SMEs (15.4%). However, the percentage of reports externally verified is higher in both types of companies. Approximately 40% of the reports have been subject to this verification.
In Table 10, we can see the contingency table corresponding to the independent variable Country.
Table 10. Country variable contingency table
| COUNTRY (number / %) | |||||||||
|---|---|---|---|---|---|---|---|---|---|
| Group 1 | Group 2 | Group 3 | Total | ||||||
| Report type | GRI - G4 | 6 | 66.7% | 47 | 71.2% | 17 | 70.8% | 70 | 70.7% |
| GRI – Standards | 3 | 33.3% | 19 | 28.8% | 7 | 29.2% | 29 | 29.3% | |
| Total | 9 | 100.0% | 66 | 100.0% | 24 | 100.0% | 99 | 100.0% | |
| Adherence Level | IA – Comprehensive | 2 | 22.2% | 15 | 22.7% | 3 | 12.5% | 20 | 20.2% |
| IA – Core | 5 | 55.6% | 50 | 75.8% | 17 | 70.8% | 72 | 72.7% | |
| Undeclared | 2 | 22.2% | 1 | 1.5% | 4 | 16.7% | 7 | 7.1% | |
| Total | 9 | 100.0% | 66 | 100.0% | 24 | 100.0% | 99 | 100.0% | |
| OECD Guidelines | YES | 0 | 0.0% | 1 | 1.5% | 3 | 12.5% | 4 | 4.0% |
| NO | 9 | 100.0% | 65 | 98.5% | 21 | 87.5% | 95 | 96.0% | |
| Total | 9 | 100.0% | 66 | 100.0% | 24 | 100.0% | 99 | 100.0% | |
| UNGC | YES | 0 | 0.0% | 10 | 15.2% | 2 | 8.3% | 12 | 12.1% |
| NO | 9 | 100.0% | 56 | 84.8% | 22 | 91.7% | 87 | 87.9% | |
| Total | 9 | 100.0% | 66 | 100.0% | 24 | 100.0% | 99 | 100.0% | |
| ISO 26000 | YES | 0 | 0.0% | 3 | 4.5% | 3 | 12.5% | 6 | 6.1% |
| NO | 9 | 100.0% | 63 | 95.5% | 21 | 87.5% | 93 | 93.9% | |
| Total | 9 | 100.0% | 66 | 100.0% | 24 | 100.0% | 99 | 100.0% | |
| Expert Opinion | YES | 1 | 11.1% | 9 | 13.6% | 2 | 8.3% | 12 | 12.1% |
| NO | 8 | 88.9% | 57 | 86.4% | 22 | 91.7% | 87 | 87.9% | |
| Total | 9 | 100.0% | 66 | 100.0% | 24 | 100.0% | 99 | 100.0% | |
| External verification | YES | 2 | 22.2% | 25 | 37.9% | 12 | 50.0% | 39 | 39.4% |
| NO | 7 | 77.8% | 41 | 62.1% | 12 | 50.0% | 60 | 60.6% | |
| Total | 9 | 100.0% | 66 | 100.0% | 24 | 100.0% | 99 | 100.0% | |
Source: Own elaboration.
About the type of report (GRI-G4 or GRI-Standard), there are no significant differences in the percentage of reports that are reported under one or the other, depending on the country group considered, although, in group 1, it is observed greater reporting following GRI-Standards.
There is a high lack of declaration of the level of adherence in companies from groups 1 and 3 countries. However, all the country groups are higher in the reports produced with an essential level of adherence.
The companies located in group 3 of countries are the ones that most apply the OECD guidelines in their reports. On the other hand, none of the companies in Group 1 have indicated adopting these guidelines by the OECD.
Concerning the UNGC reference, group 2 of countries is the one that makes the most explicit reference to it in its reports, followed by group 3, compared to group 1, which does not include this reference in any of its reports.
The trend in all groups of countries regarding comments on the report by a panel of experts is similar. It oscillates between 8% and 14% of reports that include this type of observation in the three groups of countries.
The companies located in the countries of group 3 are the ones that most use external verification of their reports (50%). Companies of group 2 present a lower percentage of reports providing assurance (22.2%).
The contingency table that results from considering the independent variable Type of organization is shown in Table 11.
Table 11. Contingency table of the variable Type of organization
| TYPE OF ORGANIZATION (number / %) | |||||||||
|---|---|---|---|---|---|---|---|---|---|
| Private | Public | Non-profit organization | Total | ||||||
| Report type | GRI - G4 | 40 | 70.2% | 14 | 60.9% | 16 | 84.2% | 70 | 70.7% |
| GRI - Standards | 17 | 29.8% | 9 | 39.1% | 3 | 15.8% | 29 | 29.3% | |
| Total | 57 | 100.0% | 23 | 100.0% | 19 | 100.0% | 99 | 100.0% | |
| Adherence Level | IA - Comprehensive | 4 | 7.0% | 12 | 52.2% | 4 | 21.1% | 20 | 20.2% |
| IA - Core | 48 | 84.2% | 9 | 39.1% | 15 | 78.9% | 72 | 72.7% | |
| Undeclared | 5 | 8.8% | 2 | 8.7% | 0 | 0.0% | 7 | 7.1% | |
| Total | 57 | 100.0% | 23 | 100.0% | 19 | 100.0% | 99 | 100.0% | |
| OECD Guidelines | YES | 4 | 7.0% | 0 | 0.0% | 0 | 0.0% | 4 | 4.0% |
| NO | 53 | 93.0% | 23 | 100.0% | 19 | 100.0% | 95 | 96.0% | |
| Total | 57 | 100.0% | 23 | 100.0% | 19 | 100.0% | 99 | 100.0% | |
| UNGC | YES | 9 | 15.8% | 1 | 4.3% | 2 | 10.5% | 12 | 12.1% |
| NO | 48 | 84.2% | 22 | 95.7% | 17 | 89.5% | 87 | 87.9% | |
| Total | 57 | 100.0% | 23 | 100.0% | 19 | 100.0% | 99 | 100.0% | |
| ISO 26000 | YES | 3 | 5.3% | 1 | 4.3% | 2 | 10.5% | 6 | 6.1% |
| NO | 54 | 94.7% | 22 | 95.7% | 17 | 89.5% | 93 | 93.9% | |
| Total | 57 | 100.0% | 23 | 100.0% | 19 | 100.0% | 99 | 100.0% | |
| Expert Opinion | YES | 8 | 14.0% | 3 | 13.0% | 1 | 5.3% | 12 | 12.1% |
| NO | 49 | 86.0% | 20 | 87.0% | 18 | 94.7% | 87 | 87.9% | |
| Total | 57 | 100.0% | 23 | 100.0% | 19 | 100.0% | 99 | 100.0% | |
| External verification | YES | 28 | 49.1% | 9 | 39.1% | 2 | 10.5% | 39 | 39.4% |
| NO | 29 | 50.9% | 14 | 60.9% | 17 | 89.5% | 60 | 60.6% | |
| Total | 57 | 100.0% | 23 | 100.0% | 19 | 100.0% | 99 | 100.0% | |
Source: Own elaboration.
As can be seen, most of the reports are reported under the GRI-G4 type, regardless of the type of organization.
Regarding the level of adherence, private companies and non-profit organizations are the ones that primarily use the type of essential report as opposed to the comprehensive one, inverting the proportion in the case of public entities, which mainly use the report with a comprehensive adherence level.
Only some private companies apply the OECD guidelines in the reports. Public companies are the ones that least include an express mention of the UNGC principles. Finally, non-profit organizations are the most have implemented the ISO 26000 standard.
It does not mainly include in the reports the opinion of a panel of experts. Regarding external verification, almost half of the reports of private companies hire it, and almost 40% of public companies.
Finally, the contingency table that results from crossing the independent variable Listing on a stock exchange with the different categories of the dependent variables is shown in Table 12.
Table 12. Contingency table of the Listing variable
| LISTING (number / %) | |||||||
|---|---|---|---|---|---|---|---|
| Listed | Non-listed | Total | |||||
| Report type | GRI - G4 | 11 | 50.0% | 59 | 76.6% | 70 | 70.7% |
| GRI - Standards | 11 | 50.0% | 18 | 23.4% | 29 | 29.3% | |
| Total | 22 | 100.0% | 77 | 100.0% | 99 | 100.0% | |
| Adherence Level | IA - Comprehensive | 5 | 22.7% | 15 | 19.5% | 20 | 20.2% |
| IA - Core | 16 | 72.7% | 56 | 72.7% | 72 | 72.7% | |
| Undeclared | 1 | 4.5% | 6 | 7.8% | 7 | 7.1% | |
| Total | 22 | 100.0% | 77 | 100.0% | 99 | 100.0% | |
| OECD Guidelines | SI | 1 | 4.5% | 3 | 3.9% | 4 | 4.0% |
| NO | 21 | 95.5% | 74 | 96.1% | 95 | 96.0% | |
| Total | 22 | 100.0% | 77 | 100.0% | 99 | 100.0% | |
| UNGC | YES | 7 | 31.8% | 5 | 6.5% | 12 | 12.1% |
| NO | 15 | 68.2% | 72 | 93.5% | 87 | 87.9% | |
| Total | 22 | 100.0% | 77 | 100.0% | 99 | 100.0% | |
| ISO 26000 | YES | 0 | 0.0% | 6 | 7.8% | 6 | 6.1% |
| NO | 22 | 100.0% | 71 | 92.2% | 93 | 93.9% | |
| Total | 22 | 100.0% | 77 | 100.0% | 99 | 100.0% | |
| Expert Opinion | YES | 3 | 13.6% | 9 | 11.7% | 12 | 12.1% |
| NO | 19 | 86.4% | 68 | 88.3% | 87 | 87.9% | |
| Total | 22 | 100.0% | 77 | 100.0% | 99 | 100.0% | |
| External verification | YES | 16 | 72.7% | 23 | 29.9% | 39 | 39.4% |
| NO | 6 | 27.3% | 54 | 70.1% | 60 | 60.6% | |
| Total | 22 | 100.0% | 77 | 100.0% | 99 | 100.0% | |
Source: Own elaboration.
The characteristics of the reports of listed and unlisted companies, in terms of adherence level, OECD guidelines, ISO 26000 and expert opinion are very similar in both companies.
The differences are observed, mainly, in the type of report, since the non-listed companies mainly use the GRI-G4 version (76.6%) compared to 50% of listed companies. Also, in the UNGC reference, only 6.5% of unlisted companies include it in their reports, compared to 31.8% of listed companies. Finally, in terms of external assurance, the percentage of reports of listed companies verified by an external party (72.7%) is similar to the percentage of these reports in the case of non-listed companies that are not (70.1%).
The degree of significance obtained in the Pearson Chi-square test for all the crosses of variables collected in the contingency tables is included in Table 13.
Table 13. Pearson’s Chi-square test results
| Chi-square of Pearson | |||||||||
|---|---|---|---|---|---|---|---|---|---|
| SIZE | COUNTRY | TYPE OF ORGANIZATION | LISTED | ||||||
| Valor | Asymptotic significance (bilateral) | Valor | Asymptotic significance (bilateral) | Valor | Asymptotic significance (bilateral) | Valor | Asymptotic significance (bilateral) | ||
| Report type | 2.776 | 0.096* | 0.079 | 0.961 | 2.755 | 0.252 | 5.856 | 0.016** | |
| Adherence Level | 3.154 | 0.207 | 10.319 | 0.035** | 22.916 | 0.000** | 0.344 | 0.842 | |
| OECD Guidelines | 3.768 | 0.052* | 5.894 | 0.052* | 3.071 | 0.215 | 0.019 | 0.891 | |
| UNGC | 2.766 | 0.096* | 2.134 | 0.344 | 2.070 | 0.355 | 10.302 | 0.001** | |
| ISO 26000 | 0.512 | 0.474 | 2.595 | 0.273 | 0.848 | 0.655 | 1.825 | 0.177 | |
| Expert Opinion | 1.095 | 0.295 | 0.474 | 0.789 | 1.053 | 0.591 | 0.061 | 0.805 | |
| External verification | 0.040 | 0.842 | 2.306 | 0.316 | 8.892 | 0.012** | 13.164 | 0.000** | |
* Associated probability < 0,1.
** Associated probability < 0,05.
Source: Own elaboration.
As can be seen, there is a significant relationship between the size of the company and the type of report presented, the reference to the use of OECD guidelines, and the use of the principles of the United Nations Global Compact (UNGC). The significance level is less than 0.1, with no evidence of influence on the rest of the dependent variables.
The country variable influences the level of adherence and the use of the OECD guidelines, in the first case, with a significance level of less than 0.05.
Regarding the type of organization, we found that it can influence the level of adherence and the existence of external verification in the reports. In addition, this last indicator is also affected by company listing, which influences the type of report and the mention of the United Nations Global Compact principles application.
Only for these variables are the hypotheses met, that is, it is checked, the independence between these variables and the independent variables of the study.
Consequently, we can affirm that initially, the proposed hypotheses could be rejected since, in all cases, we found some dependency in one of the variables analyzed.
4.3. Regression models
Next, an interpretation of the meaning of the association detected in the Chi-square test is made, through the analysis of the adjusted standardized residuals, showing the results in Table 14.
In the case of the dependent variable Level of adherence, given that it can take three possible values since there are some reports in which the level of adherence has not been indicated (“not declared”), it has been decided to eliminate it from the database. Data records corresponding to this classification work as a dichotomous variable.
Table 14. Adjusted standardized residuals
| Adjusted standardized residuals | |||||||||||
|---|---|---|---|---|---|---|---|---|---|---|---|
| SIZE | COUNTRY | TYPE OF ORGANIZATION | LISTED | ||||||||
| Large company | SME | Group 1 | Group 2 | Group 3 | Private | Public | Non-profit | Listed | Non-listed | ||
| Report type | GRI - G4 | 1.67 | -1.67 | -2.42 | 2.42 | ||||||
| GRI - Standards | -1.67 | 1.67 | 2.42 | -2.42 | |||||||
| Adherence Level | IA - Comprehensive | 0.46 | 0.48 | -0.83 | -3.72 | 4.48 | -0.08 | ||||
| IA - Core | -0.46 | -0.48 | 0.83 | 3.72 | -4.48 | 0.08 | |||||
| OECD Guidelines | YES | -1.94 | 1.94 | -0.65 | -1.80 | 2.42 | |||||
| NO | 1.94 | -1.94 | 0.65 | 1.80 | -2.42 | ||||||
| UNGC | YES | -1.66 | 1.66 | 3.21 | -3.21 | ||||||
| NO | 1.66 | -1.66 | -3.21 | 3.21 | |||||||
| External verification | YES | 2.31 | -0.03 | -2.86 | 3.63 | -3.63 | |||||
| NO | -2.31 | 0.03 | 2.86 | -3.63 | 3.63 | ||||||
Source: Own elaboration.
Listed companies tend to prepare GRI-Standard-type reports and include the mention of UNGC compared to non-listed companies. They are also the most likely to have their reports verified by an outside expert. This result may be because listed companies tend to be larger, and they compile this information on a mandatory basis because it is required by the capital market supervisory body, its interest groups, or the regulations of their country of origin.
Countries belonging to groups 1 (high individualism and uncertainty avoidance scores) and 2 (high individualism and low uncertainty avoidance scores) are more likely to report at a comprehensive level. Countries of groups 1 and 2 are also used to including the OECD reporting guidelines. Countries in group 3 (low individualism score and high uncertainty avoidance score) report at an essential level without integrating the OECD guidelines. This result is consistent with studies showing that individualism positively relates to transparency and voluntary disclosure of information (Gray, 1988; Salter & Niswander, 1995; Zarzeski, 1996).
Regarding the size of the company, it is observed that the SMEs include the OECD guidelines in their reports more frequently than the large companies, not observing a clear trend in the association that exists with the type of report or with the mention of UNGC. Moreover, since the OECD guidelines are general, it is easier to comply with them, which would explain SMEs' greater tendency to include them.
Private companies usually use an essential level of adherence. Only a few private companies declare an exhaustive level of adherence. The opposite happens for public companies, which is consistent with the fact that it is expected that this type of company will be an example of responsibility. In addition, reports from private companies are more likely to be verified by a third-party assurer. In contrast, non-profit companies are more likely not to have their reports verified by an external insurer.
Once the meaning of the relationships between the different variables has been analyzed, a binary logistic regression has been carried out to define a model through which a dichotomous dependent variable (type of report, OECD guidelines, UNGC and external verification) can be predicted based on a series of independent variables (size, country, type of organization and price).
By performing a binary logistic regression, we will determine the relationship between the dependent variables considered and the independent variables with which some association has been found previously.
The variables included in the models have been coded with the values indicated in Table 15.
Table 15. Values of the coded variables
| Variables to predict | Value | Coding |
|---|---|---|
| Report type | GRI - G4 | 0 |
| GRI - Standards | 1 | |
| Adherence level | IA - Comprehensive | 0 |
| IA - Core | 1 | |
| OECD Guidelines | YES | 1 |
| NO | 0 | |
| UNGC | YES | 1 |
| NO | 0 | |
| External verification | YES | 1 |
| NO | 0 | |
| Predictor variables | Value | Coding |
| Size | Large company | 0 |
| SME | 1 | |
| Country | Group 1 | 1 |
| Group 2 | 2 | |
| Group 3 | 3 | |
| Organization type | Private | 1 |
| Public | 2 | |
| Non-profit | 3 | |
| Listing | Listed | 0 |
| Non-listed | 1 |
Source: Own elaboration.
The results obtained are shown in Table 16.
Table 16. Results of the binary logistic regression model.
| B | Err. Est. | Wald | df | Sign. | Exp(B) | % Global | |
|---|---|---|---|---|---|---|---|
| Report type | |||||||
| Size | 0.78 | 0.47 | 2.71 | 1 | 0.100 | 2.18 | 72.70% |
| Listing | -1.21 | 0.51 | 5.51 | 1 | 0.019 | 0.30 | |
| Constant | -0.43 | 0.51 | 0.71 | 1 | 0.400 | 0.65 | |
| Adherence Level | |||||||
| Country | 0.22 | 0.52 | 0.18 | 1 | 0.669 | 1.25 | 78.30% |
| Organization type | -0.65 | 0.31 | 4.28 | 1 | 0.038 | 0.52 | |
| Constant | 1.96 | 1.34 | 2.15 | 1 | 0.143 | 7.10 | |
| OECD Guidelines | |||||||
| Size | 20.78 | 6800.2 | 9,33 x 10⁻⁶ | 1 | 0.998 | 1,1 x 10⁹ | 96.0% |
| Country | 2.89 | 1.22 | 5.64 | 1 | 0.018 | 18.00 | |
| Constant | -30.13 | 6800.2 | 1,96 x 10⁻⁵ | 1 | 0.996 | 8,19 x 10⁻¹⁴ | |
| UNGC | |||||||
| Size | 1.20 | 0.74 | 2.64 | 1 | 0.104 | 3.32 | 87.9% |
| Listing | -1.96 | 0.67 | 8.54 | 1 | 0.003 | 0.14 | |
| Constant | -1.48 | 0.68 | 4.76 | 1 | 0.029 | 0.23 | |
| External verification | |||||||
| Organization type | -0.68 | 0.33 | 4.32 | 1 | 0.038 | 0.51 | 70.7% |
| Listing | -1.58 | 0.55 | 8.15 | 1 | 0.004 | 0.21 | |
| Constant | 1.83 | 0.64 | 8.24 | 1 | 0.004 | 6.26 | |
Source: Own elaboration.
The global percentages indicate that the model is reliable. The success of the percentage obtained amounts to 70.7% in the external verification variable, reaching 96 % in the case of the OECD guidelines.
The Exp(B) column shows the value of the Odd Ratio. This ratio indicates that for the variable type of report, it is 2.18 times more likely that a large company will prepare a type of GRI report - G4 that is carried out by an SME and, likewise, it is 3.32 times more likely that a large company includes the mention of the UNGC in the report compared to an SME.
However, considering the significance of the independent variables, it is observed that they are not significant: the country in the case of the level of adherence and the size in the OECD guidelines. For this reason, a binary logistic regression has been carried out again for the dependent variables' level of adherence and OECD guidelines, considering only the significant independent variable, as shown in Table 17.
Table 17. Results of the binary logistic regression model for the variable's level of adherence and OECD guidelines
| B | Err. Est. | Wald | df | Sign. | Exp(B) | % Global | |
|---|---|---|---|---|---|---|---|
| Adherence Level | |||||||
| Organization type | -0.67 | 0.31 | 4.84 | 1 | 0.028 | 0.51 | 78.30% |
| Constant | 2.47 | 0.63 | 15.31 | 1 | 0.000 | 11.79 | |
| OECD Guidelines | |||||||
| Country | 2.26 | 1.16 | 3.81 | 1 | 0.051 | 9.61 | 96.0% |
| Constant | -8.73 | 3.20 | 7.42 | 1 | 0.006 | 0.00 | |
Source: Own elaboration.
As shown in Table 17, the global percentages that indicate the model's predictive capacity are maintained in both variables, level of adherence and OECD guidelines, when only the independent variables type of organization and country, respectively, are included in the logistic regression model.
The equations of the binary logistic regression model are those shown in Table 18, the probability that a report belongs to one of the two binary categories of the dependent variable.
Table 18. Logistic function for calculating the probability
| Dependent variable | Logistic function |
|---|---|
| Report type (RT) | \(\large{ P_{RT} = \frac{1}{1+e^{-(-0.43 + 0.78 \ \cdot \ Size - 1.21 \ \cdot Listing \ ))} } }\) |
| Adherence Level (AL) | \(\large{ P_{AL}=\frac{1}{1+e^{-(2.47 - 0.67 \ \cdot \ Organization\ type)}} }\) |
| OECD Guidelines (O) | \(\large{ P_O=\frac{1}{1+e^{-(-9.07 + 2.45 \ \cdot \ Country)}} }\) |
| UNGC (U) | \(\large{ P_U=\frac{1}{1+e^{-(-30.13 + 20.78 \ \cdot \ Size \ - \ 2.89 \cdot Listing)}} }\) |
| External verification (EV) | \(\large{ P_{EV}=\frac{1}{1+e^{-(1.83-0.68 \ \cdot \ Organization\ type \ - \ 1.58 \ \cdot \ Listing)}} }\) |
Source: Own elaboration.
These probabilities allow us to predict the probability that the dependent variable takes a certain value based on the value taken by the independent variables that the logistic function collects. If the probability is ≥ 0.5, the report will be classified in category 0 (according to the coding in Table 15); otherwise, it will be classified in category 1.
It is checked that the level of adherence of the sustainability report to the GRI standards is influenced by other companies’ characteristics but not the country of origin. This is because analyzed companies are not small and do not influence their countries of origin. Furthermore, adopting the OECD guidelines is not influenced by the size of the company since they are general guidelines that do not imply a high cost and, therefore, to which companies of the smaller size.
5. Conclusions
The objective of the work is to determine the influence that certain characteristics of the companies in the waste management sector, which report their sustainability information under the GRI guidelines, have on the level or type of disclosure of the reports. Specifically, they have been considered as independent variables: the country of location characterized by the cultural dimensions of Hofstede, the size of the company, the type of organization, and whether the company is listed on a stock exchange, and as dependent variables: the type of report, the level of adherence, the mention of the OECD and UNGC guidelines, the implementation of the ISO 26000 standard, the existence of an expert opinion and stakeholders and external verification.
The sustainability information of the GRI reports, corresponding to the waste management sector, for the period between 2014 and 2020, has been analyzed, collecting 99 reports from 45 companies that make up the entire population of companies of the European Union reported under the GRI standard for that sector and period.
The Chi-square test results reveal that all the indicators analyzed are influenced by some of the companies' characteristics. The only exception is the application of the ISO26000 standard and the existence of a panel of experts.
A significant relationship was found between the country (characterized according to Hofstede’s cultural dimensions, namely individualism and aversion to uncertainty) and the level of adherence to reporting and the reference to the OECD guidelines. Considering that the level of adherence indicates whether the company chooses more or less disclosure of its sustainability information (comprehensive or essential, respectively), this result would be consistent with studies that relate these cultural dimensions to more or less transparency in the disclosure of non-financial information (Gallén & de Grado, 2016; Gray, 1988; Mitchell Williams, 1999; Salter & Niswander, 1995; Zarzeski, 1996). However, no association has been found between the type of country and the external verification of sustainability reports, in opposition to the results of Somoza (2023). He concludes that there is a significant relationship in the assurance of sustainability reports derived from the characterization of the uncertainty aversion of the country where the company is located, according to the Hofstede dimensions. Our results may be because the characterization of the countries adopted in this study jointly includes the aversion to uncertainty and the individualism of the country.
Concerning company size, the study's results show its relationship with the type of report and the reference to the OECD guidelines and the UNGC. This result is consistent with Cowen et al. (1987) and Kiliç & Uyar (2014), who suggest a positive correlation between firm size and social disclosure, and in agreement with Góis et al. (2015) that determine the influence of the size of the company on the level of disclosure of sustainability information, based on a greater structuring and organization of these companies that attract better professionals, which results in a better quality of the information issued. Other possible reasons for this influence are found in the stakeholder theory (Chiu & Wang, 2015), the Agency theory and the tendency to avoid information asymmetry (Jensen & Meckling, 1976), in which resources are positively associated with the size of the company (Cantele & Zardini, 2020) or the best technological infrastructure available to this type of organization (de Oliveira et al., 2022).
The results also indicate that large companies are the ones that tend to issue GRI-G4 type reports, compared to SMEs, which have a greater tendency to issue reports under GRI standards. However, this may be because large companies considered were later adapted to the new type of report, in 2018, compared to the SMEs in the sample, which had already been adapted in 2017.
The type of organization shows a relationship between the level of adherence and the existence of external verification. Authors such as Singhvi & Desai (1971), Cooke (1989), Hossain et al. (1994, 1995) Robb et al. (2001), and Monteiro & Aibar-Guzmán (2010) find that the level of voluntary disclosure is affected by international listing. Ku Ismail & Ibrahim (2008) also find that companies with greater state participation tend to disclose less information.
The fact that the company is listed on a stock exchange influences the type of report, the mention of the UNGC, and the existence of external verification. In this regard, the study by Uyar et al. (2013) indicates that listing improves the level of voluntary disclosure. Also, Reverte (2009) finds a relationship between listing and CSR rating of companies, being higher in those listed on a greater number of foreign stock markets and (Schiehll & Kolahgar, 2021) refer to the sensitivity of share price information to some elements of CSR disclosure.
The analysis of the adjusted standardized residuals carried out reveals that: the companies that tend to prepare GRI-G4 type reports are the large companies and entities that are not listed; the countries that present a high level of individualism, according to the Hofstede dimensions, as well as the public organizations, more likely use an exhaustive level of adherence, compared to the essential; companies that tend to include the OECD guidelines in their reports are characterized by being SMEs and being established in countries with a low score for individualism and a high score for uncertainty avoidance; SMEs are also the most likely to mention UNGC in their reports, along with listed companies; private and listed companies tend to have their reports verified by an outside expert more often than public and unlisted companies.
Finally, a binary logistic regression has been carried out to define a model through which a dichotomous dependent variable (type of report, OECD guidelines, UNGC, and external verification) can be predicted based on a series of independent variables (size, country, type of organization, and price).
The results of the regression models support the results obtained previously through the Chi-square contrast and the analysis of the residuals. The only exception is the case of the variables' level of adherence, in which the country has been ignored in the model and guidelines of OECD where size is not significant in the model.
One of the conditioning factors of this study is that it is based on the data provided by the companies analyzed in the GRI database. This information is not available but could be completed with the qualitative analysis of the reports prepared by these companies. In addition, it would be helpful to consider other factors influencing the report's scope or providing nuances within the variables studied that may lead to different results.
As future lines of work, it is proposed to estimate a regression model that allows explaining each of the dependent variables from the independent variables of this study, in which a significant relationship has been observed. Also, it would be convenient to check whether the relationships found are exclusive to the waste management sector or whether the results can be extrapolated to other sectors. To do this, given that the GRI database is no longer available, in the future, it is possible to analyze companies that prepare their information on sustainability according to the SASB sectorial standards, all operating in the same infrastructure sector and, in turn, comparing the different types of industry within this sector: Electric Utilities & Power Generators; Engineering & Construction Services; real-estate; Water Utilities & Services; Gas Utilities & Services; Home Builders, and Waste Management.
At the time of writing this article, the new European Corporate Sustainability Reporting Directive (CSRD) is under development and expected to be adopted as of October 31, 2022. This Directive will change the scope of sustainability reporting, expanding the companies for which the issuance of these reports will be mandatory. For the first time, these organizations will have to report in January 2024 on their business activities' impact on social, environmental and governance issues. The new Directive, without a doubt, is going to suppose a substantial change in the way in which companies issue their reports, so a proposal for new work would be to review the results obtained once the requirements of the Directive are in force, in such a way that it can be verified to what extent the new requirements have affected the information published on sustainability.