Impression management in bankruptcy: An analysis of the narratives in listed companies
ABSTRACT
Managers tend to use opportunistically corporate narrative disclosure when financial performance is poor. However, there is little research on impression management in situations of extreme distress, such as bankruptcy. This paper analyzes ten textual characteristics of corporate reports at two moments in time, the last year just before entering the legal bankruptcy procedure (sick year) and five years earlier (healthy year). Specifically, it investigates the management reports of all bankrupt listed companies in Spain from 2005 to 2019. Our findings near bankruptcy only show behavior that may be compatible with impression management in relation to length and positive language. Litigation risk associated with bankruptcy may condition managers' attitudes to using narratives in a self-serving manner. Our results are also robust if we only test the most financially distressed bankrupt companies. This paper contributes to the understanding of impression management in companies in conditions of extreme financial distress.
Keywords: Bankruptcy; Business failure; Impression management; Litigation risk; Narratives.
JEL classification: G41; K41; L21; M21; M41.
Impression management en concurso de acreedores: Un análisis de la información narrativa en empresas cotizadas
RESUMEN
Los directivos suelen utilizar la información narrativa de forma oportunista cuando el desempeño empresarial es deficiente. Sin embargo, hay pocas investigaciones sobre estas prácticas de impression management en situaciones de extrema dificultad, como en concurso de acreedores. Este trabajo analiza diez características textuales de la información financiera en dos momentos de tiempo, el último año justo antes de entrar en concurso de acreedores (año enfermo) y cinco años antes (año sano). En concreto, se investigan los informes de gestión de todas las empresas cotizadas en concurso de acreedores en España desde 2005 hasta 2019. Los resultados, en el año antes de entrar en concurso, únicamente muestran un comportamiento que puede ser compatible con prácticas de impression management en el caso de la extensión del documento y del lenguaje positivo. El riesgo de litigio asociado al concurso de acreedores puede condicionar la actitud de los directivos a la hora de utilizar la información narrativa de forma sesgada. Los resultados también son robustos si sólo se analizan las empresas en concurso que se encuentran en una peor situación financiera. Este trabajo contribuye a la comprensión de las prácticas de impression management en condiciones de extrema dificultad financiera.
Palabras clave: Concurso de acreedores; Fracaso empresarial; Impression management; Riesgo de litigio; Información narrativa.
Códigos JEL: G41; K41; L21; M21; M41.
1. Introduction
Managers may manipulate qualitative information as well as quantitative information to try to dissimulate poor corporate performance. By adopting impression management practices, they may use opportunistically the narrative information contained in annual reports, especially when financial performance is poor (Merkl-Davies & Brennan, 2007; Neu, 1991). Managers may tend to communicate bad news in an unclear way to obscure the firm’s performance and highlight good news. Existing evidence has found differences in textual characteristics between good and bad performers (Cen & Cai, 2013; Clatworthy & Jones, 2006). However, most of the existing literature is based on ordinary conditions. To fill this gap, Merkl-Davies & Brennan (2007) called to explore impression management in situations of extreme distress. Extreme uncertainty may modify standard managerial behavior and induce companies to alter the quality and quantity of the narrative disclosure (Krause et al., 2017). Bankruptcy as legal procedure is one of the most extreme forms of financial distress (Hernandez Tinoco & Wilson, 2013).
The economic consequences of bankruptcy are enormous not only for managers, shareholders and workers, but also for society in general (Manzaneque et al., 2021; Priego-de-la-Cruz et al., 2020; Wu, 2010). If a risk information gap exists in financial disclosure, ‘stakeholders are unable to adequately assess the risk profile of a company’ (Linsley & Shrives, 2006, p. 387). Most existing accounting research on bankruptcy has focused on the use of quantitative information in financial statements (Altman, 1983; Altman et al., 2017; Beaver, 1966). However, the narrative information provided by companies can offer very useful context for users, helping them to understand the financial statements (Li, 2010b), and this is especially true in the case of financial distress. Indeed, this type of information is also used by financial analysts when making stock recommendations (Breton & Taffler, 2001).
The objective of this paper is to verify if managers increase impression management techniques shortly before bankruptcy. We compare disclosures (ten textual characteristics of the management reports1) at two different moments in time, one in the year prior to the bankruptcy declaration and the other five years earlier than that. We include in our analysis every listed company that filed for bankruptcy in Spain in any moment from 2005 to 2019. The choice of the document is justified because the MD&A is one of the largest single sources of information used by analysts (Rogers & Grant, 1997) and because of its forward-looking nature (Tailab & Burak, 2021). The MD&A ‘is an important part of the annual report that includes managerial commentary about a firm’s current state and future prospects. It provides managers with an opportunity to convey their future expectations and strategic plans directly to the public.’ (Muslu et al., 2014, p. 931). The timeline is chosen to identify two different situations. The report from the year before bankruptcy (t-1) is expected to present the most financially distressed (sick) situation, but it is still signed independently by the managers. The report from five years earlier (t-6) is expected to show a healthier situation. Korol (2013) suggests that the process of going bankrupt may even take up to 5 or 6 years. We also control using a group of non-bankrupt companies, matched by sector and size, in similar periods of time to interpret correctly the potential changes between the two situations.
According to impression management, a change in textual characteristics in the year prior to bankruptcy in relation to five years earlier would be expected, the aim being to hide or distance managers from the poor performance. However, the litigation risk associated with the situation of bankruptcy, i.e. risks associated to the judicial dispute of the bankruptcy, could reduce the use of impression management techniques. In this line, Aerts & Tarca (2010) find that an institutional setting with higher potential litigation risk promotes consistent language and restrains the extent of self-serving tendencies. Similarly, Aerts & Yan (2017) suggest that litigation risk could reduce self-serving behavior and rhetorical strategies. Litigation risk also could make firms write longer disclosures (Bloomfield, 2008), ensure more consistent reports or manage disclosure tone (Rogers et al., 2011).
Given that loss-making firms could be expected to have different narratives (Schleicher et al., 2007), this paper contributes by contextualizing impression management depending on a firm’s financial situation. First, it helps us understand impression management behavior in extreme financial situations such as bankruptcy, where explicit previous research is limited. Second, our sample is based on a code-law country, Spain, while most previous impression management research has focused on common-law countries. Thus, it responds to calls for greater evidence about the effects of different cultures on impression management (Guillamon-Saorin & Sousa, 2010; Li, 2010b; Merkl-Davies, 2007; Moreno & Jones, 2022). Third, unlike many existing cross-sectional studies, we focus on the same companies at different moments in time. It could avoid bias in narratives due to the different corporate characteristics of different companies (Cooper & Slack, 2015; Moreno & Jones, 2022).
The remainder of the paper is organized as follows. The next section briefly contextualizes research about narrative information and financially distressed companies. The research hypotheses are then presented in line with impression management. Following section describes the sample and its context and details the methods used to test our hypotheses. The results are presented later. Finally, the last section discusses and concludes the paper.
2. Background and hypotheses
2.1. Narratives and financially distressed firms
Bankruptcy is considered as the insolvency legal procedure and as an objective indicator of financial distress (Muñoz-Izquierdo et al., 2020). Qualitative information could be especially valuable in a bankruptcy context to help stakeholders to gauge the situation of the firm (Gandía & Huguet, 2021). However, financially distressed companies could have incentives to hide the reasons why they are not performing well (Singhvi & Desai, 1971). According to impression management and based on the obfuscation hypothesis, managers could try to obfuscate failures (Clatworthy & Jones, 2003; Courtis, 1998). Companies with an unfavorable performance may be more likely to distort their financial communication, supporting the agency perspective of asymmetric information and in line with Darrough & Stoughton's (1990) theory of selective disclosure in the context of financial distress.
Previous literature examining narrative information of corporate disclosures and bankruptcy has usually adopted a cross-sectional approach to discriminate between bankrupt (or financially distressed) and non-bankrupt (or healthy) firms at a single moment in time. They are focused on common-law countries, such as the USA (Cecchini et al., 2010; Gandhi et al., 2019; Holder-Webb & Cohen, 2007; Mai et al., 2019; Mayew et al., 2015; Tennyson et al., 1990; Yang et al., 2018), the UK (Elsayed & Elshandidy, 2020; Smith & Taffler, 1992, 2000) and New Zealand (Chang, 2014). Only a few analyze data out of common-law countries, such as Brazil, Japan and China (Pagliarussi & Scotá, 2009; Shirata et al., 2011; Tang et al., 2020). In general, they find that narrative information is useful to discriminate between bankrupt and non-bankrupt firms.
As exceptions to the previous approach, D'Aveni & MacMillan (1990) examine bankrupt and non-bankrupt firms over a five-year period and Boo & Simnett (2002) focus only on financially distressed firms (on a single period). Similar to D'Aveni & MacMillan's (1990) approach, our paper analyzes narratives in bankrupt listed companies at different moments in time. However, our approach is different. They focus on the attention paid to the environment and we analyze whether the bankruptcy situation influences the expected opportunistic use by managers of corporate narratives. In other words, whether bankruptcy influences impression management. Moreover, it is argued that corporate disclosure and its quality will vary between common-law and code-law countries (Doupnik & Salter, 1995). In contrast to most of the existing literature, this research is focused on a code-law country, Spain.
2.2. Impression management and hypotheses
Impression management stems from social psychology. Goffman (1959) developed this concept by using a drama to explore how people present an image of how they think their audience wishes to see them (Solomon et al., 2013). Impression management, in line with agency theory, tries to explain corporate narratives from an opportunistic perspective (Beattie & Jones, 2000; Merkl-Davies & Brennan, 2007). Therefore, this concept highlights the self-serving goals of managers and may result in stakeholders making poor decisions if these are based on a biased representation of performance (Patelli & Pedrini, 2014). Financial distress prior to bankruptcy may condition manager behavior under pressure, how earnings are manipulated (Campa & Camacho-Miñano, 2015) and the way that managers present company results (Yuthas et al., 2002). That extreme situation may influence management narrative disclosure to explain the firm’s performance.
The behavior of managers to mislead readers of disclosed information in the literature is linked to the obfuscation hypothesis. This hypothesis is related to the agency theory. This theory holds that managers ‘have economic incentives to disclose messages conveying good performance more clearly than those conveying poor performance’ (Rutherford, 2003, p. 189). According to the obfuscation hypothesis, developed by Courtis (1998), managers could use the corporate information in a self-serving way to obfuscate or blur bad news (El-Sayed et al., 2021; Hassan et al., 2019). Therefore, in order to mask bad news, bad performance will be disclosed less clearly than good performance (Courtis, 1998). Managers of companies with poor performance ‘will seek to communicate with greater obfuscation’ (Courtis, 1998, p. 462), by attempting to divert the attention of readers from the full impact of negative news, by making it harder for users to uncover negative information (Bloomfield, 2002).
Based on self-serving interests, managers could produce biased reporting (Brennan et al., 2009; Brühl & Kury, 2019). Impression management, in line with the obfuscation hypothesis, assumes a relationship between textual characteristics and profitability. In this line, existing research has found differences in textual characteristics between good and bad performers, in a self-serving manner, compatible with impression management (Cen & Cai, 2013; Clatworthy & Jones, 2006). This idea supports our main hypothesis which can be stated as follows:
H: The characteristics of the language disclosed in a firm's management report prior to entering into a bankruptcy procedure (sick year) will be different to those reported five years earlier (healthy year).
To operationalize this main hypothesis, we develop different sub-hypotheses related to different textual characteristics. The textual characteristics disclosed by a firm might vary with financial circumstances. In keeping with some previous research (Clatworthy & Jones, 2006; Moreno & Jones, 2022), we analyze multiple textual characteristics, i.e. a total of ten variables, which are often used as impression management strategies. All of these are presented following the impression management approach. The first variable analyzed is length. Impression management claims that poorly performing companies tend to produce longer documents. The argument is that publishing unclearer information using more words could mask bad news (Li, 2008; Rutherford, 2003). When reporting a weak performance, managers may write longer and more complex reports in an attempt to distract investors by discussing bad news interspersed with good news. Litigation risk could also encourage companies to write longer reports (Aerts & Yan, 2017; Bloomfield, 2008). Thus, in the event of bankruptcy, a longer document may not necessarily be an indicator of impression management but could instead be interpreted as an attempt to provide more information. In terms of the operationalization of the hypotheses, we will construct all of them in their general impression management form. Thus, the first hypothesis is as follows:
H1: The length of a firm's management report in the sick year will be greater than in the healthy year.
Graphs are tools used in annual reports to summarize data in a simpler way (Beattie & Jones, 2008). However, they can also be used to manipulate the perception of corporate information (Penrose, 2008). In line with impression management, most of the existing research has found that the use of key financial performance graphs is related to favorable performance (Arunachalam et al., 2002; Beattie & Jones, 1992, 2000; Cassar, 2001; Jones et al., 2020; Laidroo, 2019). Impression management would suggest that companies near to bankruptcy will be less willing to disclose tables and graphs in their management report than those in healthy periods. Thus, the hypothesis is stated as follows:
H2: The number of tables and graphs disclosed in a firm's management report will be lower in the sick year than in the healthy year.
The previous argument also applies to quantitative references. The argument is that profitable companies tend to disclose more quantitative statements than unprofitable ones (Cen & Cai, 2013; Clatworthy & Jones, 2006; Moreno & Jones, 2022). In financially distressed companies, with bad numbers, managers will try to avoid these and will focus more on qualitative statements. Thus, the next hypothesis is as follows:
H3: There will be fewer quantitative references disclosed in a firm's management report in the sick year than in the healthy year.
The dilution of responsibility could be used by organizations to deflect attention (Boiral, 2016). The use of personal pronouns links the verbs used with responsibility for the actions (Larcker & Tayan, 2010). They may also be indicative of the leadership and effectiveness of the managers (Scheuerlein & Chládková, 2022). Impression management suggests a positive relationship between company performance and the use of personal references in an attempt by managers to claim credit for achievements or distance themselves from bad results. Not all (Cen & Cai, 2014), but most of the existing literature has found this pattern (Clatworthy & Jones, 2006; Li, 2010a; Poole, 2016). In financially distressed circumstances, companies near bankruptcy could be expected to use fewer personal pronouns with the idea of not taking responsibility. Thus, the next hypothesis can be stated as follows:
H4: There will be fewer first person pronouns disclosed in a firm's management report in the sick year than in the healthy year.
The relationship between causation references and performance, as suggested by impression management, have been tested in the existing literature. Aerts & Cheng (2011) find self-serving presentational tendencies in causal disclosures. While there is no agreement about the expected sign of this relationship, both signs have been interpreted as impression management. On the one hand, managers near bankruptcy could be less prone to use cause-effect references in an attempt to avoid responsibility by not linking their actions to the poor position of the firm (Aerts, 1994; Hancock et al., 2007). On the other hand, managers near bankruptcy could increase the use of cause-effect references in an attempt to influence user perception for other reasons (Merkl-Davies et al., 2011; Zhang & Aerts, 2015). Consequently, a relationship but not a direction is presumed for the next hypothesis:
H5: There will be different causation references disclosed in a firm's management report in the sick year and in the healthy year.
Another textual characteristic tested in the existing literature is tentative references. Vague or uncertain disclosure could be used to distract attention from the real reasons for the poor performance (Moreno et al., 2019). Consequently, it could be argued that managers will use more tentative words near bankruptcy, when financial performance is weaker, as a way to avoid responsibility. In contrast, the use of certainty may attribute direct responsibility about the causes of bad performance. In general, deceivers are thought to add uncertainty to their writing (Chang, 2014). In this line, Cho et al. (2010) also find that poor environmental performers use fewer certainty references than good environmental performers. Hence, two hypotheses can be stated as follows:
H6: There will be more tentative references disclosed in a firm's management report in the sick year than in the healthy year.
H7: There will be fewer certainty references disclosed in a firm's management report in the sick year than in the healthy year.
In essence, the management report should be a forward-looking document. Thus, future references should frequently be used regardless of the firm’s performance. However, future references could be employed for impression management purposes. A focus on future opportunities may divert attention from current poor performance. Consequently, a decrease in profitability could result in an increase in future references (Cen & Cai, 2013; Kohut & Segars, 1992; Poole, 2016). It could therefore be argued that future references will be used more frequently near bankruptcy in an attempt to convince readers to trust in the future of the financially distressed firms. Thus:
H8: There will be more future references disclosed in a firm's management report in the sick year than in the healthy year.
The existing literature has found that corporate disclosure is overwhelmingly positive (Gibbins et al., 1990; Hadro et al., 2021; Hildebrandt & Snyder, 1981; Moreno, 2019). This consistent pattern could result in the tone of management reports losing any potential significance. If companies use impression management to enhance positive performance, one would not expect to see significant differences in the use of positive references between good performing companies and financially distressed companies (Merkl-Davies et al., 2011). Or even worse, managers could increase positive language in the case of bad performance (Caserio et al., 2019). According to impression management, it can be argued that companies near bankruptcy will show similar or more positive references than they do when their financial situation is better. This would mean that managers are using narratives as an attempt to camouflage and deny the real situation of financial distress. In relation to negative references, managers near bankruptcy could avoid focusing on pessimistic language. In a financially distressed situation, under ethical managerial behavior, the language of management reports should be more pessimistic but, according to impression management, managers could try to hide bad news. In this vein, it may be argued that companies near bankruptcy could have similar or fewer negative references than they previously did. Consequently, two hypotheses are stated:
H9: There will be similar or more positive references disclosed in a firm's management report in the sick year than in the healthy year.
H10: There will be similar or fewer negative references disclosed in a firm's management report in the sick year than in the healthy year.
3. Methodology
3.1. Sources and sample
Bartlett & Chandler (1997) argue that narrative sections attract wider readership than pure financial data because shareholders may be interested in obtaining an overview of the company and its performance (Moreno & Casasola, 2016). The narrative information in the documents accompanying the financial data has been widely analyzed, for example the president’s letter/chairman’s statement (Courtis, 1998; Smith & Taffler, 2000) and the MD&A/OFR (Yang et al., 2018). In Spain, only large companies usually publish a president’s letter. However, every listed company must disclose a narrative-content document called ‘Informe de gestión’, i.e. management report (to some extent similar to the MD&A; Melón-Izco et al., 2021), together with the financial statements (Law 24/1988).2 This is the source for the present research.
By searching the website of the regulatory body for the Spanish Stock Market (Comisión Nacional del Mercado de Valores –CNMV–; http://www.cnmv.es), we found 457 significant events related to the bankruptcy of listed companies from 1 January 2005 to 31 December 2019. All of these related to 36 individual companies. We checked, one by one, the information on every firm in the official website for bankruptcy information in Spain (Registro Público Concursal; http://www.publicidadconcursal.es), and noted the date they entered the bankruptcy procedure. A total of 13 firms were excluded from the analysis for three reasons. First, they were essentially non-listed subsidiaries of listed firms (the CNMV website includes information about the bankruptcy of non-listed subsidiary firms which belong to a listed company). Second, no information about the bankruptcy situation was available on the bankruptcy information website. Third, the annual report (which contains the management report) for the healthy year (t-6) was not available in any of the sources examined. The annual reports were extracted from the corporate web pages, the CNMV website and the SABI database. This latter is provided by Bureau Van Dijk and includes comprehensive information on more than 1,250,000 companies operating in Spain (http://www.sabi.es). Table 1 shows the 23 bankrupt companies under analysis.
Table 1. Bankrupt listed companies (and non-bankrupt control group) and reports selected
| Bankrupt companies | Bankruptcy date | Sick year | Healthy year | Comments | Matched (non-bankrupt) companies |
|---|---|---|---|---|---|
| Adveo Group International | Dec 2018 | 2017 | 2012 | Iberpapel Gestión | |
| Amci Habitat | Dec 2011 | 2010 | 2005 | Urbas | |
| Amper | Dec 2014 | 2013 | 2008 | Grupo Ezentis | |
| CLEOP | Jul 2012 | 2011 | 2006 | Sacyr | |
| Codere | Jan 2014 | 2012 | 2007 | 2013 drawn up after bankruptcy | NH Hoteles |
| Dogi International Fabrics | Jun 2009 | 2008 | 2003 | Industrias Acetato Celulosa | |
| Española del Zinc | Feb 2005 | 2003 | 1998 | 2004 drawn up after bankruptcy | Repsol |
| Fergo Aisa | Jul 2013 | 2010 | 2005 | 2012 & 2011 not drawn up | ACS |
| Hullera Vasco-Leonesa | May 2015 | 2014 | 2009 | Minerales y Ptos. Derivados | |
| Indo Internacional | Jul 2010 | 2009 | 2004 | CIE Automotive | |
| Inmofiban | Jun 2014 | 2012 | 2007 | 2013 not drawn up | Montebalito |
| Lefa | Oct 2007 | 2006 | 2001 | Viscofan | |
| Martinsa-Fadesa | Jul 2008 | 2007 | 2002 | Obrascón Huarte Lain | |
| Nyesa Valores Corporación | Mar 2012 | 2010 | 2005 | 2011 drawn up after bankruptcy | Sotogrande |
| Pescanova | Apr 2013 | 2010 | 2005 | 2012 & 2011 drawn up after bankruptcy | Sos Corporación Alimentaria |
| Renta Corporación R. Estate | Mar 2013 | 2011 | 2006 | 2012 drawn up after bankruptcy | Inverfiatc |
| Reyal Urbis | Mar 2013 | 2011 | 2006 | 2012 drawn up after bankruptcy | Alza Real Estate |
| La Seda de Barcelona | Jul 2013 | 2012 | 2007 | Liwe Española | |
| Service Point Solutions | Feb 2014 | 2012 | 2007 | 2013 drawn up after bankruptcy | Ronsa |
| Sniace | Oct 2013 | 2012 | 2007 | Fersa Energías Fenovables | |
| Urbar Ingenieros | Jul 2019 | 2018 | 2013 | Azkoyen | |
| Vértice 360 Grados | Jun 2014 | 2012 | 2007 | 2013 drawn up after bankruptcy | Dinamia |
| Zinkia Entertainment | Apr 2014 | 2012 | 2007 | 2013 drawn up after bankruptcy | Funespaña |
Source: Own elaboration from www.cnmv.es, www.publicidadconcursal.es and SABI. For more information about comments, see endnote 2.
Later, the sample of bankrupt listed companies was matched with another 23 non-bankrupt listed companies on the basis of industry and size. These two factors were selected following prior literature on business failure (Knechel & Vanstraelen, 2007; Muñoz-Izquierdo et al., 2020; Schwartz & Menon, 1985). These data were extracted from SABI. The matched non-bankrupt listed companies are also shown in Table 1. Given our objective, for each company we selected the last management report drawn up just before entering the legal bankruptcy procedure (t-1; sick year)3 and the management report drawn up five years earlier (t-6; healthy year). These two years were chosen to represent the greatest potential difference, given the financial health/distress situations, in the quantitative information of the financial statements. More specifically, we calculated Altman’s Z-score for every bankrupt firm in the sample. Figure 1 shows the Altman’s Z-score average for every year in the period between t-6 and t-1. Altman’s Z-score is a well-known indicator of a firm’s level of financial distress. It uses the quantitative information in financial statements and has become a prototype for many bankruptcy prediction models (Altman et al., 2017).4
Figure 1. Evolution of goodwill from 2012 to 2019, in absolute and relative terms
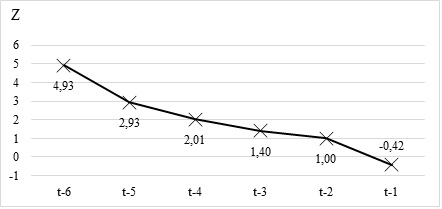
t-1 (sick year) is the year before entering the legal bankruptcy procedure; t-6 is considered the healthy year
3.2. Method and statistical analysis
After extracting the pdf version of the management reports, we copied and pasted the text into a plain text file. The output of this process was later manually checked to ensure consistency. The txt files were used to analyze different textual characteristics using the LIWC software.
This text analysis software has previously been used in financial reporting impression management research (Li, 2010a; Merkl-Davies et al., 2011; Moreno & Jones, 2022; Scheuerlein & Chládková, 2022; Zhang & Aerts, 2015). It is designed to calculate different linguistic dimensions in a text (Pennebaker et al., 2001) by counting the percentage of words that reflect different emotions, thinking styles or social concerns. It has several dictionaries, including English and Spanish (which constitutes one of the main advantages of this software, compared to others which are only focused on English). The LIWC 2001 Spanish dictionary is composed of almost 7,500 words and word stems (in contrast to 2,300 words in the LIWC 2001 English dictionary). Each word or word stem forms part of one or more word categories. The LIWC dimensions have been externally validated (Donohue et al., 2013). More information is available at http://www.liwc.net.5
We analyze the different textual characteristics using the LIWC software, with the exception of the number of tables and graphs (T&GR), which was manually calculated. The number of words (offered by LIWC) was used to record length (LENG) (Li, 2008; Rutherford, 2003). The pre-defined LIWC categories were used for the rest of the variables. They are reported in percentages over the total words. In terms of quantitative references (QUAN), both numerals and numbers as words (equivalent in Spanish to first, hundred, etc.; 63 words and word stems) were included. In relation to first person pronouns (FIPP), both singular (I, mine, etc.; 15 words) and plural (we, our, etc.; 10 words and word stems) were included. For causation references (CAUS), the words related to cause-effect relationships (because, hence, etc.; 135 words or word stems) were included. Two additional cognitive processes were considered, tentative (TENT) ones (maybe, depend, etc.; 162 words or word stems) and certainty (CERT) ones (always, never, etc.; 44 words and word stems). In relation to references to the future (FUTU), mainly verbs in the future tense (875 words and word stems) were included. Finally, for positive references (POSI), the words related to positive emotions (award, enjoy, etc.; 642 words or word stems) were included and for the negative references (NEGA), the words related to negative emotions (danger, fail, etc.; 745 words or word stems) were included.
To evaluate the sub-hypotheses, i.e. to test potential differences in the ten textual characteristics between the two moments in time, non-parametric statistical tests were run (as the variables failed to adhere the requirements of normality and homoscedasticity). In particular, as our database consists of the observation of the same variables in two moments in time, they are considered two matched samples and, therefore, Wilcoxon signed ranks tests were run.
4. Results
4.1. Main analysis
In line with impression management, the corporate narrative information provided to users may be selected to distort the readers’ perceptions (García Osma & Guillamón-Saorín, 2011; Neu, 1991). In a situation of financial distress, managers could produce biased reporting in relation to periods of good financial health. Table 2 shows the distribution statistics of the variables and Table 3 shows the differences between the sick-year and healthy-year reports for bankrupt companies.
Table 2. Summary of distribution statistics (bankrupt companies)
| Variables | Whole sample(N=46) | Healthy year (N=23) | Sick year (N=23) | |||||||||
|---|---|---|---|---|---|---|---|---|---|---|---|---|
| Mean | St.Dev. | Mean | St.Dev. | Median | Min. | Max. | Mean | St.Dev. | Median | Min. | Max. | |
| LENG | 1862.02 | 1641.53 | 1427.52 | 1270.71 | 903.00 | 175.00 | 4402.00 | 2296.52 | 1871.45 | 1268.00 | 544.00 | 6784.00 |
| T&GR | 1.91 | 3.33 | 1.83 | 3.50 | 0.00 | 0.00 | 13.00 | 2.00 | 3.23 | 0.00 | 0.00 | 11.00 |
| QUAN | 5.01 | 1.61 | 5.00 | 1.57 | 5.14 | 2.24 | 8.26 | 5.03 | 1.69 | 4.63 | 2.60 | 10.66 |
| FIPP | 0.18 | 0.33 | 0.26 | 0.44 | 0.04 | 0.00 | 1.78 | 0.10 | 0.16 | 0.00 | 0.00 | 0.48 |
| CAUS | 0.82 | 0.35 | 0.81 | 0.45 | 0.84 | 0.00 | 2.05 | 0.84 | 0.21 | 0.80 | 0.43 | 1.29 |
| TENT | 0.55 | 0.34 | 0.56 | 0.40 | 0.48 | 0.00 | 1.61 | 0.56 | 0.28 | 0.55 | 0.00 | 1.15 |
| CERT | 0.48 | 0.32 | 0.48 | 0.41 | 0.44 | 0.00 | 1.69 | 0.48 | 0.20 | 0.47 | 0.12 | 0.91 |
| FUTU | 0.14 | 0.12 | 0.15 | 0.13 | 0.16 | 0.00 | 0.46 | 0.13 | 0.11 | 0.10 | 0.00 | 0.38 |
| POSI | 2.50 | 0.81 | 2.51 | 0.98 | 2.63 | 0.58 | 4.67 | 2.49 | 0.63 | 2.67 | 1.18 | 3.60 |
| NEGA | 0.37 | 0.30 | 0.30 | 0.32 | 0.22 | 0.00 | 1.24 | 0.44 | 0.27 | 0.37 | 0.10 | 1.19 |
Table 3. Statistical differences between the healthy and sick years (bankrupt companies)
| ** LENG | T&GR | QUAN | FIPP | CAUS | TENT | CERT | FUTU | POSI | * NEGA | |
|---|---|---|---|---|---|---|---|---|---|---|
| Z | -2.677 | -0.460 | -0.213 | -1.726 | -0.715 | -0.015 | -0.065 | -0.585 | -0.304 | -2.374 |
| Asymp. sig. (2-tailed) | 0.007 | 0.645 | 0.831 | 0.084 | 0.475 | 0.988 | 0.948 | 0.558 | 0.761 | 0.018 |
N=46; *,** denote significant differences at the level of 5% and 1%, respectively, between the two years according to Wilcoxon signed ranks tests.
To evaluate our main hypothesis, the results of the different sub-hypotheses are described. Length is significantly (at 1%) higher in the sick year than in the healthy year. This finding is in line with Li (2008), who finds a negative relationship between length and profitability. This fact could be in keeping with impression management. Financially distressed firms could try to hide their poor performance by using lots of words (Singhvi & Desai, 1971). However, there may also be a greater requirement for information in times of financial distress due to the greater need to explain the reasons for that performance (Coats & Fant, 1993). In any case, firms near bankruptcy use more words in the management reports than they do in healthy periods. Consequently, H1 is supported.
The number of tables and graphs disclosed in the management reports was expected to be lower close to bankruptcy than in a healthy year. However, we found no significant differences in the number of tables and graphs (slightly higher in the sick year) between the two periods. This is in contrast to Beattie & Jones (2000), who find that graphs are used to manage performance favorably. Consequently, H2 is not supported.
Under the same argument, it was hypothesized that there would be fewer quantitative references close to bankruptcy than in a healthy year. However, we found that the quantitative references show no significant differences between the two years. It means that in the two years, sick and healthy, managers use the same number of quantitative references in their reports and therefore they do not use these references in a self-serving way. Thus, H3 is not supported.
It was argued that companies near bankruptcy could use fewer personal pronouns with the idea of managers evading responsibility. The results show that the use of first-person pronouns is marginally higher, although not significantly so, in the healthy year than in the sick year. This finding is in the same direction as the existing literature that suggests that opportunistic managers use fewer self-references with the idea of trying to avoid linking their management to the bankruptcy situation (Chang, 2014; Larcker & Tayan, 2010). However, the differences are not significant and, consequently, H4 is not supported.
In line with impression management, causation references could be different in a year close to bankruptcy and in a healthy year. However, although they are slightly higher in the sick year, we have not found significant differences between the two periods. Managers have not used causation references to influence stakeholders. Consequently, H5 is not supported.
Tentative references were expected to be greater in the sick year than in the healthy year to try to hide the real reasons for the poor performance. However, the results do not show significant differences between the two years. Managers have not used tentative references to distort user perceptions. Thus, H6 is not supported. The certainty references were expected to be fewer in the sick year in an attempt to create uncertainty about the reasons for the poor performance. The results show that certainty references do not differ significantly between the two periods. Managers did not use biased certainty language and therefore H7 is not supported.
In the case of future references, although a greater focus on future opportunities was expected in the sick year (Cen & Cai, 2013; Poole, 2016), we found no significant differences between the two years. Perhaps the pressure of extreme financial distress and potential bankruptcy could make misstatements about the future more evident. Thus, H8 is not supported.
In terms of the use of positive references, there are no significant differences between the sick and healthy years. In healthy periods, managers might be expected to emphasize the positive references, but this conduct may not be honest during financially distressed periods. Such behavior provides no effective warning signals to the stakeholders of financially distressed firms (Deumes, 2008). This situation could be also linked to the generally optimistic tone of corporate publications. In any case, it can be considered as a sign of impression management. Thus, our results are in line with H9. In contrast, negative references are significantly higher (at 5%) in the sick year compared to the healthy year. This finding runs contrary to that suggested by impression management. Near bankruptcy, managers increased negative references compared to the healthy period. Tennyson et al. (1990) also find a higher frequency of negative words in narrative disclosures approaching bankruptcy. H10 is not supported. Taking tone as a whole, the net positive tone is still present in the sick year. In the healthy year the positive references were more than 8 times greater than the negative references and in the sick year the positive references were still almost 6 times greater than the negative references.
To contextualize the results, the same analysis was performed for a control group of non-bankrupt companies.Table 4 shows a summary of the statistics for this control group. Table 5 shows the analysis for this control group between the equivalent of the healthy and sick years. The results show no significant differences between the two years in any of the dimensions analyzed. As a result, the significant differences found in the two dimensions in bankrupt companies cannot be interpreted as just standard differences or due to the regular development of disclosure, but instead are probably differences caused by the bankruptcy situation.
Table 4. Summary of distribution statistics (non-bankrupt control group)
| Variables | Whole sample(N=46) | Equivalent to healthy year (N=23) | Equivalent to sick year (N=23) | |||||||||
|---|---|---|---|---|---|---|---|---|---|---|---|---|
| Mean | St.Dev. | Mean | St.Dev. | Median | Min. | Max. | Mean | St.Dev. | Median | Min. | Max. | |
| LENG | 2185.15 | 1808.96 | 1880.65 | 1397.23 | 1360.00 | 144.00 | 5449.00 | 2489.65 | 2132.45 | 1885.00 | 183.00 | 7946.00 |
| T&GR | 2.35 | 3.30 | 2.09 | 3.09 | 1.00 | 0.00 | 13.00 | 2.61 | 3.55 | 1.00 | 0.00 | 12.00 |
| QUAN | 5.33 | 2.25 | 5.24 | 2.42 | 5.38 | 1.28 | 10.74 | 5.42 | 2.11 | 5.59 | 1.82 | 9.84 |
| FIPP | 0.17 | 0.38 | 0.25 | 0.52 | 0.03 | 0.00 | 2.36 | 0.08 | 0.11 | 0.05 | 0.00 | 0.38 |
| CAUS | 0.79 | 0.37 | 0.82 | 0.37 | 0.81 | 0.00 | 1.64 | 0.75 | 0.37 | 0.71 | 0.00 | 1.35 |
| TENT | 0.59 | 0.31 | 0.62 | 0.31 | 0.60 | 0.00 | 1.37 | 0.56 | 0.31 | 0.55 | 0.00 | 1.09 |
| CERT | 0.44 | 0.26 | 0.48 | 0.32 | 0.40 | 0.00 | 1.17 | 0.40 | 0.19 | 0.38 | 0.00 | 0.86 |
| FUTU | 0.20 | 0.18 | 0.21 | 0.19 | 0.17 | 0.00 | 0.74 | 0.18 | 0.16 | 0.15 | 0.00 | 0.57 |
| POSI | 2.55 | 0.90 | 2.56 | 0.99 | 2.39 | 1.08 | 4.20 | 2.54 | 0.81 | 2.44 | 1.47 | 4.14 |
| NEGA | 0.38 | 0.26 | 0.33 | 0.22 | 0.28 | 0.00 | 0.96 | 0.43 | 0.30 | 0.36 | 0.00 | 1.07 |
Table 5. Statistical differences between the equivalent to healthy and sick years (non-bankrupt control group)
| LENG | T&GR | QUAN | FIPP | CAUS | TENT | CERT | FUTU | POSI | NEGA | |
|---|---|---|---|---|---|---|---|---|---|---|
| Z | -1.825 | -0.672 | -0.365 | -1.351 | -1.055 | -0.522 | -1.315 | -0.211 | -0.350 | -0.974 |
| Asymp. sig. (2-tailed) | 0.068 | 0.502 | 0.715 | 0.177 | 0.291 | 0.602 | 0.188 | 0.833 | 0.726 | 0.330 |
N=46; *,** denote significant differences at the level of 5% and 1%, respectively, between the two years according to Wilcoxon signed ranks tests.
To sum up, the only significant differences found between the sick and healthy years in bankrupt companies are length and negative references, both of these being higher in the sick year. Of these two variables, only length could be interpreted as impression management, although it is also possible that this finding is due to an attempt to provide more information. Additionally, the absence of differences in the number of positive references could also be interpreted as impression management. Overall, as only two out of the ten variables are in line with the hypotheses (H1 and H9), we cannot accept the general hypothesis (H) that the characteristics of the language disclosed in a firm’s management report prior to entering a bankruptcy procedure are different to those reported five years earlier. This means that in bankruptcy situations, we have found limited signs of impression management in the variables analyzed. This finding is in contrast to the existing literature that has found extensive evidence of impression management in ordinary poorly performing companies.
4.2. Supplementary analysis: positive/negative growth bankrupt companies
Growth can play an important role in a company’s ability to manage earnings (Charitou et al., 2011). Firm growth has gained increasing attention in the context of distressed companies (Lukason et al., 2015). Firms may experience different growth patterns before failure (Argenti, 1976; Ooghe & de Prijcker, 2008). Laitinen (1991) found that growth was a significant driver in different failure processes. ‘(Pre-failure) growth patterns of failing firms can vary, and established bankruptcy prediction models might nor perform equally well in the presence of different patterns’ (Lukason et al., 2015, p. 65). We extend this literature by testing whether failing firms with different growth patterns have a different pattern of narratives.
The most common indicator of firm growth is sales revenue in relative terms (Delmar, 2006). We therefore measure firm growth for bankrupt companies as the change in sales revenue between the sick year (t-1) and the previous year (t-2). Twelve companies show positive growth, and eleven companies show negative growth. Table 6 shows some descriptives and the statistical differences between positive and negative growth bankrupt companies.
Table 6. Descriptives and statistical differences between positive and negative growth bankrupt companies (sick year)
| LENG | T&GR | QUAN | FIPP | CAUS | ** TENT | CERT | FUTU | POSI | NEGA | |
|---|---|---|---|---|---|---|---|---|---|---|
| Posit. growth (mean) | 2474.58 | 1.75 | 4.75 | 0.07 | 0.83 | 0.39 | 0.45 | 0.16 | 2.61 | 0.39 |
| Negat. growth (mean) | 2102.27 | 2.27 | 5.33 | 0.13 | 0.86 | 0.73 | 0.52 | 0.09 | 2.35 | 0.49 |
| Posit. growth (median) | 1993.00 | 1.00 | 4.52 | 0.00 | 0.76 | 0.42 | 0.43 | 0.18 | 2.71 | 0.32 |
| Negat. growth (median) | 1196.00 | 0.00 | 4.85 | 0.00 | 0.81 | 0.69 | 0.54 | 0.08 | 2.42 | 0.39 |
| Z | -0.308 | -0.533 | -0.031 | -0.175 | -0.431 | -3.079 | -1.017 | -1.587 | -.800 | -1.047 |
| Asymp. sig. (2-tailed) | 0.758 | 0.594 | 0.975 | 0.861 | 0.666 | 0.002 | 0.309 | 0.112 | 0.423 | 0.295 |
| Exac sig. [2*(1-t sig.)]† | 0.786 | 0.651 | 0.976 | 0.880 | 0.695 | 0.001 | 0.316 | 0.118 | 0.449 | 0.316 |
N=23; *,** denote significant differences at the level of 5% and 1%, respectively, between the two groups according to Mann-Whitney tests
† Not corrected for ties.
Only one significant difference is found in the textual characteristics analyzed. Negative growth bankrupt companies use more tentative references than positive growth bankrupt companies, maybe as an attempt to divert attention not only from their poor performance but, particularly, from their negative growth as well.
4.3. Robustness analysis: the most financially distressed bankrupt companies
To validate the robustness of our results, we have performed two additional tests. Based on the argument that ‘the more firm performance differs from a desired benchmark, the more management is motivated to manage impressions, and the more likely it is that narrative disclosure will be affected by a self-serving bias’ (Cho et al., 2010, p. 432). We have identified, within the group of bankrupt listed companies, those that are most financially distressed. For that purpose, we have used Altman’s Z-score for every bankrupt firm in the sample in the two different years, healthy (t-6) and sick (t-1). In the first analysis, we have selected the firms with the lowest Z-scores in the sick year. As the selection criterion, we have only included companies with a Z-score below the mean (-0.42). Ten companies were selected (Z-score mean: -3.51). These companies can be considered as the most financially distressed and, therefore, the companies for which bankruptcy was presumably closer. Table 7 shows some descriptives and the statistical differences between the healthy and sick years in the most financially distressed companies. In the second analysis, we have selected the firms with the highest difference in Z-score between the healthy and sick years. As the selection criterion, we have included companies with a Z-score difference above the mean (-5.35). Eight companies were selected (Z-score difference mean: -13.15). These companies can be considered as those with the greatest deterioration in their financial situation between the healthy and the sick years. Table 8 shows some descriptives and the statistical differences between the healthy and sick years for the companies with the most severe deterioration in their financial situation.
Table 7. Descriptives and statistical differences between healthy and sick years (most financially distressed bankrupt companies)
| ** LENG | T&GR | QUAN | FIPP | CAUS | TENT | CERT | FUTU | POSI | NEGA | |
|---|---|---|---|---|---|---|---|---|---|---|
| Healthy year (mean) | 1681.80 | 2.20 | 4.92 | 0.19 | 0.94 | 0.49 | 0.51 | 0.14 | 2.36 | 0.34 |
| Sick year (mean) | 2812.70 | 2.40 | 4.75 | 0.08 | 0.80 | 0.61 | 0.54 | 0.14 | 2.50 | 0.52 |
| Posit. growth (median) | 1399.50 | 0.50 | 5.07 | 0.10 | 0.82 | 0.47 | 0.55 | 0.17 | 2.70 | 0.14 |
| Negat. growth (median) | 2426.00 | 0.00 | 4.12 | 0.00 | 0.78 | 0.58 | 0.52 | 0.12 | 2.60 | 0.51 |
| Z | -2.701 | -0.368 | -0.153 | -1.183 | -0.255 | -0.866 | -0.459 | 0.000 | -0.663 | -1.580 |
| Asymp. sig. (2-tailed) | 0.007 | 0.713 | 0.878 | 0.237 | 0.799 | 0.386 | 0.646 | 1.000 | 0.507 | 0.114 |
N=20; *,** denote significant differences at the level of 5% and 1%, respectively, between the two years according to Wilcoxon signed ranks tests.
Table 8. Descriptives and statistical differences between healthy and sick years (bankrupt companies with the most severe deterioration)
| LENG | T&GR | QUAN | FIPP | CAUS | TENT | CERT | FUTU | POSI | * NEGA | |
|---|---|---|---|---|---|---|---|---|---|---|
| Healthy year (mean) | 1692.25 | 2.00 | 4.95 | 0.18 | 0.79 | 0.47 | 0.54 | 0.13 | 2.33 | 0.19 |
| Sick year (mean) | 2637.25 | 2.63 | 4.71 | 0.10 | 0.87 | 0.56 | 0.51 | 0.15 | 2.34 | 0.40 |
| Posit. growth (median) | 1399.50 | 0.50 | 5.26 | 0.10 | 0.69 | 0.47 | 0.56 | 0.09 | 2.46 | 0.13 |
| Negat. growth (median) | 2216.50 | 0.50 | 4.27 | 0.00 | 0.78 | 0.52 | 0.49 | 0.16 | 2.60 | 0.31 |
| Z | -1.820 | -0.447 | -0.560 | -0.674 | -0.700 | -0.560 | -0.560 | -0.524 | -0.140 | -2.383 |
| Asymp. sig. (2-tailed) | 0.069 | 0.655 | 0.575 | 0.500 | 0.484 | 0.575 | 0.575 | 0.600 | 0.889 | 0.017 |
N=16; *,** denote significant differences at the level of 5% and 1%, respectively, between the two years according to Wilcoxon signed ranks tests.
Both results (Table 7 and Table 8) are consistent with our previous findings. The most financially distressed companies (Table 7) only show significant differences between the sick and healthy years in length, which is higher in the sick year. In keeping with the main analysis, this finding may be interpreted as impression management, although it is also possible that this behavior is due to an attempt to provide more information. The companies with the most severe deterioration (Table 8) only show significant differences between the sick and healthy years in negative references, which are higher in the sick year. In line with the main analysis, this behavior is not representative of impression management. However, and again in keeping with the main analysis, the fact that we did not find significant differences in the positive references, in both additional analyses (Table 7 and Table 8), could be interpreted as an indication of impression management. Moreover, as in the main analysis, there are directional changes in some other variables in line with impression management, but not statistically significant.
5. Conclusions and discussion
This paper extends the existing impression management research by analyzing narratives in bankruptcy. We compare ten textual characteristics of the management reports of bankrupt listed companies at two moments in time, the year just before entering the legal bankruptcy procedure (sick year) and five years earlier (healthy year). We have also examined a control group of non-bankrupt listed companies. In contrast to what was expected, companies did not use textual characteristics as impression management techniques. The litigation risk associated to the institutional setting of bankruptcy could be one driver explaining our results. Our findings help to understand impression management behavior in companies in extreme distress conditions.
Our results show that the management reports of bankrupt companies only contain significant differences in length and negative words. The difference in length might be interpreted as being in line with impression management. However, litigation concerns could also make managers write longer disclosures to protect themselves (Bloomfield, 2008). In relation to tone, although the change in negative content is not in line with impression management, the absence of significant differences in positive references could be inferred as impression management. The rest of the textual characteristics analyzed behave quite similarly. Although there are some directional changes in line with impression management, these are not significant. Overall, our findings provide limited signs of impression management near the bankruptcy situation. Our results are robust if we only test the most financially distressed bankrupt companies. However, the supplementary analysis of differences between positive and negative growth bankrupt companies found an additional significant result. Negative growth firms use more tentative references than positive growth firms.
Altogether, our results show a lesser use of textual characteristics for impression management purposes than most previous research has found in ordinary circumstances (Cen & Cai, 2013; Clatworthy & Jones, 2006). It is possible that managers exhibit different behaviors in surviving companies in ordinary conditions (i.e. firms with temporary financial distress) and in failing firms (i.e. bankruptcy firms). This is in line with previous research which found that specific settings could influence impression management incentives (Rahman, 2012). There are possible reasons to explain our finding. The situation of bankruptcy provides an institutional setting with a high potential litigation risk. This litigation risk associated with the potential legal procedure of bankruptcy is probably one driver of our results. In this situation, managers maybe prefer not to alter textual characteristics to obscure the poor financial position to avoid possible future liability arising from the bankruptcy laws. It would add pressure if they knew that in a short period of time their companies could be declared bankruptcy. This would result in the company being under strict scrutiny by legal supervisors and their previous actions might be examined in depth.6 Behavioral accountability research shows that actors moderate their self-enhancement behavior when they expect to face a judgmental evaluator post hoc (Sedikides et al., 2002). Thus, companies exposed to higher litigation risk may have higher conservatism in corporate reporting (Hesarzadeh, 2022; Nelson & Pritchard, 2016), including narrative reporting. Litigation risk ‘tends to constrain self-promotional behavior and overt acclaiming rhetorical strategies, while encouraging more defensive rhetorical postures’ (Aerts & Yan, 2017, p. 411). Francis et al. (1994) suggest that prior disclosure may reduce the severity of litigation. Aerts & Tarca (2010) also argue that higher scrutiny pressures coming from higher expected regulatory and litigation costs bring about a disclosure environment in which self-presentational tendencies are reduced. In essence, the litigation risk associated with bankruptcy may condition managers’ behavior under pressure (Campa & Camacho-Miñano, 2015) and may affect the way that narratives are disclosed. Bankrupt firms could therefore have different expected narratives (Schleicher et al., 2007).
Credibility issues may also become prominent when institutional scrutiny forces are strong (Aerts & Yan, 2017). ‘Discretionary disclosures are only effective in managing impressions by altering user perceptions if they are perceived to be credible’ (Merkl-Davies & Brennan, 2007, p. 162). The short distance to bankruptcy, due to the extreme financial distress, could mean that attempts at distortion quickly become obvious.
This paper has focused on the impact of impression management on selectivity in the presentation of information. However, other types of impression management are also possible. Leung et al. (2015) find selectivity by omitting narrative disclosures as a concealment strategy and interpret this as impression management. They find that firms with a higher bankruptcy risk tend to obfuscate stakeholders by withholding information from annual reports. An attempt to reconcile both results may be that bankrupt companies prefer to omit information rather than use textual characteristics for impression management. It may provide managers with greater protection against future potential liability in the bankruptcy procedure.
A supplementary reason relates to the specific setting of our study. Although the way managers communicate could be related to discourse ethics (Yuthas et al., 2002), the lack of impression management techniques in textual characteristics found is probably not explained by Spanish managers having a greater ethical commitment. In fact, the existing literature has found impression management in Spanish corporate documents (Guillamon-Saorin et al., 2012; Guillamón-Saorín & Martínez-López, 2013). However, it is well known that disclosure is expected to vary between countries, legal systems and other factors (Doupnik & Riccio, 2006; Melis & Aresu, 2022). Most of the existing research on impression management has been developed in Anglophone countries. These have different transparency/secrecy levels (Gray, 1988) and legal systems (La Porta et al., 2008). The main Anglophone countries also have stronger capital markets. These factors could provide more incentives to adopt impression management practices in these countries compared to other countries such as Spain. Although this is an under-researched area, there is some evidence that impression management could be greater in countries with stronger capital markets, such as the USA, the UK or Australia (Beattie & Jones, 2000; Melis & Aresu, 2022).7 Our findings could also be related to the size of the bankrupt firms analyzed. They are all listed companies but none of them is a very large company (for instance, none of them is listed on the IBEX 35, the main Spanish stock market index). Larger firms could have different perceived target audiences and as a result, could cater for them differently, responding to the preferred reading strategies of highly-knowledgeable readers, i.e. professional investors, funds, press, etc. (Aresu, 2015; Merkl-Davies & Brennan, 2007).
According to our results, poor financial situations identified through quantitative models combined with an absence of impression management in the presentation of textual characteristics –the presence of impression management, in contrast, is relatively frequent in ‘non-extreme’ poor performance situations– could alert stakeholders to a potential future business failure. Additionally, these signs could warn auditors that they need to proceed carefully and carry out a further and deeper analysis. In isolation, an increase in negative references is the textual characteristic which may best indicate a worsening of the corporate finance situation (Laitinen, 1993; Steele, 1982).
This paper is not without its limitations, which are potential future research lines. The number of companies in our database is not large, although it is the entire population as we have included every bankrupt listed company on the Spanish Stock Market from 2005 to 2019. The size of the sample simply reflects Spain’s market size, which is similar to many other code law countries such as Italy (Aresu, 2015). In addition, ‘Bankruptcy is a relatively rare occasion among stock market listed companies’ (Schleicher et al., 2007, p. 154). It is an open question if the results and their implications may be generalized to larger sample sizes. Further research in larger areas with wider samples will extend knowledge about how impression management behavior is influenced by different extreme corporate situations. The forward-looking nature of the document under analysis could have affected our findings. Supplementary research could also examine additional corporate media, including digital media, in situations near bankruptcy.