Operating leverage: A critical analysis of the concept and the methods of measurement
ABSTRACT
Operating leverage is one of the more popular parameters used in management practice and scientific research. However, in the literature, there are many definitions and methods of measurement, which are additionally presented imprecisely in both textbooks and scientific publications. This results in a great deal of freedom among authors in the selection of measures for estimating operating leverage and the interpretation of the results, which has a negative impact on functionality for synthesis and theory building. Although some authors made such reservations clear as early as the 1980s, the situation has not changed. Using a three-step process of asking questions relating to how it looks, how it works, and how it compares to other “somethings”, the article conducts a critical analysis of the operational leverage measures used in recent publications and proposes to organize and refine the concept of operational leverage as leverage to increase value added and profit at a given output level using a trade-off mechanism between variable and fixed costs. Finally, the article suggests directions for future research and provides tips on how to incorporate the proposed concept of operating leverage into empirical research.
Keywords: DOL; Financial leverage; DFL; Trade-off; Operating risk; Fixed costs; Cost structure.
JEL classification: G31; G32; M21; M41.
Apalancamiento operativo: Un análisis crítico del concepto y de los métodos de medición
RESUMEN
El apalancamiento operativo es uno de los parámetros más utilizados en la práctica de la gestión y la investigación científica. Sin embargo, en la bibliografía existen muchas definiciones y métodos de medición, que además se presentan de forma imprecisa tanto en los libros de texto como en las publicaciones científicas. Esto da lugar a una gran libertad entre los autores en la selección de medidas para estimar el apalancamiento operativo y la interpretación de los resultados, lo que repercute negativamente en la funcionalidad para la síntesis y la construcción de teorías. Aunque algunos autores ya pusieron de manifiesto estas reservas en los años ochenta, la situación no ha cambiado. Utilizando un proceso de tres pasos consistente en formular preguntas relativas a cómo se ve, cómo funciona y cómo se compara con otras "cosas", el artículo lleva a cabo un análisis crítico de las medidas de apalancamiento operativo utilizadas en publicaciones recientes y propone organizar y perfeccionar el concepto de apalancamiento operativo como apalancamiento para aumentar el valor añadido y el beneficio a un nivel de producción determinado utilizando un mecanismo de compensación entre costes variables y fijos. Por último, el artículo sugiere direcciones para futuras investigaciones y ofrece consejos sobre cómo incorporar el concepto propuesto de apalancamiento operativo a la investigación empírica.
Palabras clave: DOL; Financial leverage; DFL; Trade-off; Operating risk; Fixed costs; Cost structure.
Códigos JEL: G31; G32; M21; M41.
1. Introduction
Or to say it another way, you can catch phenomena in a logical box or in a mathematical box. The logical box is coarse but strong. The mathematical box is fine grained but flimsy. The mathematical box is a beautiful way of wrapping up a problem, but it will not hold the phenomena unless they have been caught in a logical box to begin with.
The concept of operating leverage is addressed in nearly every introductory accounting and finance textbook, and research on operating leverage is part of the prolific field of accounting and finance research. This is demonstrated by, among others, the fact that the SCOPUS database contains 192 articles published after 2000 that contain “operating leverage” in the title, keywords, or abstract. In addition, Google Scholar has 13,800 articles that use the phrase “operating leverage”. These studies can be divided into two phases: the analysis and construction phase of the leverage measure and the phase of searching for the relationship between the leverage measure and a company’s systematic risk, rate of return, economic growth, and so on. However, the first phase, which dates back to the 1960s, when hypotheses were formulated about the relationship between operating profit and fixed and variable costs, did not result in a specific definition of operating leverage and its measurement methods. This fuzziness and generality in defining leverage are evident in accounting and finance textbooks, in which, apart from general wording about its relationship with fixed costs, there are no more specific and unambiguous definitions.
For instance, Clark et al. (1976, p. 448) stated, “Operating leverage measures the sensitivity (or elasticity) of profits with respect to sales, and varies directly with the proportion of fixed costs in total costs”. Similarly, Solomon & Pringle (1980, p. 501) claimed, “The higher a firm’s ratio of fixed to variable operating costs, the higher its operating leverage”. Schall & Haley (1983, p. 451) reported that “Leverage is the existence of fixed costs among a firm’s costs … Operating leverage arises when there are fixed operating costs in the firm’s costs structure”. Given this state of affairs, McDaniel (1984, p. 113) had already raised the concern that “… at best these statements lack definitional specificity, and at worst they are incorrect”. Similar reservations were raised by Neveu (1985, p. 116), who wrote that the “concept of leverage is very general, in a literature it is defined and measured in different ways”. This situation continues today.
One of the more serious consequences of this situation, apart from the low level of usefulness of this parameter in financial management, is that the first phase did not provide researchers with a precise concept of operating leverage and how to measure it, which would reflect certain specific characteristics and properties of companies resulting from decisions made by management boards. It did not result in a convergent view of what operating leverage expresses. In such an unspecified form, this concept began to be widely used to explain the sources of risk and rates of return as well as many other economic phenomena. Researchers adapted to the needs of scientific models those parameters combined with operating leverage that can easily be measured or created new ones, which in their opinion estimated operating leverage. Although those parameters may correctly serve the purposes of individual research, by carrying different information about the characteristics and properties of enterprises, they make aggregative approaches to research synthesis impossible (Tranfield et al., 2003). As a consequence, their role as an explanatory variable is not particularly specific and is therefore controversial. Companies classified according to the operating leverage criterion constitute a sample with low homogeneity in terms of cost specifics. This does not contribute to the synthesis of results and has little theory-building utility. The words of McDaniel (1984), that the analysis of operating leverage is interspersed with vague definitions, invalid implications, and contradictions, still seem to be the reality.
The article aims to analyse critically the definitions and measures of operating leverage and to propose an ordering and clarification of the concept and the method of its measurement. For this purpose, the article uses a hybrid research approach consisting of a three-stage process of asking questions relating to how something looks, how it works, and how it compares to other “somethings” appropriate for a typical critical analysis. In the first stage, a systematic literature review was carried out, the main purpose of which was to become acquainted with the current state of the art on defining and measuring operating leverage. The next stage involved the analysis of the information about enterprises conveyed by various approaches to measuring operating leverage and the relationships between these measures and other parameters. In the last step, the analytical and conceptual theory-building procedure (Wacker, 1998) was used to propose an ordering and clarification of the concept of operational leverage as a trade-off between fixed and variable costs and to suggest a new method of measuring operating leverage.
The article shows that, although operating leverage is commonly used to explain many phenomena, in particular companies’ risks and achievements, authors have considerable freedom in defining and measuring it. Under the name “operating leverage”, the authors use parameters that reflect various characteristics and properties of a company. This is probably due to the imprecise and very general presentation of the essence of operating leverage in academic textbooks. This situation has a negative impact on the aggregative approaches to research synthesis. As noted by Tranfield et al. (2003), the task of management sciences is, on the one hand, to provide “field tested and grounded technological rules”; on the other hand, though, they are very heterogeneous, which makes it impossible to combine results and measure the effectiveness of interventions. The research’s use of a parameter that is highly indeterminate and fuzzy in meaning under the common name “operating leverage” exacerbates these difficulties.
Among the many measures available, the degree of operating leverage (DOL) is the most popular in both textbooks and research. However, critical analysis has shown that the DOL is determined by the sales position relative to the break-even point and is simply the inverse of another parameter that is widespread in management accounting, the margin of safety, which negatively reflects the new cognitive values that the DOL brings. Additionally, a margin of safety better illuminates the essence of the risk commonly combined with the DOL. The relationship of the DOL with the break-even point has already been signalled by Dran (1991) and McDaniel (1984); however, McDaniel (1984), after demonstrating the link between the DOL and the break-even point to separate operating leverage from the sales function, proposed the concept of overall operating leverage (OOL), which, according to him, is equal to the break-even point. Thus, he decoupled OOL from the cost structure since changing the break-even point does not require a change in the cost structure. That is, he proposed the coexistence of two types of operating leverage: OOL and point degree of operating leverage (DOL). He also did not negate the usefulness of the DOL as a measure of operational risk. Furthermore, Dran (1991) stated that operational risk will increase when the break-even point rises. In contrast, we not only demonstrate the relationship between the DOL and the break-even point but additionally show that the DOL is simply the inverse of the margin of safety and therefore adds no new cognitive value. Moreover, the margin of safety shows the consequences of a sales position relative to the break-even point and the resulting risk more clearly than the DOL, so it is more useful for management. So far, the lack of a combined margin of safety and DOL measure has meant that, although the margin of safety is a popular parameter in management accounting, the authors know of no case in the literature in which it is combined with operating leverage.
The DOL and thus the margin of safety is determined by the position of sales relative to the break-even point and thus reflect the state of the company, which is the result of the impact of many factors, both internal, influencing the break-even point (costs and price), and external, influencing the sales (demand and economic situation). Hence, the DOL is not a fixed characteristic of the company resulting from management decisions but only a temporary state.
Moreover, it has been shown that the degree of financial leverage (DFL) is also determined by the margin of safety and that there is a deterministic relationship between the DOL and the DFL, which sheds new light on the trade-off between the DOL and the DFL. Therefore, to make operating leverage a parameter that reflects the fixed properties of the company independent of the level of sales and resulting from the decisions made by the management, we propose to measure it as the ratio of fixed costs to total costs at the break-even point. Determining the sales volume for which the cost structure is measured has a significant impact on the essence of operating leverage. This measure of operating leverage is independent of the actual sales and reflects well the effects of the trade-off between fixed and variable costs. The essence of operating leverage as a trade-off between fixed and variable costs has been presented only in a few publications and not in a very convergent manner. The method of measuring leverage proposed by the authors makes it a strategic management tool and combines the change in operating leverage with the ability of enterprises to generate added value, an approach that has not been presented before in the literature. It also has a significant impact on the quality of the definition of operating leverage, the fuzzy nature or even errors of which have already been alleged in the past literature and which, as shown in the article, are still common. The proposed approach better protects operating leverage from ambiguity, clarifies the meaning, deepens the understanding, and provides conclusive criteria. The convergence of the definitions of operating leverage may contribute to increasing the quality of the aggregative approaches to research synthesis. Thus, the article reports research on operating leverage and attempts to make it a parameter that accurately reflects specific features and properties of the company resulting from strategic decisions.
The rest of the article is organized as follows. First, we provide examples of the presentation of operating leverage in multi-edition English textbooks. Then, based on a systematic review of the literature, we identify and analyse the operating leverage measures used in the recent literature. In the next step, we specify the method of measuring operating leverage and demonstrate its advantages based on theoretical examples. In the last part, we make suggestions for future research and how best to incorporate the concept of operating leverage into empirical research.
2. Literature review
2.1. The presentation of operating leverage in textbooks in the 21st century
Academic textbooks present a synthesis of current and well-established knowledge in a given field of science. They contain less up-to-date knowledge than scientific articles, but, thanks to their wide circulation and large number of readers, they spread knowledge effectively. This is the basic knowledge that every person involved in each field of science should have. Although scientists often try to verify and develop textbook knowledge in their work, it influences their perception of the issue. For this review, large-edition English-language textbooks were selected, resulting in a high probability that most scientists dealing with accounting and finance have acquired the knowledge contained in them. The purpose of the review is to offer examples of the presentation of operating leverage in academic textbooks that may have influenced the subsequent definition of leverage in scientific publications.
The analysis of the presented examples leads to significant observations in two areas: the approaches to defining and measuring leverage; and the factors determining leverage.
Defining and measuring approaches
The descriptions of operating leverage in the English-language multi-edition textbooks presented are characterized by two basic weaknesses. Firstly, when defining operating leverage, they state that it is the cost structure and most often the share of fixed costs in the total costs. They do not state in which situation and for which sales this structure should be measured. The costs are dynamic, and their structure is variable.
Secondly, when describing the impact of operating leverage on risk as the sensitivity of a change in profit to a change in sales, they often do not provide a way to measure that sensitivity – whether it is as a percentage or absolute. If it is given, it is a percentage. The difference is significant because high-percentage sensitivity, for example, 100% at low profit, means a small absolute increase or decrease in profit and does not have a substantial impact on the cash flow. The absolute sensitivity of a change in profit to a change in sales has much greater usability in management because, for example, it directly shows how each acquired or lost project has an impact on the profit and cash flow.
As we can see in Table 1, the definition of leverage has weaknesses both in the definiendum, because there is no clear view of what the essence of operating leverage is, and at the level of definiens, because it is vague and ambiguous.
The factors determining operating leverage
There is ambiguity in the textbooks regarding the concept of operating leverage. In general, we can distinguish two approaches. The first treats cost change as a natural process resulting from its dynamics and sees the change of leverage in the rationalization of fixed costs. Vernimmen et al. (2009) described it specifically and vaguely. They stated that “Operating leverage links variation in activity (measured by sales) with variations in result (either operating profit or net income). Operating leverage depends on the level and nature of the breakeven point” (p. 178). They further asserted that leverage depends on four key parameters: the stability of sales, the structure of production costs, the company’s position relative to its break-even point, and the level of interest expense. This means that, according to these authors, operating leverage is affected by both market risk (stability of sales) and debt (net income and interest). Meanwhile, in the second approach, the change in the cost structure is a trade-off effect between fixed and variable costs. This approach was presented by Ross et al. (2010). It involves deciding whether to build your own factory or to outsource production. Furthermore, Brigham & Houston (2019) stated that operating leverage depends on technology.
It should be added that there is a textbook that makes no mention of operating leverage, even though the title contains the word “principle” (Watson & Head, 2010). In general, it treats leverage as financial leverage only.
Table 1. Samples of the definitions of operating leverage in popular English-language textbooks
| Definitions – Quote | Approach to measurement – Quote | Measure | Authors |
|---|---|---|---|
| “As a result, a store with high fixed costs is said to have high operating leverage. High operating leverage magnifies the effect on profits of a fluctuation in sales” (p. 479) Summary: “Operating leverage, the degree to which costs are fixed. A project’s break-even point will be affected by the extent to which costs can be reduced as sales decline. If the project has mostly fixed costs, it is said to have high operating leverage” (p. 485) | “High operating leverage magnifies the effect on profits of a fluctuation in sales” (p. 479) Summary: “High operating leverage implies that profits are more sensitive to changes in sales” (p. 485) | DOL = percentage change in profits/percentage change in sales | Selected material from Fundamentals of corporate finance (2001) |
| “The higher its fixed costs as a share of total costs, the higher the breakeven point and the greater the operating leverage and the volatility of its earnings are” (p. 188) “A firm that has high fixed costs relative to total costs will have a high operating leverage, because the cyclicality of operating income will change proportionally more than when sales change” (p. 369) | “Operating leverage is the variability of earnings to corresponding changes in revenues” (p. 178) | Operating leverage = % EBIT/% sales | Vernimmen et al. (2009) |
| “Firms with high fixed costs and low variable costs are generally said to have high operating leverage” (p. 455) “Operating leverage refers to the firm’s fixed costs of production” (p. 455) | “Operating leverage magnifies the effect of the cyclicality of a firm’s revenues on beta. That is, a firm with a given sales cyclicality will increase its beta if fixed costs replace variable costs in its production process” (p. 455) | Not specified | Ross et al. (2010) |
| “A production facility with high fixed costs, relative to variable costs, is said to have high operating leverage” (p. 222) “A business with high fixed costs is said to have high operating leverage” (p. 248)Glossary: “Operating leverage: Fixed operating costs, so called because they accentuate variations in profits (cf. financial leverage)” (pp. G–11) | “Operating leverage is usually defined in terms of accounting profits rather than cash flows and is measured by the percentage change in profits for each 1% change in sales” (p. 248) | DOL | Brealey et al. (2011) |
| “Another factor that can affect the market risk of a project is its degree of operating leverage, which is the relative proportion of fixed versus variable costs” (p. 420) | “Holding fixed the cyclicality of the project’s revenues, a higher proportion of fixed costs will increase the sensitivity of the project’s cash flows to market risk and raise the project’s beta” (p. 420) | Not specified | Berk & DeMarzo (2014) |
| “Operating leverage refers to the proportion of the total costs of the firm that are fixed” (p. 142) | “Other things remaining equal, higher operating leverage results in greater earnings variability which in turn results in higher betas” (p. 142) | Fixed costs measure = fixed costs/variable costs EBIT variability measure = % change in EBIT/ % change in revenues | Damodaran (n.d.) |
| “The extent to which costs are fixed: operating leverage. If a high percentage of its costs are fixed and thus do not decline when demand falls, this increases the firm’s business risk. This factor is called operating leverage” (p. 481) “When a high percentage of total costs are fixed, the firm is said to have a high degree of operating leverage” (p. 481) | “In business terminology, a high degree of operating leverage, other factors held constant, implies that a relatively small change in sales results in a large change in ROIC” (p. 481) | Not specified | Brigham & Houston (2019) |
2.2. Operating leverage in research
To investigate the operating leverage measures used in the research, a systematic review of the literature was performed. Based on the assumption that the most recent articles reflect the latest views and trends in the field, articles from the last 5 years, from 2017 to September 2021, were reviewed. Articles from journals indexed in the Scopus and Web of Science databases were selected for the review. The review covered articles in the fields of economics, econometrics, finance, business, management, and accounting that had the phrase “operating leverage” in the title, keywords, or abstract. In this way, 58 articles were selected, 55 of which were published in journals indexed in Scopus and 45 of which were indexed in Web of Science (WoS). The distribution of article in the analysed years is shown in Figure 1.
Figure 1. Number of published papers in subsequent years
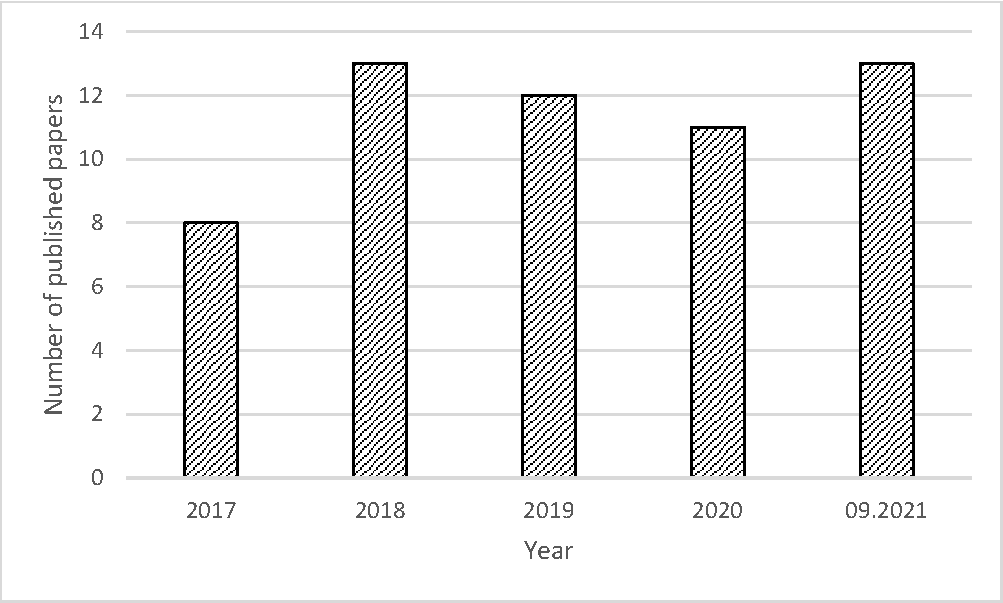
The articles were published in a total of 49 journals as the vast majority of journals accounted for one article each (Table 2). An exception is the Review of Financial Studies, which published four articles, and only in this case can we talk about specializing in exploring the issues of operating leverage.
Table 2. Journals in which the investigated articles were published
| Item | Journal title | Number of published papers | Indexed | |
|---|---|---|---|---|
| Scopus | WoS | |||
| 1 | Review of Financial Studies | 4 | x | X |
| 2 | Eurasian Economic Review | 2 | x | X |
| 3 | Finance Research Letters | 2 | x | X |
| 4 | Journal of Corporate Finance | 2 | x | X |
| 5 | Journal of Financial and Quantitative Analysis | 2 | x | X |
| 6 | Review of Quantitative Finance and Accounting | 2 | x | X |
| 7 | Statistika | 2 | x | |
| 8 | Abacus | 1 | X | X |
| 9 | Accounting & Finance | 1 | X | X |
| 10 | Accounting Perspectives | 1 | x | X |
| 11 | Asian Economic and Financial Review | 1 | x | |
| 12 | Asia- Pacific Journal of Accounting & Economics | 1 | x | X |
| 13 | Business History | 1 | x | X |
| 14 | Competition and Regulation in Network Industries | 1 | x | |
| 15 | Cornell Hospitality Quarterly | 1 | X | X |
| 16 | Economics and Business Review | 1 | x | X |
| 17 | Economics and Sociology | 1 | x | X |
| 18 | Financial and Credit Activity – Problems of Theory and Practice | 1 | X | |
| 19 | International Journal of Business | 1 | x | X |
| 20 | International Journal of Business and Society | 1 | X | X |
| 21 | International Journal of Energy Economics and Policy | 1 | X | |
| 22 | International Journal of Finance and Economics | 1 | X | X |
| 23 | International Journal of Production Economics | 1 | X | X |
| 24 | International Journal of Supply Chain Management | 1 | X | |
| 25 | International Review of Economics and Finance | 1 | X | X |
| 26 | Issues in Accounting Education | 1 | X | X |
| 27 | Journal of Business Valuation and Economic Loss Analysis | 1 | X | |
| 28 | Journal of Contemporary Accounting and Economics | 1 | X | X |
| 29 | Journal of Finance | 1 | X | X |
| 30 | Journal of Financial Economic Policy | 1 | X | X |
| 31 | Journal of Financial Economics | 1 | X | X |
| 32 | Journal of Financial Research | 1 | X | X |
| 33 | Journal of Governance and Regulation | 1 | X | |
| 34 | Journal of Hospitality Financial Management | 1 | X | |
| 35 | Journal of International Financial Markets , Institutions & Money | 1 | X | |
| 36 | Journal of Management Science and Engineering | 1 | X | |
| 37 | Journal of Risk and Financial Management | 1 | X | |
| 38 | Management Science | 1 | X | X |
| 39 | Pacific Business Review International | 1 | X | |
| 40 | Pacific-Basin Finance Journal | 1 | X | X |
| 41 | Review of Accounting and Finance | 1 | X | X |
| 42 | Review of Accounting Studies | 1 | X | X |
| 43 | Revista Espacios | 1 | X | |
| 44 | Small Business Economics | 1 | X | X |
| 45 | Accounting Review | 1 | X | X |
| 46 | Journal of Portfolio Management | 1 | X | X |
| 47 | Journal of Financial Economics | 1 | X | X |
| 48 | Tourism Economics | 1 | x | x |
| 49 | Vision | 1 | x | |
| Total | 58 | |||
Table 3 shows the subject category in which journals ranked highest in the year the article was published. As we can see, many articles dealing with the issues of operating leverage were published in journals specializing in finance and accounting.
Table 3. Number of articles published in journals classified by the subject category in which it has the highest ranking in the year when the article was published
| Subject category according to Scopus | Number | Percentage | Subject category according to WoS | Number | Percentage |
|---|---|---|---|---|---|
| Finance | 25 | 45 | Business, Finance | 31 | 69 |
| Business and International Management | 5 | 9 | Economics | 6 | 13 |
| General Business, Management, and Accounting | 5 | 9 | Business | 4 | 9 |
| General Economics, Econometrics, and Finance | 5 | 9 | Management | 2 | 4 |
| Accounting | 4 | 7 | History of Social Sciences | 1 | 2 |
| Statistics, Probability, and Uncertainty | 2 | 4 | Operations Research and Management Science | 1 | 2 |
| Economics and Econometrics | 1 | 2 | Total | 45 | 100 |
| Education | 1 | 2 | |||
| Engineering | 1 | 2 | |||
| Geography, Planning, and Development | 1 | 2 | |||
| History | 1 | 2 | |||
| Information Systems and Management | 1 | 2 | |||
| Management Science and Operations Research | 1 | 2 | |||
| Strategy and Management | 1 | 2 | |||
| Tourism, Leisure, and Hospitality Management | 1 | 2 | |||
| Total | 55 | 100 |
A large proportion of these journals consist of leading journals in the discipline, and they have been given a high ranking by both Scopus (47% of journals were in the top two deciles) and Web of Science (WoS) (56% of journals were in the first quartile (Q1)). Moreover, 30 (67%) journals indexed in WoS have an impact factor (IF) (Table 4).
Table 4. Number of articles published in journals classified by the source’s rank for the subject category in which the journal has the highest ranking in the year when the article was published
| Rank according to Scopus | Rank according to WoS | ||||
|---|---|---|---|---|---|
| Decile | Number | Percentage | JCI Quartile | Number | Percentage |
| 10 | 17 | 31 | Q1 | 25 | 56 |
| 9 | 9 | 16 | Q2 | 5 | 11 |
| 8 | 4 | 7 | Q3 | 6 | 13 |
| 7 | 5 | 9 | Q4 | 9 | 20 |
| 6 | 1 | 2 | Total | 45 | 100 |
| 5 | 2 | 4 | |||
| 4 | 7 | 13 | |||
| 3 | 5 | 9 | According to Journal Citation Reports edition | ||
| 2 | 3 | 5 | Social Sciences Citation Index (with IF) | 30 | 67 |
| 1 | 2 | 4 | Emerging Sources Citation Index (without IF) | 15 | 33 |
| Total | 55 | 100 | Total | 45 | 100 |
The table shows the number of journals with the Scopus ranking rounded to the decile and the WoS ranking according to the Journal Citation Indicator (JCI).
As can be seen in Table 5, in the dominant part of the articles, operating leverage was used as an explanatory variable of other phenomena. Only in 12 articles was it an explained variable. The dominant research areas in which operating leverage was used to explain the phenomena were risk and performance (profitability and value).
Table 5. Research issue with the use of the variable “operating leverage”
However, not all publications provide the method of measuring operating leverage. Fifty-three articles provide methods for measuring the operating leverage of an enterprise, and these are presented in Table 6. In five articles, the authors refer to the change in operating leverage caused by a change in all or selected fixed costs but do not provide a precise measure of the operating leverage. Li (2017) reported that fixed costs increase operating leverage, making companies more sensitive to business conditions. Bouvard & De Motta (2021) assumed that labour costs are the main component of fixed costs and considered the change in operating leverage as the exchange of fixed labour costs for variable costs. Similarly, Chino (2021) believed that operating leverage is dependent on the elasticity of labour costs and examined their impact on the cost of equity capital. Guo & Zhou (2018) investigated the impact of disaggregation of production into subsidiaries on the obtained benefits depending on the economic situation and the method of consolidation of financial statements. Krumwiede et al. (2018) provided a didactic example in which they left the calculation of the operating lever to students.
As we can see in Table 6, in research, as in textbooks, the most popular measure of operating leverage is the degree of operating leverage (DOL), which was used in 26 papers in the analysed years. The DOL is understood as the percentage change in profits for each 1% change in unit output or sales, so \(DOL = \left( \Delta EBIT/EBIT \right)/\left(\Delta Q/Q \right)\), which is equivalent to \(DOL = (Q(p - vc))/(Q(p - vc) - FC)\), where Q – the number of units of output, \(\Delta Q\) - Q absolute change, EBIT – earnings before interest and taxes, \(\Delta EBIT\) – EBIT absolute change, vc – variable costs per unit, p – price per unit, and FC – fixed costs. However, due to problems with the acquisition of information about the fixed and variable costs of the tested companies, the first form has most often been used for DOL estimation.
In research, the DOL estimation method developed by Mandelker & Rhee (1984), who used time series regressions for the estimation of the DOL, has gained popularity. Over the years investigated, this method has been used by the authors of four papers (Chung et al., 2017; Dugan et al., 2018; Harjoto, 2017; Hassouna & Salem, 2021). Criticizing the method of Mandelker & Rhee (1984) for assuming stationary sales and profit, O’Brien & Vanderheiden (1987) developed a modified version using a trend component for these parameters. This method was used by the authors of five papers (Arnold & Rhodes, 2021; Farah et al., 2021; Jiao et al., 2019; Pawar et al., 2019; Zia ul haq et al., 2020). Earlier, Stelk et al. (2015), examining the accuracy of the DOL estimation with these methods, concluded that the method of O’Brien & Vanderheiden (1987) is better than the method of Mandelker & Rhee (1984). Another estimation method was proposed by Kalinowski (2017) using a time series regression of costs on revenue to estimate fixed costs and variables, which he then used to calculate the DOL. Some authors have proposed a modified version of the DOL. Yang et al. (2021) narrowed down the concept of leverage to an audit firm’s operating leverage, measured as the ratio of the percentage change in audit hours to the percentage change in audit fees. In turn, Aharon et al. (2019) proposed to replace the elasticity of operating profits with respect to output with the elasticity of the free cash flow (FCF). In contrast, Canina & Potter (2019) used the relative operating cost changes to relative revenue changes.
Another approach to measuring operational leverage that has been used in research is to measure it as the costs-to-assets ratio. The first to propose this method of measurement was Novy-Marx (2011), who defined operating leverage as annual operating costs divided by assets, where operating costs are the cost of goods sold (COGS) plus selling, general, and administrative expenses (XSGA). This approach was a point of reference for subsequent researchers, who used it without changes (nine papers, Table 6) (Bhojraj et al., 2021; Cook et al., 2019, 2021; Golubov & Konstantinidi, 2019; Hasanhodzic & Lo, 2019; Jiao et al., 2019; Poretti & Heo, 2022; Tao et al., 2020; Taussig & Akron, 2017) or modified it. Chen et al. (2019) and Jiao et al. (2019) used only XSGA expenses because COGS has too variable a nature. A related measure, fixed assets over total assets, was used by Grau & Reig (2021) and Pepelasisa et al. (2020). On the other hand, Ashraf et al. (2017) used the investment in real assets to total assets as a measure. However, Kumar & Yerramilli (2018) and Schueler (2018) measured operating leverage as the ratio of fixed costs to enterprise value. Another group of researchers, assuming that labour costs are the main component of fixed costs, employed them to measure operating leverage, relating them either to total assets (Taussig, 2017) or to value added (Donangelo, 2021).
Still other approaches have been used, such as the ratio of fixed to variable costs, which Aboody et al. (2018) estimated using time series regressions of costs on revenue. Other researchers (Beuselinck et al., 2021; Detemple & Kitapbayev, 2020; Johnstone, 2020) have adopted this approach in their theoretical considerations. Similarly, Binz (2020) used an equivalent measure, the share of fixed costs in total costs. Chu et al. (2020) estimated operating leverage as the variability in accounting earnings, computed as the standard deviation of accounting returns on total assets over the last five years. In turn, Donangelo et al. (2019) defined operating leverage as the covariance of equilibrium operating profit growth and total factor productivity growth minus one. Gu et al. (2018) and Li et al. (2020) employed the ratio of quasi-fixed production costs to sales to measure operating leverage. They determined the quasi-fixed costs from the regression model. Table 6 presents an overview of the operating leverage measures used in research in recent years.
Table 6. Operating leverage measures used in research between 2017 and 2021
| Measurement method | Estimation | Authors |
|---|---|---|
| DOL | Time series regressions of revenue and profit; Mandelker & Rhee (1984) | Chung et al. (2017) Dugan et al. (2018) Harjoto (2017) Hassouna & Salem (2021) |
| Time series regressions using the trend component; O’Brien & Vanderheiden (1987) | Jiao et al. (2019) Pawar et al. (2019) Arnold & Rhodes (2021) Farah et al. (2021) Zia ul haq et al. (2020) | |
| Time series regressions of costs on revenue | Kalinowski (2017) Kalinowski & Puziak (2018) | |
| Sarkar (2018a) Sarkar (2018b) Kumar et al. (2021) Chmelíková & Somerlíková (2018a) Chmelíková & Somerlíková (2018b) Khaw et al. (2019) Nguyen et al. (2018) Chu et al. (2017) Sriyono et al. (2019) Hasanudin et al. (2020) Grosul et al. (2019) Pandey & Ponni (2017) Lambert (2020) Vorozhbit et al. (2019) Aharon et al. (2019) | ||
| The audit firm’s operating leverageThe ratio of the percentage change in audit hours to the percentage change in audit fees | Yang et al. (2021) | |
| Annual operating costs divided by assets, where operating costs is COGS plus XSGA | Taussig & Akron (2017b) Golubov & Konstantinidi (2019) Jiao et al. (2019) Cook et al. (2019) Cook et al. (2021) Bhojraj et al. (2021) Tao et al. (2020) Hasanhodzic & Lo (2019) Poretti & Heo (2022) | |
| Annual XSGA divided by assets | Chen et al. (2019) Jiao et al. (2019) | |
| Fixed assets over total assets | Grau & Reig (2021) Pepelasisa et al. (2020) | |
| The investment in real assets[Total assets − (cash + account receivables + intangibles)] to total assets | Ashraf et al. (2017) | |
| Quasi-fixed production costs to sales | Fixed costs from the regression model | Gu et al. (2018) Li et al. (2020) |
| The ratio of the fixed operating costs to firm value | Kumar & Yerramilli (2018) | |
| The present value of fixed costs to the unlevered company value | Schueler (2018) | |
| Firm’s expenditure on employees divided by total assets | Taussig (2017) | |
| The ratio of labour expenses to value added | Donangelo (2021) | |
| Fixed-to-variable cost ratio | Time-series regressions of costs on revenue | Aboody et al. (2018) |
| Detemple & Kitapbayev (2020) Johnstone (2020) Beuselinck et al. (2021) | ||
| The share of fixed costs in total costs | Binz (2020) | |
| The variability in accounting earnings, computed as the standard deviation of accounting returns on total assets over the last 5 years | Chu et al. (2020) | |
| The ratio between the elasticity of operating profit to TFP and the elasticity of value added to TFP minus one | Donangelo et al. (2019) | |
| The relative operating cost changes to relative revenue changes | Canina & Potter (2019) |
3. Analysis of the information about the company that the individual measures of operating leverage
The usefulness of each observable indicator in both management practice and scientific research depends on the strength of its relationship with the indicatum, both theoretical and empirical. In the case of operating leverage, the biggest problem is the hazy, unclear, and imprecise indicatum. In the literature, authors have commonly formulated views that the measure that they have proposed approximates operating leverage, but they have not formulated, explicitly or implicitly, what exactly approximates which properties and characteristics of enterprises. The indeterminacy of the indicatum, in turn, creates freedom in choosing the indicator. Fixed costs seem to be the only common denominator of the operating leverage indicators used. However, when referenced in different ways and to different categories, they do not approximate clear and coherent features or properties of companies.
3.1. What does the DOL say about a company?
The most popular method of measuring operating leverage in textbooks, which is equally popular in research, is the DOL. From the first researchers, like Gahlon & Gentry (1982), to the latest publications, the DOL has been presented as a company business risk factor. When using the DOL as an explanatory variable, one should first ask the following question: what does the DOL say about a company?
The essence of the DOL is presented in formula (1):
\[\begin{equation} \label{eq1} \small DOL = \frac{\% \Delta EBIT}{\% \Delta Q} \ \ \ \ \ (1) \end{equation}\]which, after transformations, takes another form that is also popular in the literature:
\[\begin{equation} \label{eq2} \small DOL = \ \frac{S - VC}{S - VC - FC} \ \ \ \ \ (2) \end{equation}\]However, transforming further:
\[\begin{equation*} \small DOL = \frac{Qm}{Qm - FC} = \frac{\frac{Qm}{m}}{\frac{Qm - FC}{m}} = \frac{Q}{Q - \frac{FC}{m}}\, \end{equation*}\]where S – sales of revenue, VC – total variable costs, m – the contribution margin per unit, and \(m = p - vc\).
Substituting \(Q_{BEP} = \frac{FC}{m}\), the volume of output at the operating break-even point, we obtain:
\[\begin{equation} \label{eq3} \small DOL = \frac{Q}{Q - Q_{BEP}} \ \ \ \ \ (3) \end{equation}\]Analogously:
\[\begin{equation} \label{eq4} \small DOL = \frac{S}{S - S_{BEP}} \ \ \ \ \ (4) \end{equation}\]because \(\frac{Q - Q_{BEP}}{Q} \ \text{ or } \ \frac{S - S_{BEP}}{S} = \ MOS^{o}\) – the operating margin of safety, where SBEP – sales revenue at the operating break-even point.
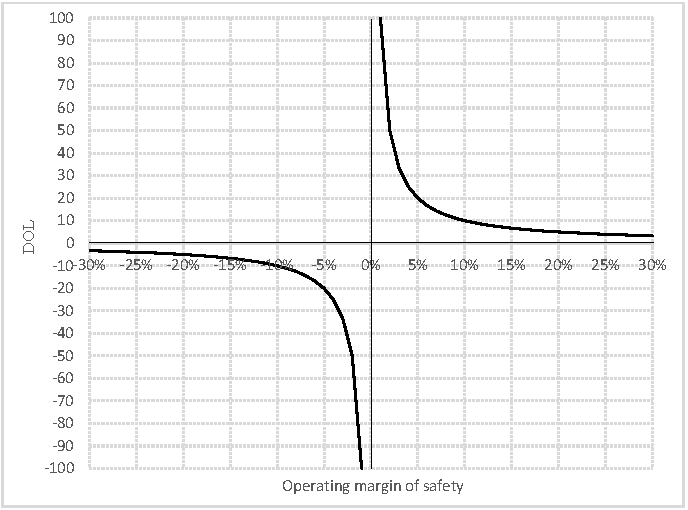
Then: \[\begin{equation} \label{eq5} \small DOL = \frac{1}{MOS^{o}} \ \ \ \ \ (5) \end{equation}\]Because -1 < MOSO < 1, the DOL takes values between (-1, -∞) and (∞, 1).
As we can see, the DOL is simply the reverse of a popular parameter in accounting, the margin of safety, which shows how much the output or sales level can fall before a business reaches its break-even point. Therefore, if the surplus of sales at the break-even point is 10%, the DOL will always be 10 regardless of the cost structure (Figure 2). The higher the DOL, the smaller the part of sales that works for profit, and thus the profit is relatively lower. In turn, a negative DOL means that the sales are below the break-even point. The relationship between the DOL and the break-even point has already been noted by such authors as Dran (1991) and McDaniel (1984); however, many authors still have not included this aspect in their interpretation of the DOL.
Figure 2. The DOL’s dependence on the margin of safety
What does the DOL approximate for us? First, companies with a high DOL have a small surplus of sales above the break-even point and thus also achieve a relatively low profit. This may be due to a poor financial situation and sales problems. In that case, the DOL does not approximate the cost structure but only shows the bad situation of the company. In addition, it is not, as Long (1992) stated when commenting on the article by Dran (1991), that high fixed costs are linked to a high break-even point, which appears to be the normal economic relationship. This will be demonstrated later in the article. Second, the DOL is a measure of the sensitivity of a change in profit to a change in sales, but it is the percentage sensitivity. It rises as the profit falls. Therefore, when the profit is, for example, $100, a change of 1000% means an increase or decrease of $1000 and it does not matter for the company’s cash flow and liabilities. Hence, in this approach, the DOL is a poor measure of risk, as Kroll & Aharon (2014) have already suggested. Rather, it should be treated as an indicator of a company’s bad financial condition. Therefore, popular studies in the literature on the relationship of the DOL with many aspects of the functioning of a company could be reduced to the statement that they focused on examining the impact of the bad situation of the company on these aspects. Third, as follows from formula (5) and Figure 2, the higher the sales surplus over the break-even point (MOSO), the smaller the DOL, and it tends towards 1. Conversely, the authors of the popular DOL estimation method, Mandelker & Rhee (1984), obtained a DOL close to 1 or smaller than 1 for the examined sample of enterprises. This would suggest that the tested enterprises had almost 100% of sales above the break-even point, which is obviously unrealistic and indicates a poor-quality estimation. The DOL estimation using the method of O’Brien & Vanderheiden (1987) conducted by Jiao et al. (2019) is less controversial; however, the median for the sample was DOL = 1.449, which means that 50% of the tested enterprises had over 69% of sales above the break-even point, which is also not realistic.
3.2. The DOL compound of the DFL
There are statements in the literature that the relationship between the degree of operating leverage (DOL) and the degree of financial leverage (DFL) is of significant interest in corporate finance (Sarkar, 2018b). There is also current research on the trade-off between the DOL and the DFL (Dugan et al., 2018; Pawar et al., 2019). Below we will show the nature of the relationship between the DOL and the DFL.
Similar to the DOL, the DFL is defined as the percentage change in earnings after interest and taxes (EAIT) that results from a percentage change in EBIT.
\[\begin{equation} \label{eq6} \small DFL = \frac{\% \Delta EAIT}{\% \Delta EBIT} \ \ \ \ \ (6) \end{equation}\]In the literature, this has sometimes been presented in synonymous versions:
\[\begin{equation} \label{eq7} \small DFL = \frac{\% \Delta EPS}{\% \Delta EBIT} \ \ \ \ \ (7) \end{equation}\] \[\begin{equation} \label{eq8} \small DFL = \frac{\% \Delta ROE}{\% \Delta EBIT} \ \ \ \ \ (8) \end{equation}\]which, after transformations, take a form that has also been popular in the literature:
\[\begin{equation} \label{eq9} \small DFL = \frac{EBIT}{EBIT - Int} \ \ \ \ \ (9) \end{equation}\]where Int – interest, \(\Delta EAIT\) – EAIT percentage change, \(\Delta EPS\) – earnings per share percentage change, and \(\Delta ROE\) – return on equity percentage change.
After further transformations, we obtain:
\[\begin{equation} \label{eq10} \small DFL = \frac{Qm - FC}{Qm - FC - Int} = \frac{Q - \frac{FC}{m}}{Q - \frac{FC + Int}{m}} \ \ \ \ \ (10) \end{equation}\]Substituting \(\frac{FC}{m} = Q_{BEP}\) and \(\frac{FC + Int}{m} = Q_{BEP}^{F}\) – the volume of output at the financial break-even point,1 we obtain:
\[\begin{equation} \label{eq11} \small DFL = \frac{Q - Q_{BEP}}{Q - Q_{BEP}^{F}} = \ \frac{\frac{Q - Q_{BEP}}{Q}}{\frac{Q - Q_{BEP}^{F}}{Q}} \ \ \ \ \ (11) \end{equation}\]Because
\(\frac{Q - Q_{BEP}}{Q} = MOS^{o}\) – operating margin of safety
\(\frac{Q - Q_{BEP}^{F}}{Q} = MOS^{F}\) – financial margin of safety
we finally obtain:
\[\begin{equation} \label{eq12} \small DFL = \frac{MOS^{O}}{MOS^{F}} \ \ \ \ \ (12) \end{equation}\]As we can see, the DFL is also associated with the margin of safety.
\[\begin{equation} \label{eq13} \small MOS^{O} - MOS^{F} = \frac{Int}{mQ} = \frac{Int}{M} \ \ \ \ \ (13) \end{equation}\]where: M = mQ – the total contribution margin.
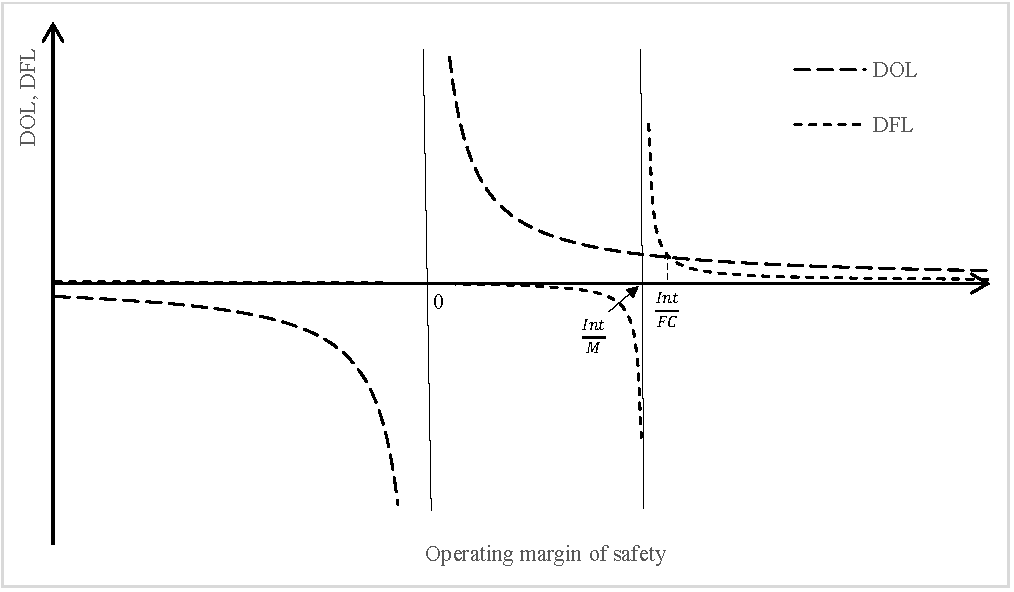
This difference (13) shows how much of the sales works to cover interest. Therefore, the DFL is not a measure of the level of indebtedness, as claimed by Chung et al. (2017). Even if a company with low debt and low costs of debt is in a bad situation and has a small surplus of sales over \(Q_{BEP}^{F}\) (which indicates \(MOS^{O} = Int/M\)), its DFL will be high. When it is below \(Q_{BEP}^{F}\), the DFL will be negative (Figure 3).
Meanwhile, the relationship between the DOL and the DFL is as follows:
\[\begin{equation} \label{eq14} \small DFL = \frac{1}{DOL \cdot MOS^{F}} \ \ \ \ \ (14) \end{equation}\] \[\begin{equation} \label{eq15} \small DFL = \frac{1}{DOL\left( \frac{1}{DOL} - \frac{Int}{mQ} \right)} = \frac{1}{1 - DOL\frac{Int}{M}} \ \ \ \ \ (15) \end{equation}\]Figure 3. The relationship of the DOL and the DFL with the margin of safety
From formula (15), it follows that, with the change in sales, there is a positive relationship between the DOL and the DFL, assuming that Int = constans, because, if the DOL increases, then M decreases.
If we mark Qx as the output at which DOL = DFL, then:
\[\begin{equation} \label{eq16} \small \frac{Q_{x}m}{Q_{x}m - FC} = \frac{Q_{x}m - FC}{Q_{x}m - FC - Int} \ \ \ \ \ (16) \end{equation}\] \[\begin{equation} \label{eq17} \small \left( Q_{x}m - FC \right)^{2} = Q_{x}m\left( Q_{x}m - FC - Int \right) \ \ \ \ \ (17) \end{equation}\] \[\begin{equation} \label{eq18} \small {Q_{x}m}^{2} - 2Q_{x}mFC + FC^{2} = {Q_{x}m}^{2} - Q_{x}mFC - Q_{x}mInt \ \ \ \ \ (18) \end{equation}\] \[\begin{equation} \label{eq19} \small Q_{x}mFC + FC^{2} = -\ Q_{x}mInt \ \ \ \ \ (19) \end{equation}\] \[\begin{equation} \label{eq20} \small FC^{2} = Q_{x}m\left( FC - Int \right) \ \ \ \ \ (20) \end{equation}\] \[\begin{equation} \label{eq21} \small \frac{FC^{2}}{m} = Q_{x}\left( FC - Int \right) \ \ \ \ \ (21) \end{equation}\] \[\begin{equation} \label{eq22} \small Q_{x} = \frac{FC^{2}}{m\left( FC - Int \right)} = Q_{BEP}\frac{FC}{FC - Int} \ \ \ \ \ (22) \end{equation}\]Therefore, the \(MOS_{x}^{O}\) at which DOL = DFL is:
\[\begin{equation} \label{eq23} \small MOS_{x}^{O} = \frac{Q_{x} - Q_{BEP}}{Q_{x}} = \ \frac{Q_{BEP}\frac{FC}{FC - Int} - Q_{BEP}}{Q_{BEP}\frac{FC}{FC - Int}} = \frac{\frac{FC}{FC - Int} - \frac{FC - Int}{FC - Int}}{\frac{FC}{FC - Int}} = \frac{Int}{FC} \ \ \ \ \ (23) \end{equation}\]It is apparent that there is a deterministic relationship between the DOL and the DFL. An analysis of Figure 3 shows that DFL > DOL when MOSO < 0 and therefore when there is an operational loss (EBIT is negative) and when Int/M < MOSO < Int/FC and thus is in the range in which the DOL is relatively high, whereas, when MOSO > Int/FC and Int < FC, then DFL < DOL. However, if Int > FC (which is not very realistic), then \(MOS_{x}^{O}\ \)> 1, which is not in line with the definition of the MOS, and, in this case, when MOSO > Int/M, DFL > DOL.
This raises a question about the sense of the trade-off theory between the DOL and the DFL, which assumes that, when the DOL drops, companies increase their DFL because of the decision to balance the operational and financial risk (Mandelker & Rhee, 1984). However, as we can see from the analysis carried out in a realistic variant, when Int < FC, DFL > DOL when either loss occurs and the DOL is negative or when there is a slight excess of sales over \(Q_{BEP}^{F}\) (MOSO = Int/FC), and then the DOL is relatively high. However, if the sales move away from \(Q_{BEP}^{F}\), then DFL < DOL. Assuming even a very unrealistic situation, in which the interest is one-third of the fixed costs (the interest is covered by the profit after covering the costs and is usually many times lower than the costs), then Int/FC = 0.333, which corresponds to DOL = 3. Hence, in this case, when the DOL falls below 3, DFL < DOL, and we cannot say anything about the DFL substituting for the DOL.
As we can see, the values of the DOL and the DFL and their interrelationships are determined by the sales position in relation to the break-even point. Therefore, empirical studies on the search for relationships between the DOL and the DFL can only be studies on the quality of estimation of these parameters and the ability to map the theoretical relationships between them.
However, both Mandelker & Rhee (1984) and the authors of recent works (Dugan et al., 2018; Pawar et al., 2019) obtained, as a result of the DFL, estimations greater than the DOL, for a DOL close to 1 or even less than 1, which suggests that almost 100% of sales are above QBEP and, as we mentioned earlier, proves the poor quality of estimation of these parameters and the loss of their essence. As is apparent from the properties of formula (12) and Figure 3, it follows that lower but positive DOLs occur with smaller differences between the DOL and the DFL (both parameters move to 1), and with estimation errors it is easier to obtain DFL > DOL, which the authors treated as confirmation of the trade-off hypothesis.
3.3. What does the costs to assets ratio say about a company?
The second measure of operating leverage that has been popular in research is the costs-to-assets ratio, proposed by Novy-Marx (2011). It measures operating leverage as the annual operating costs divided by the assets, where the operating costs are the cost of goods sold (COGS) plus selling, general, and administrative expenses (XSGA). It has also been used by other researchers in recent years (Table 6). Therefore, we need to consider which characteristics and properties of companies are reflected in this measure and to what extent they are consistent with the measure discussed earlier (DOL). To this end, we will refer to the Du Pont model:
\[\begin{equation} \label{eq24} \small \frac{EBIT}{Assets} = \frac{EBIT}{S} \cdot \frac{S}{Assets} \ \ \ \ \ (24) \end{equation}\]where EBIT/Assets – return on assets (ROA), EBIT/S – return on sales and S/Assets – asset productivity.
However, S = Costs + EBIT, so:
\[\begin{equation} \label{eq25} \small \frac{EBIT}{Assets} = \frac{EBIT}{S} \cdot \frac{EBIT + Costs}{Assets} \ \ \ \ \ (25) \end{equation}\]From this, we can see (formula 25) that this measure is strongly linked to asset productivity. Therefore, the costs-to-assets ratio will be greater the greater the asset productivity. What can be observed when, for example, due to high demand for products, the company starts to produce in two shifts is that the value of assets will remain the same and the sales may double, which will double the productivity of the assets. However, because of this, the costs of products sold will also increase (due to an increase in variable costs) and the ratio of costs to assets will increase. High asset productivity is a characteristic of enterprises with low returns on sales, which compensate for them with high productivity of assets. These are companies with a low processing depth of the subjects of labour and low production of value added, which do not need large amounts of production assets. Companies that shallow process a subject of labour usually have high variable costs because they are relatively expensive components and subassemblies, and, without the need for deep processing, the fixed costs determined by production assets are low.
In turn, Chen et al. (2019), in their research, modified Novy-Marx's (2011) measure using only XSGA. They turned off the COGS due to its strong relationship with sales, which they thought raised concerns about the endogeneity of the measure. This approach was also used by Jiao et al. (2019) as one of the three. The DOL, previously discussed, was strongly related to sales. Which features and properties does this measure approximate? The authors themselves admitted that it is intuitive. The relationship between XSGA and assets depends on many factors, such as multi-planting, the distribution method, the territorial scope of activity, the sector, and so on. Therefore, it is difficult to find homogeneous features that will characterize companies classified on the basis of this measure. In turn, Kumar & Yerramilli (2018) measured operating leverage as the ratio of the fixed operating costs to the company value. The company value fluctuates, so the value of this ratio will change over time without significant changes in the specifics of the company’s costs. In addition, the company value is determined by the total risk – including the financial risk. Consequently, operating leverage measured in this way will also reflect the effects of the capital structure, which is reserved for financial leverage. A similar approach is used by Schueler (2018), who, to eliminate the impact of financial risk, measures operating leverage as the relationship of fixed costs to unlevered company value.
This does not change the controversy of the use of the fixed costs-to-assets ratio as an approximation of operating leverage as they can be both low capital-intensive (consulting, commercial, and service) and highly capital-intensive companies. On the one hand, Taussig (2017) assumed that the cost elasticity is determined by the employment costs and used the ratio of employee expenses to total assets to approximate operating leverage. This measure favours consulting, service, and commercial companies. Donangelo (2021), on the other hand, used the ratio of labour expenses to value added, which favours companies with a low capital–labour ratio.
3.4. What do other measures of operating leverage say about a company?
Another approach to approximating operating leverage is to refer to textbook definitions of its measurement as a fixed-to-variable cost ratio. Aboody et al. (2018) estimated it using time series regressions of costs on revenue. This approach, like the DOL, depends on sales and thus does not represent a permanent feature of the company. Grau & Reig (2021) and Pepelasisa et al. (2020), in turn, used fixed assets over total assets, assuming that this relationship approximates the fixed-to-variable cost relationship, which is difficult to find in financial statements. However, while fixed costs are determined by fixed assets, variable costs are not necessarily determined by current assets. The value of current assets depends on many factors, including, for example, the industry – a gas-fired power plant will have no stocks and a coal-fired power plant will already have some, the trade credit practices – a small company with a weak position will grant long trade credit and a company with a strong position short trade credit, inventory management – a company using the just-in-time method will have very little inventory and a company that fails to do so will have much larger inventory, and cash management. Chu et al. (2020 approximated operating leverage by measuring operating risk. They measured the variability in accounting earnings, computed as the standard deviation of accounting returns on total assets over the last five years. However, operating risk is the result of the sector-specific market risk and the risk of operating leverage (Mitra et al., 2015). Therefore, this measure does not allow for the extraction of the risk of operating leverage and thus also for the estimation of operating leverage. The measure of operating leverage that differed most from those presented in textbooks was used by Donangelo et al. (2019). They estimated operating leverage as the ratio between the elasticity of operating profit to total factor productivity (TFP) and the elasticity of value added to TFP minus one. They called their measure labour leverage because they assumed that only labour leads to operating leverage. However, they believed that their measure is conceptually consistent with the DOL.
4. Discussion
Although operating leverage has sometimes been the subject of research (dependent variable), in the vast majority of publications, it has been used to explain other phenomena (explanatory variable). It has most often been used to explain profitability, value, and risk, and the articles in which it has been used have been published in a wide range of accounting and financial journals, including those that are leading in these fields. However, as we can see, the 53 articles from 2017 to 2021 analysed, which covered issues related to operating leverage, used 16 different approaches to measuring it. A common feature of these approaches was a reference to fixed costs. However, the diversity of both the methods of reference and the parameters to which fixed costs are referenced caused, in extreme cases, these measures to have almost nothing in common. Either they approximate different company characteristics or they are so unspecific that they are unable to create a homogeneous sample according to a specific feature. This was confirmed by, among others, the results obtained by Jiao et al. (2019), who used three measures to estimate operating leverage and obtained diametrically different explanatory forces of these measures in terms of both direction and statistical significance. This indicates that these measures approximated the various characteristics of the companies. A high DOL means a small surplus of sales above the break-even point, which may signal a poor situation of the company, while a high value of the costs-to-assets ratio estimates high productivity of assets, which is related to a good situation of the company.
Some authors have used measures dependent on the level of sales (DOL, quasi-fixed costs to sales, and fixed costs to variable costs), and others have recognised the advantage of the measure in independence from sales and chosen it from those that are independent of sales. Reducing operating leverage to only labour costs means that both service companies with very low fixed-asset involvement and companies that are highly capital intensive, for example energy companies, will have high operating leverage, although it is difficult to compare the inflexibility of employment costs, which can be extinguished in a relatively short time, with the inflexibility of the cost maintenance of production assets. Despite such different approaches to measuring leverage, the authors of publications have placed them in one stream of research on operating leverage and compared the results of this research. It cannot be said that there has been no agreement among the authors regarding the essence of leverage because its definiendum is so vague that any phenomenon or mechanism inserted into it is difficult to verify. What is the operating leverage definiendum? The trade-off between costs or maybe profit sensitivity or cost inflexibility? Many authors have believed that these phenomena are interrelated, which would be the case if the range identity with the definiens occurred, whereas a vague and imprecise definiens does not provide this. Profit sensitivity is due to many factors and can be measured differently. The inflexibility of costs can relate to various parameters. Without the decisive criteria that a definition should provide, it is not possible to ascertain which factors determining sensitivity or inflexibility reflect the essence of operational leverage. In connection with the above, the next section presents a proposal to organize and clarify operating leverage as a lever raising the value added and a company’s profit at a given output level.
5. Operating leverage as a trade-off between fixed and variable costs: A proposal to organize and clarify the operating leverage concept
5.1. Trade-off
A trade-off between fixed and variable costs as the essence of the strategic choice of operating leverage has been suggested only in a few textbooks and articles. Explicitly, this was stated by Ross et al. (2010) and in a slightly different sense by Brigham & Houston (2019). In turn, Vernimmen et al. (2009) suggested that a trade-off between costs is difficult to implement in an enterprise and proposed actions that do not coincide with the essence of the trade-off presented by Ross et al. (2010). In articles, a trade-off was implicitly suggested by Lord (1995); however, he did not develop the trade-off theory but showed that the DOL is not a good measure of changes in costs. In recent years, the trade-off has been described by Guo & Zhou (2018), but they referred to decisions related to the disaggregation of production on subsidiaries and the different impact of disaggregation on the costs of the parent company depending on the method of consolidation of financial statements. However, the operating leverage measurement methods presented in the literature (Tables 1 and 6) are not suitable for the precise measurement of both changes and consequences of the trade-off between variable and fixed costs. To conceptualize the trade-off theory of operating leverage and make it a more useful tool for both management and research, we suggest specifying how to measure the cost structure to determine the ratio of fixed costs (FC) to total costs at the break-even point (TCBEP). This brings positive effects for this concept, such as permanent characteristics of the company’s properties independent of changes in sales, which are the result of specific strategic decisions. It also clearly places operating leverage as a strategic management tool.
The measure of operating leverage (OL) in this approach is:
\[\begin{equation} \label{eq26} \small OL = \ \frac{FC}{TC_{BEP}} \ \ \ \ \ (26) \end{equation}\]but:
\[\begin{equation} \ \ \ \ \ (27) \label{eq27} \small OL = \frac{FC}{Q_{BEP} \cdot vc + FC} \end{equation}\]Inserting \(Q_{BEP} = \frac{FC}{p - vc}\), we obtain:
\[\begin{equation} \label{eq28} \small OL = \frac{FC}{\frac{FC}{p - vc}vc + FC} = \frac{FC}{FC\left( \frac{vc}{p - vc} + 1 \right)} = \frac{1}{\frac{p}{p - vc}} \ \ \ \ \ (28) \end{equation}\]Inserting m = p-vc, we finally obtain:
\[\begin{equation} \label{eq29} \small OL = \frac{m}{p} \ \ \ \ \ (29) \end{equation}\]Of course, OL is also equally \(OL = \frac{M}{S};\ OL = \frac{S - VC}{S}; \ OL = 1 - \frac{vc}{S}\).
As we can see, the share of fixed costs in the total costs measured at the break-even point will change only when the price or unit variable cost (or both) changes. If we assume that the price changes only when the value offered to customers changes, and the change in unit variable costs results not from market changes in the prices of subjects of labour but from changes in the method of production, then the trade-off theory of operating leverage consists of strategic choices in the production way. When creating a company strategy, management boards have to decide which production operations they will carry out on their own and which they will outsource. The more production operations they carry out themselves, the greater the investment in production assets and the greater the employment, which generates fixed costs. However, these assets allow for the deep processing of subjects of labour, so the variable costs will be low-processed raw materials, materials, and other components with a relatively low price, so the unit variable costs will be low. However, if the company subcontracts most of the production operations to subcontractors, then the investments in production assets and thus the fixed costs will be lower. On the other hand, the variable costs will be relatively high because they will be not for materials and raw materials with a low degree of processing but for ready-made elements with a high unit price. In this approach, high operating leverage is a proxy for a company’s ability to process the input components and thus create high added value. This, of course, allows the company to realize a high contribution margin. In this approach, the operating leverage is a lever that allows a company to increase its value added and profit with a given output.
This measurement of operating leverage is also resistant to interference. Investments made in the company that do not affect the change in the production method and, for example, only increase the production capacity will only increase the fixed costs and affect the break-even point and will not change the cost structure in QBEP. This is shown by the example in Table 7. In this approach, therefore, this type of investment has an impact on the fixed costs but does not change the operating leverage (OL).
Table 7. The consequences of an increase in fixed costs without a change in variable costs
| Parameters | Before investment | After investment |
|---|---|---|
| Fixed costs (FC) | $3,000,000 | $3,200,000 |
| Sold units (Q) | 80,000 units | 80,000 units |
| Sales price per unit (p) | 150 $/unit | 150 $/unit |
| Variable cost per unit (vc) | 100 $/unit | 100 $/unit |
| Break-even point (BEP) | 60,000 units | 64,000 units |
| Total cost in BEP (TC BEP) | $9,000,000 | $9,600,000 |
| Contribution margin per unit (m) | 50 $/unit | 50 $/unit |
| OL = FC/TC BEP | 0.33 | 0.33 |
| m/p | 0.33 | 0.33 |
| DOL | 4 | 5 |
5.2. Operating leverage and risk
There is also a risk associated with such operating leverage. Its image appears as follows. If, as previously shown, the measure of operating leverage is the contribution margin ratio (formula 29), then, by transforming
\[\begin{equation} \label{eq30} \small OL = \frac{\Delta Qm}{\Delta Qp} = \frac{Q_{1}m - Q_{0}m}{Q_{1}p - Q_{0}p} = \frac{\left( Q_{1}m - FC \right) - \left( Q_{0}m - FC \right)}{Q_{1}p - Q_{0}p} \ \ \ \ \ (30) \end{equation}\]we obtain
\[\begin{equation} \label{eq31} \small OL = \frac{\Delta EBIT}{\Delta S} \ \ \ \ \ (31) \end{equation}\]We obtain the sensitivity of the change in EBIT to the change in sales (S) in absolute terms. This risk measure has a significant advantage over sensitivity measured as a percentage using the DOL. First, it shows how much the amount of profit and approximately the cash flow will change with a sales increase of a certain amount. This has great practical utility because it indicates, for example, the nominal effects on the profit and cash flow that each order received or lost has. Second, it is a permanent characteristic of the company regardless of the current level of sales and profit, so it has considerable utility in budgeting. The advantage of the OL over the DOL in measuring risk is presented in a simple example in Table 8. It shows the effects of the decision to perform an additional production operation, which was previously subcontracted to cooperating parties, for example galvanizing. The effect of this decision is a trade-off, that is, a change in the variable costs (electroplating service), by reducing the unit variable cost into the fixed costs (generated by the new galvanizing department). In this example, we see that the effects of this decision in this particular case did not cause a change in the DOL and therefore also the risks that this parameter forecasts. Meanwhile, the OL showed an increase in operating leverage, a positive impact on profit, and effects on risk when the sales fall.
Table 8. Thetrade-off of costconsequencesforearning and risk
| Parameters | Before trade-off | After trade-off |
|---|---|---|
| Fixed costs (FC) | $3,000,000 | $3,600,000 |
| Sold units (Q) | 70,000 units | 70,000 units |
| Sales price per unit (p) | 150 $/unit | 150 $/unit |
| Sales revenue (S) | $10,500,000 | $10,500,000 |
| Variable cost per unit (vc) | 100$/unit | 90 $/unit |
| Break-even point (Q BEP) | 60,000 units | 60,000 units |
| Total cost in QBEP (TC BEP) | $9,000,000 | $9,000,000 |
| EBIT | $500,000 | $600,000 |
| OL (FC/TC BEP) | 0.33 | 0.40 |
| Contribution margin ratio per unit (m/p) | 0.33 | 0.40 |
| DOL | 7.0 | 7.0 |
| In the event that sales fall by 10% or $1,050,000, the DOL will not show the difference in risk, while the OL will show that, after a trade-off, the absolute profit decrease will be greater. | ||
| Sold units (Q) | 63,000 units | 63,000 units |
| Sales revenue (S) | $9,450,000 | $9,450,000 |
| EBIT | $150,000 | $180,000 |
| Δ EBIT | $-350 | $-420 |
| %ΔEBIT | -70% | -70% |
| DOL | 21.0 | 21.0 |
Of course, formula (31) states that and. \(\Delta EBIT = \frac{FC}{TC_{BEP} \Delta S} \ \ and \ \ \Delta EBIT = \frac{M}{S} \Delta S\)
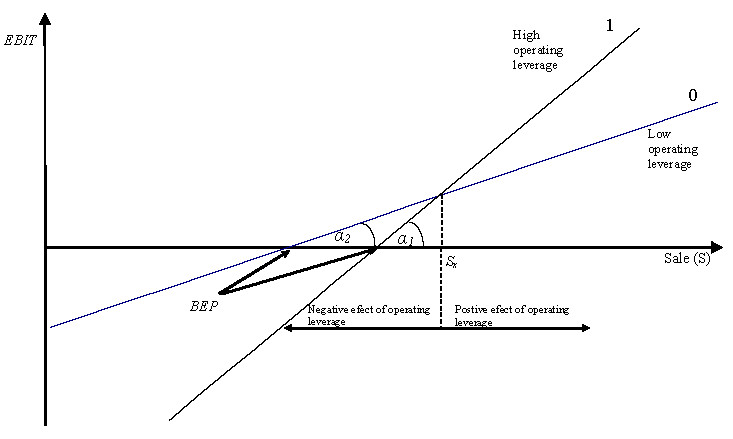
The increase in leverage provides a chance for higher profits but also imposes a risk of greater loss. As we can see in Figure 4, the increase in operating leverage allows for higher profits only when the sales are greater than the border sales Sx (S > Sx). In this case, there is a positive effect of operating leverage. When S < Sx, there is a negative effect. Sx is determined in the following way:
Figure 4. Operating leverage effect
Sx is the level of sales at which
\[\begin{equation} \label{eq32} \small EBIT_{1} = EBIT_{0} \ \ \ \ \ (32) \end{equation}\]Therefore, \(S_{x}\left( \frac{m}{p} \right)_{1} - FC_{1} = S_{x}\left( \frac{m}{p} \right)_{0} - FC_{0}\) and next \(S_{x}\left\lbrack \left( \frac{m}{p} \right)_{1} - \left( \frac{m}{p} \right)_{0} \right\rbrack = FC_{1} - FC_{0}\).
We finally obtain:
\[\begin{equation} \label{eq33} \small S_{x} = \frac{\Delta FC}{\Delta \frac{m}{p}} \ \ \ \ \ (33) \end{equation}\]SX is the border sales that the company must exceed for the increase in operating leverage to increase the profit.
6. Conclusions
Researchers around the world who are in pursuit of publication productivity are looking for attractive and worthwhile research topics and are developing new and more advanced research methods to make their research more attractive and thus increase the likelihood of publication in a reputable scientific journal. Operating leverage is one of the more popular research strands in the area of accounting and finance. It has been both the subject of research and the explanatory variable. However, the concept and essence of operating leverage have been very vague and imprecise in academic textbooks for many years, and this situation is reflected in scientific publications. The authors of both textbooks and scientific publications understand the essence of leverage in a weakly consistent way, which translates into freedom in constructing tools for its measurement. Operating leverage has thus become a fuzzy and indeterminate parameter. It is not possible to compile a homogeneous sample of companies classified on the basis of different definition approaches and measurement methods according to a specific feature or property. For this reason, the research results are difficult to synthesize and have little theory-forming utility. The quality of studies, their comparability and repeatability, and finally the functionality of the synthesis and theory building depend on the correctly defined indicatum representing specific phenomena and features that we want to study or use as explanatory variables. In turn, between the indicatum and the observable indicator, there should be a statistical empirical relationship or one without exceptions. Therefore, the article organizes and proposes to clarify the concept of operating leverage as a lever, which allows a company to increase its value added and profit with a certain level of output by using a trade-off between variable and fixed costs. The measure of leverage understood in this way is the share of fixed costs in total costs measured at the break-even point.
7. Future research and proposition the guidance on how best to incorporate the concept of operating leverage into empirical research
The specification of the essence of the operating leverage and the method of its measurement proposed in the article make the concept of operating leverage a tool for strategic management. Contrary to commonly applicable measures (especially the DOL), it is a characteristic of an enterprise independent of the current level of sales or profit. It reflects the company’s potential ability to generate added value as a result of the possibility of the deep processing of input components. This ability is determined by both productive assets and competences. The operating lever therefore creates a space for intellectual capital and should thus be used in research on it. The proposed leverage concept is also a source of risk. However, its essence is not the sensitivity of the change in profit to changes in sales in percentage terms (such as in the DOL) but that in absolute terms, which will be revealed in statistical dispersion measures (variance, standard deviation, etc.). The operating leverage increases the volatility of the operating profit in relation to the volatility of sales and is, next to the volatility of sales (market risk), a factor determining the operating risk. For this reason, it can be used in research on operational risk and its impact on many aspects of the functioning of enterprises, such as the debt structure, survival rate, and so on.
For research purposes, operating leverage (OL) can be estimated, as in previous studies (García-Feijóo & Jorgensen, 2010), using two approaches: (1) a time series regression approach and (2) a point-to-point approach. In time series regression, the cost of revenue regression model can be used (Kalinowski, 2017):
\[\begin{equation*} \label{eq35} \small TC_{it}\left( S_{it} \right) = FC_{i} + vc_{i}S_{it} + \varepsilon \end{equation*}\]where TCit – theoretical total cost of operating company i at time t,
FCi – theoretical total fixed cost of company i,
Sit – sales revenues of company i at time t,
vci – theoretical variable cost per unit per $1 revenue in company i,
\(\varepsilon\) – random error.
Then, the operating leverage can be estimated according to the formula
\[\begin{equation*} \label{eq36} \small OL_{i} = 1 - vc_{i} \end{equation*}\]This approach is limited by the need to have information about enterprises from many periods. When we have monthly or quarterly information, since observations from several years, we can build a sample that allows us to obtain a satisfactory statistical significance of the model. However, when we only have annual information, it is practically impossible to apply the above approach as it requires over a dozen years of observations, during which the changes taking place in the enterprise may be so large that the estimates obtained will have low predictive power. It may also result in a time discrepancy between parameters when OL is estimated on the basis of long-term observations and other parameters are estimated on the basis of individual periods.
In the point-to-point approach, we estimate OL based on absolute changes in profit and sales in accordance with formula (31).
In both approaches, we will increase the quality of the estimates by eliminating the impact on EBIT and sales of any random and discontinuous operations as well as those not related to the primary activity of the business. In both approaches, we should use operating revenue and EBIT as the difference between operating revenue and primary activity expenses.