Back to goodwill amortisation and the financial performance of public and private firms in Spain
ABSTRACT
We take advantage of the change in goodwill regulation in Spain after 2016, to contribute with a comprehensive analysis of a scenario barely studied in the recent literature: the inverse transition from goodwill impairment to the systematic amortisation of goodwill. Using a database with the individual financial statements of all Spanish non-financial firms, both listed and non-listed, with positive goodwill on balance, we contribute in two instances. On the one hand, we seek to obtain evidence of whether managers behaved opportunistically during the impairment regulation period using a test of the determinants of goodwill impairment recognition. On the other hand, through a differences-in-differences approach against a sample of 4,000 control firms, we test the differential impact of the change in regulation on the return on assets of those firms with goodwill in their balances. Our results are in line with extant research suggesting that the systematic amortisation of goodwill paired with a periodic impairment test limits earnings management practices and help investors assess the economic performance of a firm.
Keywords: Goodwill impairment; Goodwill amortisation; IFRS 3; IAS 36; SFAS 142; Excessive optimism.
JEL classification: M41; G32.
La vuelta a la amortización del fondo de comercio y la rentabilidad financiera de las empresas públicas y privadas en España
RESUMEN
Aprovechamos el cambio en la regulación del fondo de comercio en España a partir de 2016, para analizar un escenario escasamente estudiado en la literatura reciente: la transición inversa del deterioro del fondo de comercio a la amortización sistemática del mismo. Construyendo una base de datos a partir de los estados financieros individuales de todas las empresas no financieras españolas, cotizadas y no cotizadas, con fondo de comercio positivo en balance, contribuimos a la literatura en dos instancias. Por un lado, tratamos de obtener evidencia de si los gestores se comportaron de forma oportunista durante el periodo de regulación del deterioro mediante un test de los determinantes del reconocimiento del deterioro del fondo de comercio. Por otro lado, mediante un enfoque de diferencias en diferencias frente a una muestra de 4.000 empresas de control, comprobamos el impacto diferencial del cambio en la regulación sobre la rentabilidad de los activos de aquellas empresas con fondo de comercio en sus balances. Nuestros resultados concuerdan con las investigaciones existentes, que sugieren que la amortización sistemática del fondo de comercio, junto con una prueba periódica de deterioro, limitan las prácticas de gestión de beneficios y ayudan a los inversores a evaluar los resultados económicos de una empresa.
Palabras clave: Deterioro del fondo de comercio; Amortización del fondo de comercio; NIIF 3; NIC 36; SFAS 142; Optimismo excesivo.
Códigos JEL: M41; G32.
1. Introduction
The debate on goodwill amortisation versus goodwill impairment has been constant over the last two decades, following the frequent regulatory changes in both the FASB and IASB spheres. American SFAS 142 was the first to eliminate, in 2001, the systematic amortisation of goodwill, replacing it with periodic impairment tests. The generalization of impairment tests followed through, based on the premise that goodwill does not systematically lose value over time (Carvalho et al., 2016). In 2004, the IFRS/IASB issued IFRS 3 Business Combinations and related amended versions of IAS 36 Impairment of assets, regulating the implementation of impairment tests on assets, including goodwill.
Since then, most academic literature has studied the introduction of impairment tests (e.g., André et al., 2015; Cheng et al., 2018; Pallarés-Sanchidrián et al., 2021). However, the debate lingers. In the past 8 years, about one hundred empirical goodwill impairment studies were published in leading accounting journals. The literature review by Amel-Zadeh et al. (2023) finds that goodwill impairment recognition is often driven by managerial incentives, but there is no agreement on how much of a problem this is. Validity problems in goodwill accounting research hinder the analysis, and so the authors suggest several avenues for future research. These include taking the opportunity to analyse the implementation of new regulations, and using econometric remedies for internal validity issues, such as a difference-in-differences design to obtain some estimate of the counterfactual.
In 2012, the IASB expressed concern about how impairment tests were applied. Later, Directive 2013/34 of the European Union set that goodwill will be systematically amortised, unless the IAS/IFRS are required or chosen to issue the annual accounts of a company. Particularly in Spain, where this study is focused, the 2008 reform of the General Accounting Plan applied goodwill impairment tests, but after 2016, with the transposition of the European Directive, the systematic amortisation of goodwill linearly over 10 years (unless a different useful life is justified) is again required.1 The transition from impairment to amortisation regulations included a transitional provision that allowed firms, only in 2016, to amortise goodwill against reserves on a straight-line basis over 10 years from the date of recognition of goodwill.2
This new change in regulation, now being an inverse transition from goodwill impairment to the systematic amortisation of goodwill, offers academics and authorities the opportunity to observe the impact on goodwill figures and the market performance of these firms. However, the literature in Spain continues to focus on the former transition, usually making use of the most accessible information from the consolidated reports of listed firms. Thus, Blasco et al. (2021) analyse the main determinants of goodwill impairment in consolidated reports by Spanish-listed firms, while Cavero et al. (2021) analyse differences in goodwill figures from 2004 to 2011 to show that firms were likely to maintain higher amounts of goodwill and not recognise any impairment losses, with ROA and ROE measures being higher in consequence. Elsewhere, the most recent articles focus on the effectiveness of fair value accounting for goodwill impairment (Ayres et al., 2019; Carcello et al., 2020; Gietzmann & Wang, 2020; Kabir et al., 2020; Durocher & Georgiou, 2022).
The motivation of our article is to analyse this new "turn-around" requiring again the systematic amortisation of goodwill. To such purpose, we use the two methodologies in most studies on goodwill: these often focus on listed firms to either analyse the timeliness of goodwill impairments and their impact on market prices (e.g. Li & Sloan, 2017; Knauer & Wöhrmann, 2016) or the determinants of goodwill recognition (e.g. Gunn et al., 2018; Glaum et al., 2013) – since there is no consensus about which of the two methodologies is the best option (Cavero et al., 2021). However, an analysis restricted to listed companies in Spain reveals to be statistically unsound (see Ruiz & Peón, 2021), due to the limited number of listed firms in Spain that exhibited positive goodwill measures in the balances of their individual financial statements. Consequently, here we provide an estimate of the impairment reported by all Spanish companies, both public and private, in their individual accounts – information that is only accessible in the Notes to the financial statements and, in the case of unlisted firms, is only available at the Mercantile Registry. However, using unlisted companies has an additional handicap: we must replace the analysis of the impact of goodwill figures on market prices by a proxy.
Following the above, we contribute with a comprehensive analysis in two instances. First, after a descriptive analysis to observe whether the return to goodwill amortisation led to a reduction in its aggregate value across companies, we analyse the determinants of goodwill impairment recognition by the Spanish firms before 2016. Is there evidence that managers were acting opportunistically before 2016, taking advantage of accounting discretion for impairment recognition? Did they anticipate the impact of the forthcoming regulation to smooth the effect of goodwill amortisation in future years?
Second, since the reduced number of listed firms in Spain with positive goodwill in their individual reports prevents from testing market prices, we test the impact of the change in regulation on corporate results as a proxy. Can we trace evidence that firms with goodwill on their balances show better financial results under one regulation or another? To this purpose, we will compare different estimates of the return on assets, to isolate the impacts of goodwill regulation on both the balance sheet and the income statement.
In a context where regulators remain hesitant and the academic literature maintains open lines of debate, our work offers several strengths. Thus, being one of the first papers to analyse the recent transition from goodwill impairment to goodwill amortisation in some areas, we provide a comprehensive methodological approach, including the determinants of goodwill impairment recognition and the impact on corporate results. Moreover, the results are validated both in terms of the different databases used (listed and unlisted companies, companies with goodwill vs. control groups) and robustness tests performed. However, there is room for improvement: our research analyses a single country as a case study, so future research should test these results in other circumstances.
The structure of the article is as follows. In Section 2, prior academic research is discussed to provide a set of testable hypotheses for our research. Section 3 describes the research design for each hypothesis to be tested. In the fourth Section, data and sample selection are described. The empirical results are discussed in Section 5, in three separate parts: the overall impact on goodwill of the alternative accounting methods, the determinants of impairment before the recent change in regulation in Spain, and the impact of that change on corporate results. Finally, Section 6 provides a set of conclusions. Additional statistical information and robustness test results are provided in the Supplementary Material (SM).
2. Hypothesis development
2.1. Determinants of impairment
The literature on the determinants of goodwill impairment focuses on any regulation that allows firms to recognize losses in their annual reports due to asset impairments, to identify the corporate and environmental factors that lead to such recognition. Following Gunn et al. (2018), there are two competing views on how firms use this discretion. The first view posits that firms record impairments following a conservative reporting strategy. This is related to the literature on the conservative bias in behavioural finance.3 The second view argues that firms use their discretion to report opportunistically by delaying the recording of bad news. Whether firms report conservatively or opportunistically depends on manager incentives and is likely to vary across business cycles (Ryan, 2006). Indeed, conservatism can be costly as it reduces earnings and book values, increases the likelihood of bankruptcy, and reduces the incentives towards acquisitions (Zhang, 2008; Francis & Martin, 2010). If these costs are relevant, firms may opt to act opportunistically by delaying the recording of impairment in the hope of better news or eventually performing a “big bath” charge. Some classic results follow. Lawrence et al. (2013) observe larger impairment when book-to-market ratios are greater than one, in line with the conservatism assumption. André et al. (2015) find a reduced conditional conservatism after IFRS adoption, although this effect was lower in countries with high-quality auditing and strong enforcement regimes. Finally, conservatism is found to be persistent after events such as debt initiation, seasoned equity offerings, and covenant violations (Beatty et al., 2008; Kim et al., 2013; Tan, 2013).
Beyond that debate, the literature is extensive but inconclusive (Carvalho et al., 2016), led by subjectivity in data collection, the use of different periods and samples in different jurisdictions. Furthermore, estimating fair values is a highly subjective process because these assets are generally not traded and are very illiquid (Gunn et al., 2018). Recent research provides further evidence about the role of corporate governance (Kabir & Rahman,2016), managerial efficiency (Li, 2016), CEO incentives and monitoring (Glaum et al., 2018; Filip et al., 2021), institutional factors (Huikku et al., 2017; Cerqueira & Pereira, 2020), auditor competencies (Stein, 2019), and ownership (Ahn et al., 2020) on impairment reporting.
We aim to contribute to this literature by testing the opportunistic behaviour of managers during the impairment test regulation, being aware of the upcoming change in 2016 to the systematic amortisation regulation. First, using different measures of financial reporting conservatism, we will test the following hypothesis:
H1a: Conservative reporting policies are associated with higher goodwill impairment.
In addition, we pose two further hypotheses about potential opportunistic behaviour by managers that we might anticipate. On one hand, the size of asset writedowns is often associated with the firm's capacity to absorb the financial statement effects of the write-down (Cotter et al., 1998). Thus, we may anticipate that firms will recognise goodwill impairment more easily the more residual this asset is on their balance sheets. Consequently, we will test the next hypothesis:
H1b: Lower relative weights of goodwill compared to total assets are associated with higher goodwill impairment.
On the other hand, the literature on earnings manipulation shows that managers often take advantage of the introduction of fair value accounting rules to make opportunistic impairments (Lhaopadchan, 2010). Hence, we want to test whether managers anticipated the impact of the upcoming regulation to smooth the effect of goodwill amortisation in future years. In such case, a “big bath” effect would follow right before 2016, during the fair value accounting regulation period and before the new regulation imposing systematic amortisation would come into force. Hence, we will test a third hypothesis:
H1c: There is a positive impact over goodwill impairment associated with the year 2015.
Managers would anticipate the regulatory change to smooth goodwill amortisation in future periods, implicitly recognising the delayed impairment in previous years.
2.2. The impact of changes in regulation on corporate results
The literature on the consequences of financial reporting focuses either on the impact of corporate results or on stock market reaction. The literature on stock market reaction analyses whether goodwill figures and impairment recognition by listed firms provide useful information to investors and whether this information is properly recognized in stock prices. Most of these studies find a delayed recognition of goodwill impairment, with investors being unable to fully discount the effect of overstated goodwill figures (e.g., Knauer & Wöhrmann, 2016; Li & Sloan, 2017). Schatt et al. (2016) provide a summary of the academic literature in the field.
In our case, working with a database of mostly private firms, we focus on the literature on the impact over corporate results. This is a catch-all for evidence of changes in regulation on goodwill recognition or impairment affecting some sectors or regions more than others, or a differential impact on financial statements, innovation, corporate social responsibility, and others. As in the literature on the determinants of impairment, there is a debate about the positive and negative effects of impairment recognition. On the one hand, Li & Sloan (2017) find that the new GAAP standard (SFAS 142) resulted in relatively inflated goodwill balances and untimely impairment, and Filip et al. (2015) find that managerial manipulation to avoid impairment losses is detrimental to firms’ future performance. Lev (2018) considers this to be evidence of the deteriorating usefulness of financial report information. On the other hand, Cheng et al. (2018) find that managers will acquire more information to comply with SFAS 142, improving firms’ internal information environment and leading to higher forecast accuracy, M&A quality, capital allocation efficiency, and performance. Finally, other authors have focused on the impact of goodwill impairment on the cost of capital of firms (Mazzi et al., 2017), differences between US and European firms regarding impairment recognition (André et al., 2016), the identification and assessment of intangible assets arising from commercialization of innovations (Labunska et al., 2017), and how ethical managerial decisions on goodwill impairment are (Giner & Pardo, 2015).
We aim to analyse the inverse transition from impairment regulation to goodwill amortisation (after 2016) in Spain, and how this change in regulation impacted business performance. In this branch of the literature, it is common the analysis of the impact of goodwill impairment on stock prices, in two steps (Li & Sloan, 2017): first, to trace whether a relationship between impairment figures and market or accounting measures exists, and second, whether share price declines are associated with delayed recognition of asset impairment. Here we deal with both public and private firms, so the analysis is restricted to the impact on accounting measures. Hence, we test a negative impact on corporate results of the accounting discretion granted by the impairment regulation, under the last hypothesis:
H2: The ratio of earnings over assets of treatment firms increased relative to control firms after the adoption of the amortisation method in the year 2016.
This way, we are testing that impairment tests lead to inflated goodwill measures. However, the amortisation method has a direct impact as well on accounting figures: over 10 years, firms will report a systematic depreciation of goodwill, which reduces earnings. Consequently, the research design described below will provide three different measures for the ratio of earnings over assets, to isolate both effects on the balance sheet and the income statement.4
3. Research design
3.1. Determinants of impairment
To test hypotheses H1a, H1b and H1c on the determinants of impairment before the introduction of the amortisation method, we perform a panel data regression to incorporate both the cross-section and over time impact of impairment decisions. The dependent variable is IMP_GW, the ratio of the goodwill impairment recognized in period t over the initial goodwill balance (the figure in the balance sheet at the end of year t-1).
Our test variables are different measures of conservatism, and the two measures were devised to test for managerial opportunistic behaviour. Following Givoly & Hayn (2000), a measure of reporting conservatism is the extent to which earnings include negative non-operating accruals. Non-operating accruals equal total accruals (net income plus depreciation minus operating cash flows) less operating accruals (those arising from the basic business of the firm, obtained in the cash flow statement as changes in inventories, accounts receivable and prepaid expenses less changes in accounts payable and taxes payable). This measure summarizes loss and bad debt provisions, restructuring charges and impairment, primarily, and its timing or amount is subject to some managerial discretion. Based on this, we estimate two different measures of conservatism. CONSV is the ratio of earnings (measured as EBITDA) over non-operating accruals, winsorised at +100 and -100, and standardised across the sample to have zero mean and one standard deviation.5 This proxy compares earnings and non-operating accruals, in such a way that the greater the ratio the more conservative the reporting strategy. A second proxy, CONSV2, multiplies non-operating accruals by -1 (to make the proxy increasing in accounting conservatism) and divides it over total assets. The proxy is winsorised and standardised likewise CONSV.
A third proxy for conservatism uses an alternative specification, following Gunn et al. (2018). CONSV_SKEW is calculated as the difference between the skewness of operating cash flows and the skewness of net income, standardized across the sample. Larger values imply greater conservatism because earnings will be negatively skewed relative to cash flows when bad news is recognized in earnings more quickly than good news. This proxy is constant throughout the sample; hence, the fixed effects estimator is not useful, as it uses data variation over time. When the Hausman test suggests that random effects estimation is neither a valid alternative, we will use the HT estimation method by Hausman & Taylor (1981), which combines the fixed effects estimation with an instrumental variables (IV) estimation for the time-invariant regressors that are correlated with the individual effects.
Hypotheses H1b and H1c test the opportunistic behaviour of managers in two instances. GW_A is the ratio of the goodwill balance in period t over the beginning-of-period total assets (i.e., its balance in year t-1). This measure is quite common in the literature (e.g., Chung & Hribar, 2021), accounting for the importance of goodwill in the balances of the treatment firms, with the interpretation that managers will be less reluctant to recognise the impairment if goodwill is marginal. Finally, we introduce annual dummies in the model to observe the relative impact of the year 2015.
The list of control variables follows in order. Khan & Watts (2009) document two control variables associated with conditional conservatism by non-listed firms. On the one hand, firm size (SIZE) – calculated as the natural logarithm of total assets at the end of the fiscal year – may be positively related to goodwill impairment if larger firms have a higher litigation demand for conservatism or negatively associated if they have less information asymmetry and a lower contracting demand for conservatism (Gunn et al., 2018). On the other hand, leverage (LEVER) – the ratio of the firm’s debt to the book value of equity at the end of the fiscal year – is presumed to have a negative impact: since leveraged firms assume more risk, they will be more reluctant to recognize additional losses.
Moreover, the effects of previous accounting decisions accumulate in the balance sheet and constrain managers’ opportunistic behaviour. Following Barton & Simko (2002), we include the net operating assets relative to sales (NOA), measured as shareholders’ equity less cash and marketable securities plus total debt, over sales. We expect a positive relationship, since greater NOA reduces managers’ ability to delay impairment. To control for performance, we introduce two variables. First, the return on assets (ROA), measured as the EBITDA over total assets. We expect a positive relationship with impairment, since better performing firms will be less reluctant to recognize an impairment loss. Second, the frequency of operating losses (LOSSFREQ) experienced by the firm, measured as the percentage of fiscal years in which the company has reported losses at the EBITDA level over the last three years (two years for 2012). Like ROA, one would expect that firms performing poorly will be more reluctant to recognize additional losses (implying a negative relationship), but if losses are frequent, they might take the opportunity to make a “big bath”. Consequently, we don’t pose an expected impact. Finally, we consider dummies for industry fixed effects (SCT) and listed firms (SM), to control for unobserved heterogeneity of industry and stock market shocks.
The empirical specification of the resulting model is:
\[\begin{equation} \label{eq1} \small \begin{split} \text{IMP_GW}_{it} =&\ \beta_{0} + \delta\ \text{CONSERVATISM}_{i} + \gamma\ \text{GW_A}_{it} \hspace{0.5cm}\\ & + \theta_{12-14} \text{yeard}_{t} + \beta_{x} \text{Z}_{it} + \beta_{s} D_{i} + \mu_{i} + \varepsilon_{it} \end{split} \ \ \ \ \ (1) \end{equation}\]where Zit is a vector of regressors that follows the literature on the determinants of goodwill impairment, Di is a vector of dummies for the sector and listed nature of the firms, subscript it refers to firm i at time t, and where coefficients \(\delta\) for the proxy of conservatism used in the regression, \(\gamma\) for GW_A and θ for year dummies are the variables to be tested. Moreover, \(\mu_{i}\) controls for the individual effects of an unobservable nature, and \(\varepsilon_{it}\) is a random error. The list and expected impact of the control variables, according to the description above, is SIZE (+/-), LEVER (-), NOA (+), ROA (+), and LOSSFREQ (+/-).
3.2. The impact of changes in regulation on corporate results
The analysis of the effects of impairment recognition is complemented by the analysis of the financial performance of a set of both listed and unlisted firms. Hypothesis H2 is tested with a DiD approach that compares a treatment group of firms that report some goodwill in the sample period (a few years before and after the change in regulation) against a control group of firms that never reported goodwill during the same period – so they are unaffected by the change in regulation in the year 2016. Since treatment firms have goodwill and control firms do not, they are likely to differ in firm characteristics such as treatment firms being larger and more diversified because they performed acquisitions. To control for the effect of these differences, we use firm fixed effects and a list of control variables that account for potential differences. The empirical specification is:
\[\begin{equation} \label{eq2} \small \begin{split} \text{DEPENDENT}_{it} = \gamma_{0} + \gamma_{2}T_{t} + \gamma_{3}D_{i}T_{t} + \Sigma \beta_{x} \text{Control}_{it} + \mu_{i} + \epsilon_{it} \end{split} \ \ \ \ \ (2) \end{equation}\]where subscript it refers to firm i at time t. The dependent variable is compared in terms of a dummy variable Di that takes value equal to 1 for firms with positive goodwill at some point in 2012-2019 and 0 otherwise, and in terms of a dummy variable Tt that takes values 0 before 2016 and 1 after the change in regulation. Moreover, μi controls for the individual effects of an unobservable nature, and \(\varepsilon_{it}\) is an error term. Because we include firm fixed effects, we do not consider the main effect of the treatment variable, \(\gamma_{1}D_{i}\). The coefficient of interest is \(\gamma_{3}\), since post-2016 × treatment captures the incremental change in the dependent variable for treatment firms. Hence, for a positive (negative) impact for treatment firms in H2 to be satisfied, it is required that \(\gamma_{3}\) > 0 (< 0), with \(\gamma_{3}\) > \(\gamma_{2}\) (< \(\gamma_{2}\)).
The dependent variable, the ratio of earnings over assets, will be measured in three ways:
EBITDA, before goodwill impairment, over total assets (ROA) isolates the differential impact of potentially inflated goodwill balances under the impairment regulation.
EBIT over total assets (ROA1) adds the two effects of the change in regulation – on goodwill balances and reported earnings.
EBITDA, before goodwill impairment, scaled by total assets less goodwill (ROA2) is the measure we will use by default. It compares the return on assets of the treatment and control groups, before and after the change in regulation, which has no direct relationship with the goodwill and impairment figures reported.
The list of control variables is in order. Firm profitability is affected by size, revenue growth, leverage, investment, and current assets (Asimakopoulos et al., 2009). Moreover, Yazdanfar (2013) recognizes the impact of lagged profitability and productivity. The expected impact for each control variable is as follows. Firm size (SIZE) is measured as the natural logarithm of total assets at the end of the fiscal year. It is usually expected to have a positive impact on profitability: indeed, larger firms not only enjoy higher turnover but also have better access to capital markets and lower cost of borrowing (Asimakopoulos et al., 2009). However, it may also exhibit a negative relationship due to its expected negative association with revenue growth (Variyam & Kraybill, 1992). Sales growth (GROWTH) is calculated as the growth rate of revenue in two consecutive years. The classic view confirms a positive association between profitability and business growth (e.g., Cowling, 2004). However, this expected result must come with a nuance, since more recent studies show a rather limited influence (e.g., Delmar et al., 2013).
Leverage (LEVER2) is measured here as the ratio of the firm’s long-term debt and debt in current liabilities over total assets. The impact depends on the theory one follows on the determinants of capital structure. Thus, the pecking-order theory predicts a positive relationship between solvency and leverage, improving expected profitability. However, a negative relationship is expected from an agency costs perspective (Harris & Raviv, 1990) because higher debt reduces the funds available for investment. Physical capital investment (INVEST) is calculated as the growth rate of fixed assets in two consecutive years. Over the long term, its expected impact on profitability is positive, since it expands production, aiming at improving sales, cash flows and profits. However, over the short term, the renewal of fixed assets, at equal sales, implies an apparent worsening of turnover because, as fixed assets age, their net book value decreases as accumulated depreciation increases. Current assets scaled by total assets (CURRENT) may also exhibit either a positive or negative relationship with profitability. If interpreted as investment (working capital), its expected impact would be positive under the same logic as INVEST. However, inefficient management of current assets would negatively impact profitability.
Productivity is introduced in two ways: the ratio of sales to employees (PRODTY), with an expected positive impact, and the ratio of operating costs (measured as revenues minus EBITDA over revenues, denoted as OPEXRAT), with an expected negative impact. Finally, lagged profitability (LROA2,6 the ROA2 of year t-1) is introduced to account for potential inertia of corporate results over time. We do not consider macroeconomic factors that influence firm growth (Ipinnaiye et al., 2017) because we presume them to be quite similar for all Spanish firms over a short period. To sum up, the list and expected impact of the control variables, according to the description above, is SIZE (+/-), GROWTH (+), LEVER2 (+/-), INVEST (+/-), CURRENT (+/-), PRODTY (+), OPEXRAT (-) AND LROA2 (+).
4. Data and sample selection
4.1. Database
The universe of individual financial statements by all non-financial companies in Spain that had some positive goodwill in their balances at least one year between 2012 and 2019, according to SABI Bureau van Dijk database, results in a total of 3,906 firms. Impairment figures are not directly observable in the balances, and thus, data was estimated as follows.
In the period 2012 to 2015, no goodwill amortisation was allowed, so the estimation was easy to perform. Impairment data was directly estimated from the balance sheet in the following cases. First, since IMP_GW is measured relative to goodwill balance in year t-1, when it was zero the impairment is assumed to be zero. Second, when the goodwill balance did not change in two consecutive years, the impairment is assumed to be zero. Third, impairment should be reported in the “impairment and losses” account in the income statement, together with any impairment and losses of any intangible assets, PP&E and investment property. Hence, whenever that account was equal to zero, we assume goodwill impairment to be zero as well. Fourth, whenever the change in goodwill balance over two consecutive years was identical to the “impairment and losses” reported in the final year, goodwill impairment was assumed to be that amount. In any other case, impairment figures need to be obtained from the notes to the financial statements, since only there they are reported separately from other assets. With information retrieved online or directly received from companies,7 we managed to complete 98% of the population.
For years 2016 to 2019, estimating impairment data is less obvious because both systematic amortisation and impairment – as well as the potentially confounding effects of corporate acquisitions and divestitures – may occur at the same time. Nonetheless, for our research, this data will only be required for descriptive purposes. We proceed as follows. First, we identify goodwill reductions caused by divestitures by checking whether the firm reports a non-zero result on discontinued operations. Second, we follow Li & Sloan (2017) to estimate goodwill amortisation as any reduction below a 15% threshold relative to the beginning goodwill balance – since a linear amortisation of goodwill over 10 years implies 10% amortisation rate over the first year and increasing over time. Any goodwill reduction that exceeds that threshold is assumed to be impairment.
4.2. Goodwill and impairment figures under the different accounting methods
We start with a descriptive analysis of goodwill and impairment measures, before and after the change in regulation. Figure 1a provides the evolution over time of total goodwill and the number of firms with positive goodwill. Figure 1b completes the description with the relative weight of goodwill, both by company and over total assets.
During the impairment regulation, total goodwill declared in Spain was stable at about 30,000 million euros, with a slight decrease in 2015. Then, a clear reduction followed in year 2016, with the introduction of systematic amortisation. Since then, the trend seems to be quite stable again, but the number of firms with goodwill in their balances continues to increase, from 1,900 firms in 2012 to 2,500 in 2018.8 Consequently, goodwill expressed in relative terms clearly shows the reduction of the average goodwill per company, as well as of the share of goodwill over total assets, that followed with the new regulation. The trend was quite stable before 2016 (with the nuance of an apparently larger reduction of goodwill per company in 2015), fell sharply in 2016 about 3.7 million euros and 2.0% of total assets, and continued to steadily decrease during the amortisation period.
Figure 1. Evolution of goodwill from 2012 to 2019, in absolute and relative terms
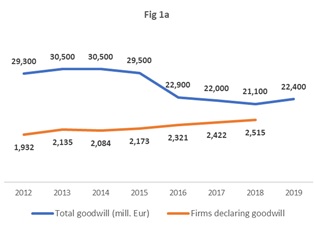
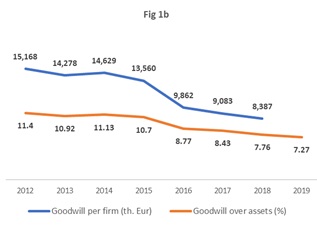
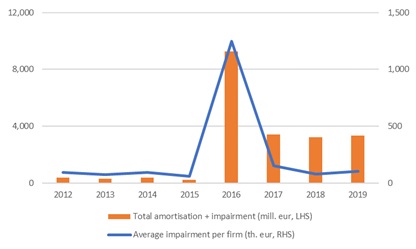
Figure 2 provides a similar interpretation for impairment and amortisation figures. We may observe the effect of the transitional provision in 2016: firms amortised goodwill against reserves about twice as much as they would amortise annually in the subsequent period. This represents more than 10 times the annual impairment they recognized in the past. Moreover, the average impairment reported during the amortisation period was slightly higher in 2017 and 2019 than during the impairment period. All these effects sum up in the evidence that the impairment recognised annually before 2016 was well below the sum of systematic amortisation plus impairment after the change in regulation, resulting in the evolution over time of goodwill balances in Figure 1.
Figure 2. Average impairment by firm and total impairment plus amortisation, 2012 to 2019
To sum up, the above results seem to confirm previous results that, under the impairment regulation, Spanish firms tend to exhibit larger goodwill figures (Cavero et al., 2021).
4.3. Determinants of impairment
The analysis of the determinants of impairment recognition focuses on the period before 2016, and, consequently, we use that subset of our database only. Robustness tests were performed for two alternative assumptions for the remainder 2% of the observations for which we could not obtain an impairment estimation.
Table 1 provides descriptive statistics for the variables in our sample. Data is winsorised at 1% and 99% for all continuous regressors except NOA and ROA, winsorised at 5% and 95%. There are 7,522 year-firm observations with impairment decisions, meaning that they had a positive goodwill that year, of which in more than 7,050 cases (93.8%) firms did not recognize any impairment loss. Although this by itself might be indicative of the reluctance of Spanish companies to declare impairment, the favourable economic context in Spain since the end of 2013 should be acknowledged, probably influencing positively the expectations of estimated future cash flows.
Table 1. Descriptive statistics. Listed and unlisted firms with goodwill, 2012-2015
| Variable | N | Mean | std.dev. | min | p25 | median | p75 | max |
|---|---|---|---|---|---|---|---|---|
| Imp_GW | 7,522 | 2.18 | 12.02 | 0.00 | 0.00 | 0.00 | 0.00 | 100.00 |
| GW_A | 14,083 | 5.80 | 10.80 | 0.00 | 0.00 | 0.50 | 6.10 | 58.40 |
| CONSV | 13,918 | 0.01 | 0.13 | -0.90 | -0.04 | -0.01 | 0.10 | 0.90 |
| CONSV2 | 13,922 | 0.04 | 0.83 | -2.87 | -0.35 | 0.01 | 0.39 | 3.75 |
| CONSV_SKEW | 12,292 | 0.00 | 0.96 | -2.24 | -0.68 | -0.02 | 0.69 | 2.21 |
| SIZE | 13,961 | 9.83 | 1.49 | 5.70 | 8.80 | 9.60 | 10.70 | 14.40 |
| LEVER | 12,655 | 2.78 | 6.14 | -30.70 | 0.60 | 1.50 | 3.30 | 61.60 |
| NOA | 13,127 | 1.06 | 0.99 | 0.20 | 0.50 | 0.70 | 1.20 | 6.30 |
| ROA | 12,788 | 6.99 | 6.34 | -8.90 | 2.90 | 6.40 | 10.80 | 24.20 |
| LOSSFREQ | 15,624 | 14.55 | 28.70 | 0.00 | 0.00 | 0.00 | 0.00 | 100.00 |
The mean (median) impairment is 2.18% (0.0%) of goodwill in balance, while the mean (median) goodwill in balance is 5.8% (0.5%) of total assets – almost half of the cases had no goodwill in balance that year. Leverage goes in the interquartile range from 0.6 to 3.3 times debt over equity (mean 2.78x, median 1.5x) and the positive economic environment is observed in positive ROAs (median 7.0% and at least three quarters of the sample with positive return) and loss frequency in the last three years being equal to zero in more than 75% of the cases. In addition, table A1 in the SM reports Pearson correlations between the dependent variable, test variables, and control variables. The correlations of the test variables are consistent with our predictions, with conservatism measures being positively related to IMP_GW, and GW_A – one of the proxies for opportunistic behaviour – being negatively related. Moreover, control variables LEVER and NOA have correlation signs consistent with our predictions, while only ROA shows the opposite sign expected. Nonetheless, correlations are quite low in all instances, due to the high number of null data. Finally, it is worth mentioning the low correlation of the three measures of conservatism, proving to be ideal for a robustness analysis.
4.4. The impact of changes in regulation on corporate results
The sample for this part of the research combines our complete database of firms with positive goodwill, here playing the role of treatment group, and a sample of firms with no goodwill on their balances that is to be used as control group. To this purpose, we randomly chose 4,000 firms among 534,435 firms available in SABI database with available data at least for years 2014 to 2018 (we opted to impose this restriction to ensure we would have sufficient data to test DiD before and after year 2016). This way, we end with 63,248 year-firm observations. We focus on the four fiscal years before the adoption year of the amortisation regulation (pre-2016 period) and the four fiscal years after the adoption year (post-2016 period), including year 2016 itself. We will check for robustness a comparison of periods 2013-15 vs. 2017-19, removing the year of adoption.
Table 2 provides descriptive statistics of the dependent and control variables, as well as the differences in means between the treatment and control firms, separately for the pre- and post-periods. The data highlights the relevance to control for financial differences between treatment and control firms. Indeed, firms declaring goodwill are much larger, highly more productive per worker, invest more and are growing at a faster pace. All this results in in greater profitability of the treatment firms.
The difference-in-differences of ROA2 between the treatment and control firms shows an average ROA2 of 7.83% in the pre-2016 period and 9.14% in the post-2016 for treatment firms. Their profitability improved during the second period, and they are more profitable than control firms in any period. However, control firms show slight relative improvement after 2016: the average ROA2 is 6.18% in the pre-2016 period and 7.54% in the post-2016 period. This translates into a difference in differences in favour of control firms of 0.04% – that is, against hypothesis H2, suggesting favourable evidence for the use of impairment tests. Moreover, the difference is substantial in the case of ROA1, with a relative increase of 0.64% for control firms.
Table 2. Descriptive statistics and differences between pre-2016 and post-2016 regimes. Listed and unlisted firms declaring goodwill plus control firms, 2012-2019
| PANEL A. Descriptive statistics of the full sample | ||||||||
|---|---|---|---|---|---|---|---|---|
| Variable | N | mean | std.dev. | min | p25 | median | p75 | max |
| assets | 63,248 | 61,474 | 6.6E+05 | 0.00 | 194.00 | 2,063 | 15,021 | 4.0E+07 |
| revenues | 61,999 | 45,070 | 3.9E+05 | 0.00 | 107.00 | 1,422 | 16,227 | 2.6E+07 |
| GW_A | 57,337 | 2.31 | 6.51 | 0.00 | 0.00 | 0.00 | 0.40 | 46.00 |
| ROA | 47,056 | 7.38 | 7.42 | -11.10 | 2.50 | 6.40 | 11.50 | 29.70 |
| ROA1 | 52,200 | 3.67 | 6.76 | -16.80 | 0.10 | 3.00 | 7.10 | 23.70 |
| ROA2 | 47,042 | 7.72 | 7.79 | -11.50 | 2.60 | 6.60 | 12.10 | 31.30 |
| GROWTH | 48,407 | 3.54 | 21.52 | -69.90 | -6.40 | 2.70 | 12.80 | 81.70 |
| SIZE | 56,808 | 7.87 | 2.47 | 2.15 | 5.86 | 8.06 | 9.73 | 13.84 |
| AGE | 61,964 | 3.04 | 1.03 | 1.00 | 2.00 | 3.00 | 4.00 | 4.00 |
| LEVER2 | 43,466 | 63.26 | 31.71 | 2.40 | 40.90 | 63.40 | 82.30 | 231.50 |
| INVEST | 50,488 | 1.32 | 21.30 | -52.80 | -8.00 | -1.40 | 5.60 | 100.20 |
| CURRENT | 57,316 | 57.39 | 29.53 | 0.90 | 33.10 | 60.70 | 83.40 | 100.00 |
| PRODTY | 49,375 | 272.04 | 426.20 | 0.00 | 66.50 | 134.60 | 299.10 | 4,330.80 |
| OPEXRAT | 49,210 | 91.18 | 22.78 | -13.30 | 86.40 | 94.20 | 98.10 | 281.60 |
| PANEL B. Differences in mean between samples | |||||||||||||
|---|---|---|---|---|---|---|---|---|---|---|---|---|---|
| Pre-2016 period | Post-2016 period | ||||||||||||
| Treatment | Control | Diff | Treatment | Control | Diff | ||||||||
| N | Mean | N | Mean | p-value | N | Mean | N | Mean | p-value | Diff. in Diff. | |||
| Dependent | |||||||||||||
| ROA | 12,867 | 7.28% | 10,897 | 6.12% | 0.000 | *** | 12,245 | 8.59% | 11,047 | 7.38% | 0.000 | *** | 0.04% |
| ROA1 | 13,308 | 3.99% | 12,877 | 2.40% | 0.000 | *** | 12,399 | 4.62% | 13,616 | 3.68% | 0.000 | *** | -0.64% |
| ROA2 | 12,747 | 7.83% | 10,970 | 6.18% | 0.000 | *** | 12,179 | 9.14% | 11,146 | 7.54% | 0.000 | *** | -0.04% |
| Control variables | |||||||||||||
| SIZE | 13,921 | 9.750 | 14,733 | 6.030 | 0.000 | *** | 13,008 | 9.970 | 15,146 | 6.120 | 0.000 | *** | 0.130 |
| GROWTH | 12,821 | 3.85% | 11,002 | 0.58% | 0.000 | *** | 12,302 | 6.20% | 12,282 | 3.19% | 0.000 | *** | -0.26% |
| LEVER2 | 12,846 | 62.63% | 9,115 | 67.87% | 0.000 | *** | 12,011 | 60.40% | 9,494 | 63.32% | 0.000 | *** | 2.32% |
| INVEST | 12,834 | 3.18% | 12,108 | -1.24% | 0.000 | *** | 12,185 | 3.24% | 13,361 | 0.10% | 0.000 | *** | -1.27% |
| CURRENT | 14,162 | 55.05% | 14,748 | 58.86% | 0.000 | *** | 13,279 | 56.04% | 15,127 | 59.34% | 0.000 | *** | 0.51% |
| PRODTY | 13,623 | 363.86 | 11,369 | 146.54 | 0.000 | *** | 12,823 | 383.88 | 11,560 | 163.21 | 0.000 | *** | 3.35 |
| OPEXRAT | 13,879 | 92.40% | 11,237 | 92.50% | 0.738 | 13,061 | 90.22% | 11,033 | 89.43% | 0.005 | *** | 0.89% | |
Note: * significant al 10%; ** significant at 5%; *** significant at 1%.
5. Empirical results
5.1. Determinants of impairment
Table 3 provides the results of the fixed effects regression.9 It should be noted that the scarcity of non-zero impairment decisions leads to very low R2 results (4.9% within, 0.4% overall). Consequently, we focus on the interpretation of the coefficients of the variables and their significance. In an untabulated analysis we also tested one-period lagged variables of GW_A, NOA, ROA and LOSSFREQ, as well as dummy variables SM for listed firms and SCT for industrial effects, but none of them contribute to the regression.
In the period 2012-2015, right before the introduction of the amortisation method in Spain, the determinants of firms reporting impairment are as follows. We obtain positive evidence of hypothesis H1a: the measure of reporting conservatism, CONSV, is positively related to the size of the impairment decision. This result adds to recent evidence of the impact of managerial conservatism on financial accounting data by Kim et al. (2013) and Dutta & Patatoukas (2017), among others, and consistent with a conservative accounting practice observed in most European countries (Cerqueira & Pereira, 2020). Moreover, results are robust to the alternative proxies for conservatism – see Table A2 in the SM. This allows us to isolate the effect of managerial conservatism across the sample when testing for opportunistic behaviour in terms of timing and goodwill relevance (see Banker et al., 2017, for a discussion). In this regard, we obtain positive evidence of both hypotheses H1b and H1c. On the one hand, there is significant evidence (p=0.000) that the more residual goodwill is on balance, the more readily the company recognises impairment. On the other hand, the impairment recognised in 2012 and 2013 is significantly lower by 1.7 and 1.2 percentage points than that recognised in 2015. There is therefore a clear "bath" effect just before the new accounting standard starts to be applied. The evidence of firms opportunistically managing goodwill impairment is in line with recent evidence by Filip et al. (2021), Pallarés-Sanchidrián et al. (2021), Xiao & Yang (2021), and Pardo & Giner (2022), showing a delayed recognition of goodwill impairment (e.g., Albersmann & Quick, 2020) that is only corrected through discretionary goodwill impairment losses (e.g., Lazar, 2019; Gros & Koch, 2020) with the prospect of a regulatory change.
Table 3. Determinants of impairment, 2012-2015
| Coef. | Std.Err. | t | ||
|---|---|---|---|---|
| Imp_GW | ||||
| CONSV | 2.2465 | 1.0441 | 2.15 | ** |
| GW_A | -0.3177 | 0.0423 | -7.50 | *** |
| SIZE | -4.2432 | 0.9136 | -4.64 | *** |
| LEVER | -0.1172 | 0.0366 | -3.20 | *** |
| NOA | -2.1248 | 0.4658 | -4.56 | *** |
| LOSSFREQ | 0.0750 | 0.0123 | 6.11 | *** |
| 2012 | -1.6604 | 0.3836 | -4.33 | *** |
| 2013 | -1.2321 | 0.3677 | -3.35 | *** |
| 2014 | 0.1813 | 0.3540 | 0.51 | |
| constant | 50.62 | 9.25 | 5.47 | *** |
| N. observ. | 6,117 | |||
| N. groups | 2,131 | F test: | 22.84 | *** |
Note: * significant al 10%; ** significant at 5%; *** significant at 1%.
Regarding control variables, it is worth noting the negative and significant relationship of SIZE with impairment: larger companies declared smaller impairments, taking most advantage of the pre-2016 regulation to act opportunistically. Moreover, consistent to our prediction, the more leveraged the company the more financial risk it takes and therefore the more it will try to delay the recognition of goodwill impairment. However, NOA shows a significant negative relationship with impairment – the opposite of what was expected. Recall that the objective of NOA is to account for accumulated effects in the balance sheet of previous accounting choices that might constrain managers’ ability to optimistically bias earnings in the future. Instead, we obtain that the higher NOA, the lower the impairment recognized. Since NOA has an inverse relationship with turnover, our interpretation of this result is that the higher the NOA, the lower the turnover and the lower the profitability; consequently, the company has an incentive to not report impairment to improve margins. Finally, in terms of performance, the more frequently the firm experiences operating losses, the larger the impairment recognized. This is again consistent with the opportunistic interpretation: although firms performing poorly will be reluctant to recognize additional losses, if these are frequent, they might take the opportunity for a “big bath”. Beyond that, we don’t trace a significant impact of performance (in terms of ROA) over impairment.
Two robustness tests were implemented to see the possible impact of missing observations. Given that we could not determine the impairment decision for about 2% of the changes in goodwill, we check the impact on results of two opposite assumptions: i. all decreasing balances in goodwill were impairments (zero impairment for increasing balances); and ii. all changes in goodwill correspond to corporate transactions (i.e., impairments were zero). Notice that these assumptions are common in other studies (see, for instance, Li and Sloan, 2017). The results we obtain are qualitatively identical – see Table A3 in the SM.
5.2. The impact of changes in regulation over corporate results
Table 4 presents the results of the regression devised to test hypothesis H2 – whether the profitability of treatment firms improved with the introduction of the amortisation method in 2016. As we may see, the two measures based on EBITDA show a coefficient on post-2016 × treatment that is significantly positive (p<0.01): ROA measured as EBITDA over total assets, as well as our base measure ROA2, which corrects the denominator by subtracting goodwill from total assets. On the contrary, the regression for ROA1 (which shows the economic return after the impact of goodwill amortisation on the income statement), shows a coefficient on post-2016 × treatment that is significantly negative (p<0.01).
The positive impact for ROA and ROA2 implies that firms with goodwill on their balances saw their economic return improved relative to control firms after the introduction of the goodwill amortisation method. Surprisingly, the result is not only observed for the return on total assets –suggesting that goodwill balances were inflated before 2016 -, but for ROA2 as well – which removes any accounting impact of goodwill itself. Thus, in terms of economic magnitude, increasing ROA2 0.494 percentage points represents a relative improvement of 6.3% (0.494/7.83) for treatment firms of introducing the amortisation regulation. It is a result difficult to rationalize, but a robustness analysis for period 2013-15 vs. 2017-19 shows that it prevails, and so it is not depending on the higher impairment recognized in 2016 due to the transitional provision (see Table A4). The evidence of delayed recognition of impairment suggested by the inflated goodwill balances before 2016 that have an impact on ROA measures is similar to the results obtained by Li & Sloan (2017), and Cavero et al. (2021). Han et al. (2021) find this result related to pressuring from securities analysts in the case of listed firms. Besides, the improved performance after the introduction of the amortisation method is in line with the findings by Filip et al. (2015) that managerial manipulation is detrimental to future performance.
Table 4. Impact of the change in regulation on financial performance, 2012-2019
| Coef. | Std.Err. | t | Coef. | t | Coef. | t | |||||||||
|---|---|---|---|---|---|---|---|---|---|---|---|---|---|---|---|
| ROA2 | ROA | ROA1 | |||||||||||||
| T | 0.428 | 0.09372 | 4.57 | *** | T | 0.282 | 3.30 | *** | T | 0.284 | 3.42 | *** | |||
| DT | 0.494 | 0.11136 | 4.44 | *** | DT | 0.377 | 3.74 | *** | DT | -0.331 | -3.37 | *** | |||
| SIZE | -1.104 | 0.10711 | -10.31 | *** | SIZE | -1.259 | -12.38 | *** | SIZE | -0.515 | -5.36 | *** | |||
| LEVER2 | -0.066 | 0.00257 | -25.70 | *** | LEVER2 | -0.048 | -18.62 | *** | LEVER2 | -0.053 | -21.87 | *** | |||
| GROWTH | 0.038 | 0.00154 | 24.52 | *** | GROWTH | 0.043 | 30.23 | *** | GROWTH | 0.041 | 30.20 | *** | |||
| INVEST | -0.009 | 0.00141 | -6.33 | *** | INVEST | -0.014 | -10.42 | *** | INVEST | 0.000 | 0.28 | ||||
| CURRENT | 0.034 | 0.00331 | 10.35 | *** | CURRENT | 0.017 | 5.33 | *** | CURRENT | 0.050 | 16.67 | *** | |||
| PRODTY | 0.002 | 0.00020 | 8.42 | *** | PRODTY | 0.001 | 6.91 | *** | PRODTY | 0.001 | 7.42 | *** | |||
| OPEXRAT | -0.289 | 0.00332 | -86.92 | *** | OPEXRAT | -0.262 | -79.93 | *** | OPEXRAT | -0.247 | -85.11 | *** | |||
| L_ROA2 | 0.004 | 0.00079 | 5.51 | *** | L_ROA | 0.237 | 33.93 | *** | L_ROA1 | 0.170 | 30.59 | *** | |||
| constant | 45.51 | 1.014 | 44.90 | *** | constant | 42.06 | 43.37 | *** | constant | 30.41 | 33.75 | *** | |||
| N. observ. | 28,825 | N. observ. | 25,719 | N. observ. | 28,851 | ||||||||||
| N. groups | 5,775 | F test: | 1,107.91 | *** | N. groups | 5,490 | 1,174.95 | *** | N. groups | 5,709 | 1,284.04 | *** | |||
Note: * significant al 10%; ** significant at 5%; *** significant at 1%.
Nonetheless, this potential advantage of the amortisation regulation vanishes once the impact of systematic amortisation over 10 years is considered, turning the positive impact on return on assets into a negative one of similar magnitude – 0.33 percentage points for ROA1. Avoiding this compulsory impact of the systematic amortisation regulation on earnings would be the main rationale behind delayed impairment recognition under the impairment tests regulation discussed in the previous section. All control variables in all models show significant coefficients and consistent interpretation to that reported in prior research, for an overall R2 of 19.6% (ROA2), 28.1% (ROA) and 35.8% (ROA1). Thus, the three variables with positive expected impact on profitability are confirmed: sales growth, productivity (positive sign for PRODTY and negative for OPEXRAT) and return on assets in the previous fiscal year. Firm size shows a significant negative impact on return, while leverage also has a negative impact – in line with agency costs perspective. Finally, investment in working capital has a positive impact, but the impact of investment in fixed assets is negative for ROA and ROA2 (not significant for ROA1), suggesting that the short-term impact on turnover of the increased asset book values prevails over the long-term positive impact of investment on sales and profitability.
6. Conclusions
This article delved into the debate on goodwill amortisation vs. impairment by testing the determinants of goodwill impairment recognition by Spanish firms before 2016, and the impact of the change in regulation that year over business performance.
The impact of the change in regulation to systematic goodwill amortisation was a reduction of the average goodwill per company and of the share of goodwill over total assets. The effect was to great extent due to the transitional provision in 2016, but also because the impairment recognised annually before 2016 was well below the sum of systematic amortisation plus impairment recognised after the change in regulation.
Regarding impairment recognition, we obtain evidence that different measures of reporting conservatism are positively related to the size of the impairment decision, adding to the literature of conservative accounting practices (e.g., Kim et al., 2013; Dutta & Patatoukas, 2017). After controlling for managerial conservatism, we obtain evidence of an opportunistic behaviour, with delayed recognition of goodwill impairment (e.g., Albersmann & Quick, 2020) that is only corrected through discretionary goodwill impairment losses (e.g., Lazar, 2019; Gros & Koch, 2020) with the prospect of a regulatory change. The effect is observed both in terms of timing and goodwill relevance: the more residual goodwill is on balance the more willing the company is to recognise impairment, and the impairment recognised in 2015 is significantly higher than that in 2012 and 2013 – suggesting a "bath" effect just before the new accounting standard was implemented.
Regarding the impact of introducing the goodwill amortisation over business performance, we obtain significant evidence that the profitability of the firms with goodwill in their balance sheets improved at the EBITDA level relative to control firms with the introduction of the amortisation method (even excluding the accounting impact of goodwill in the balance sheet). Thus, the return on assets of the treatment firms increased 0.49 percentage points relative to their peers (a relative improvement of 6.3%) after the introduction of the goodwill amortisation method, and controlling for firm size, revenue growth, leverage, investments, current assets, lagged profitability, and productivity. The evidence of inflated goodwill balances before 2016 and managerial opportunism being detrimental to future performance adds to previous results by Filip et al. (2015), Li & Sloan (2017), and Cavero et al. (2021), among others. However, the result does not prevail if the impact of systematic amortisation on earnings is considered, turning the positive impact on return on assets into a negative one of similar magnitude. This implies that firms with goodwill in their balances will lag behind their peers for 10 years – the length of the systematic amortization period. Avoiding such impact on earnings would be the main rationale behind delayed impairment recognition under the impairment tests regulation.
All these results provide evidence of the impacts of managerial opportunism and are in line with extant research suggesting that the systematic amortisation of goodwill paired with a periodic impairment test limits earnings management practices and helps investors assess the economic performance of a firm. According to Li & Sloan (2017), such combined approach may lead to accounting that better reflects the underlying economics of goodwill. These all are relevant lessons to be learned by accounting regulators and firm managers, as they show the impact of managerial discretion over accounting figures. Thus, it favours making more use of behavioral theories in explaining goodwill accounting (Amel-Zadeh et al., 2023), and assessing the monitoring ability of audit committees when managerial incentives to bias earnings are present (Shepardson, 2019). Overall, it comes to add to the discussion on whether the relatively high costs of impairment tests are justified by sufficiently high benefits (Albersmann & Quick, 2020).
The results are validated in terms of different databases used and robustness tests performed. The main limitation comes from using a case of study from a single country, characterized by low enforcement (Pardo & Giner, 2022): the results could be biased by cultural traits (Statman & Weng, 2010) and social contagion (Manski, 2000), while also being related to the intensity of enforcement and monitoring in the country (Glaum et al., 2018). Future research might contribute by providing similar tests in other countries and cases of study. Moreover, for comparative purposes only individual financial statements were considered here – these are the only ones that are fully affected by the change in the Spanish regulation in 2016. However, this leaves out most of the business combinations that explain the recognition of goodwill in practice, which are those arising through the acquisition of controlling participations in companies. Future research should include this possibility, for which future research should include this possibility, for which the consolidated financial statements affected by the regulatory change – i.e., only those that do not apply IFRS – should be identified, and check that in 2016 they didn’t change to apply IFRS taking advantage of the 2016 regulatory change.
SUPPLEMENTARY MATERIAL
From goodwill impairment to goodwill amortisation: impact on financial reporting and market reaction of the new 2016 Spanish regulation
Table A1. Pearson correlations. Sample: determinants of impairment, 2012-2015
| Imp_GW | GW_A | CONSV | CONSV2 | CONSV _SKEW | SIZE | LEVER | NOA | ROA | LOSSFREQ | |
|---|---|---|---|---|---|---|---|---|---|---|
| Imp_GW | 1.000 | |||||||||
| GW_A | -0.067 | 1.000 | ||||||||
| CONSV | 0.030 | -0.055 | 1.000 | |||||||
| CONSV2 | 0.089 | 0.042 | 0.056 | 1.000 | ||||||
| CONSV_SKEW | 0.029 | 0.045 | 0.021 | -0.051 | 1.000 | |||||
| SIZE | -0.004 | 0.160 | -0.130 | 0.105 | -0.021 | 1.000 | ||||
| LEVER | -0.009 | -0.040 | 0.007 | -0.006 | 0.002 | 0.003 | 1.000 | |||
| NOA | 0.004 | 0.120 | -0.000 | 0.061 | 0.031 | 0.346 | -0.017 | 1.000 | ||
| ROA | -0.032 | -0.046 | -0.044 | -0.184 | -0.009 | -0.069 | -0.086 | -0.132 | 1.000 | |
| LOSSFREQ | 0.127 | 0.053 | 0.062 | 0.189 | 0.047 | -0.018 | 0.022 | 0.077 | -0.532 | 1.000 |
Table A2. Regression alternatives for determinants of impairment
| CONSV2 | ||||
|---|---|---|---|---|
| Coef. | Std.Err. | t | ||
| Imp_GW | ||||
| CONSV2 | 0.6820 | 0.1848 | 3.69 | *** |
| GW_A | -0.2877 | 0.0427 | -6.74 | *** |
| SIZE | -3.0431 | 0.9467 | -3.21 | *** |
| LEVER | -0.1009 | 0.0367 | -2.75 | *** |
| NOA | -1.3569 | 0.4677 | -2.90 | *** |
| LOSSFREQ | 0.0669 | 0.0120 | 5.56 | *** |
| 2012 | -1.6578 | 0.3693 | -4.49 | *** |
| 2013 | -1.3400 | 0.3534 | -3.79 | *** |
| 2014 | 0.1717 | 0.3391 | 0.51 | |
| constant | 37.26 | 9.61 | 3.88 | *** |
| N. observ. | 6,163 | |||
| N. groups | 2,123 | F test: | 18.82 | *** |
Note: * significant al 10%; ** significant at 5%; *** significant at 1%.
| CONSV_SKEW | ||||
|---|---|---|---|---|
| Coef. | Std.Err. | T | ||
| Imp_GW | ||||
| TV exogenous | ||||
| GW_A | -0.1378 | 0.0206 | -6.68 | *** |
| NOA | -0.6200 | 0.3870 | -1.60 | * |
| LOSSFREQ | 0.0696 | 0.0081 | 8.59 | *** |
| 2012 | 0.3780 | 0.3400 | 1.11 | |
| 2013 | 1.9786 | 0.3400 | 5.82 | *** |
| 2014 | 1.4412 | 0.3504 | 4.11 | *** |
| TV endogenous | ||||
| SIZE | -0.5494 | 0.7060 | -0.78 | |
| LEVER | -0.1332 | 0.0353 | -3.78 | *** |
| TI exogenous | ||||
| CONSV_SKEW | 0.3503 | 0.3086 | 1.14 | |
| constant | 8.45 | 6.87 | 1.23 | |
| N. observ. | 6,065 | |||
| N. groups | 2,020 | Wald chi2 (9) | 189.65 | *** |
Note: * significant al 10%; ** significant at 5%; *** significant at 1%. TV stands for “time variant”, TI for “time invariant”. Estimation Hausman-Taylor with robust estimate of variance-covariance matrix of the estimator.
For panel data models in which invariant regressors, such as CONSV_SKEW, are of particular interest, fixed effects estimator is not useful, as it uses data variation over time. When the Hausman test suggests that random effects estimation is neither a valid alternative, the HT method by Hausman and Taylor (1981) combines the fixed effects estimation with an instrumental variables (IV) estimation for the time-invariant regressors that are correlated with the individual effects. It requires an ex-ante definition of a set of time-variant exogenous regressors (in a number equal to or greater than the number of time-invariant regressors to be tested) that are not correlated with the individual effects – since they act as instruments for the correlated invariant regressors.
Table A3. Robustness analysis for determinants of impairment
| All decreasing balances in goodwill are impairments (zero impairment for increasing balances) | ||||
|---|---|---|---|---|
| Coef. | Std.Err. | t | ||
| Imp_GW | ||||
| CONSV | 1.6135 | 1.2063 | 1.34 | |
| GW_A | -0.5352 | 0.0476 | -11.25 | *** |
| SIZE | -5.6666 | 1.0469 | -5.41 | *** |
| LEVER | -0.1848 | 0.0412 | -4.48 | *** |
| NOA | -2.1274 | 0.5373 | -3.96 | *** |
| LOSSFREQ | 0.0916 | 0.0140 | 6.53 | *** |
| 2012 | -1.9420 | 0.4429 | -4.38 | *** |
| 2013 | -1.3884 | 0.4258 | -3.26 | *** |
| 2014 | 0.0177 | 0.4104 | 0.04 | |
| constant | 68.33 | 10.64 | 6.42 | *** |
| N. observ. | 6,408 | |||
| N. groups | 2,161 | F test: | 32.61 | *** |
Note: * significant al 10%; ** significant at 5%; *** significant at 1%.
We have 7,872 observations with impairment, of which 7,166 are zeros (91.1%). This shows the impact null data had on R2: within increases to 6.5% (1.5 percentage points higher). Beyond that, the results are qualitatively identical – even more, it better shows the impact of a residual weight of goodwill over assets (GWA, with a higher coefficient, showing higher impact on impairment), firm size, and leverage. Annual dummies also provide evidence of a bath effect in 2015 (up to 2% difference between 2015 and 2012). CONSV, however, loses significance, although it maintains the sign.
| All changes in goodwill correspond to corporate transactions (i.e., impairments were zero). | ||||
|---|---|---|---|---|
| Coef. | Std.Err. | t | ||
| Imp_GW | ||||
| CONSV | 1.8982 | 1.0136 | 1.87 | * |
| GW_A | -0.2869 | 0.0400 | -7.17 | *** |
| SIZE | -4.4416 | 0.8797 | -5.05 | *** |
| LEVER | -0.0799 | 0.0346 | -2.31 | ** |
| NOA | -1.7289 | 0.4515 | -3.83 | *** |
| LOSSFREQ | 0.0636 | 0.0118 | 5.39 | *** |
| 2012 | -1.6784 | 0.3721 | -4.51 | *** |
| 2013 | -1.1272 | 0.3578 | -3.15 | *** |
| 2014 | 0.2331 | 0.3448 | 0.68 | |
| constant | 52.00 | 8.94 | 5.82 | *** |
| N. observ. | 6,408 | |||
| N. groups | 2,161 | F test: | 20.84 | *** |
Note: * significant al 10%; ** significant at 5%; *** significant at 1%.
7,404 of the 7,872 observations with impairment would be zeros (94.1%). Results are qualitatively identical – with the nuance of a lower statistical significance of CONSV (p≈0.05). It also shows that the low R2 of the original regression is caused by the high number of null data: within decreases to 4.2% (more than half a point lower).
Table A4. Robustness analysis for impact on financial performance
| Coef. | Std.Err. | t | ||
|---|---|---|---|---|
| ROA2 | ||||
| T | 0.4436 | 0.10924 | 4.06 | *** |
| DT | 0.2994 | 0.12891 | 2.32 | ** |
| SIZE | -1.2340 | 0.12973 | -9.51 | *** |
| LEVER2 | -0.0641 | 0.00304 | -21.11 | *** |
| GROWTH | 0.0348 | 0.00184 | 18.88 | *** |
| INVEST | -0.0083 | 0.00166 | -4.98 | *** |
| CURRENT | 0.0322 | 0.00395 | 8.17 | *** |
| PRODTY | 0.0017 | 0.00024 | 7.08 | *** |
| OPEXRAT | -0.2847 | 0.00393 | -72.52 | *** |
| L_ROA2 | 0.0029 | 0.00080 | 3.59 | *** |
| constant | 46.40 | 1.227 | 37.80 | *** |
| N. observ. | 21,558 | |||
| N. groups | 5,531 | F test: | 740.25 | *** |
Note: * significant al 10%; ** significant at 5%; *** significant at 1%.