Debt maturity in Spanish small business startups
ABSTRACT
This article studies debt maturity in startup firms. Specifically, it analyzes whether the maturity of the debt of these firms is different from that of older firms. It also studies whether these possible differences are maintained during periods of financial crisis. To this end, we use a sample of small Spanish firms during the period 2011-2020. The results indicate that new or recently created firms have debt with shorter maturities. This could be explained by the greater agency problems and information asymmetries that these firms face. Moreover, we observe that this result is maintained during periods of financial crisis.
Keywords: Debt maturity; Startup firms; Financial crisis.
JEL classification: G01; G32.
Vencimiento de la deuda en pequeñas empresas españolas de reciente creación
RESUMEN
Este artículo estudia el vencimiento de la deuda de empresas de nueva o reciente creación. En concreto, se analiza si el vencimiento de la deuda de estas empresas es diferente al de las empresas de mayor edad. Además, también se estudia si estas posibles diferencias se mantienen durante periodos de crisis financiera. Utilizando una muestra de pequeñas empresas españolas durante el período 2011-2020, los resultados indican que las empresas nuevas o de reciente creación tienen deuda con un menor vencimiento, lo que podría ser explicado por los mayores problemas de agencia e información asimétrica que tienen estas empresas. Además, se observa que este resultado se mantiene en periodos de crisis financiera.
Palabras clave: Vencimiento de la deuda; Empresas incipientes; Crisis financiera.
Códigos JEL: G01; G32.
1. Introduction
There is a large body of literature demonstrating how debt maturity can reduce agency conflicts (Myers, 1977; Barnea et al., 1980; Barclay & Smith, 1995; Guedes & Opler, 1996; Stohs & Mauer, 1996; Ozkan, 2000; Childs et al., 2005; Datta et al., 2005; Arslan & Karan, 2006; and García-Teruel & Martínez-Solano, 2010). These studies show how increased use of short-term debt reduces these conflicts. Given its importance, the determinants of debt maturity have also been widely addressed in the literature (Flannery, 1986; Diamond, 1991; Barclay & Smith, 1995; Stohs & Mauer, 1996; Cuñat, 1999; Scherr & Hulburt, 2001; Berger et al., 2005; García-Teruel & Martínez-Solano, 2007; Huyghebaert & Van de Gucht, 2007; González, 2013; and Díaz-Díaz et al., 2016; among others). However, only Huyghebaert & Van de Gucht (2007) have analyzed the determinants of debt maturity structure for a sample of new firms. Specifically, they used a sample of Belgian manufacturing firms. They found that banks attempt to limit the risk associated with these companies' greater information asymmetries and agency conflicts by reducing the amount of the loan rather than shortening loan maturity. In other words, they found that the maturity structure of bank loans for these firms is not affected by information asymmetries or agency conflicts.
Unlike established companies, newly created firms cannot offer information about their previous financial situation or operations. This lack of information means that these firms have more information asymmetries than established firms. Moreover, they have a greater risk of bankruptcy in the first years of their life cycles (Huyghebaert & Van de Gucht, 2007), so the debt agency costs of these firms can be high, especially when they face financial difficulties. These characteristics could affect available external financing, its cost, the terms offered, and entrepreneurs' preferences for one type of financing over another. Therefore,the debt maturity structure of newly created firms may differ from that of older firms.
The work by Huyghebaert & Van de Gucht (2007), like the other studies on startups, only used a sample of recently created firms, which does not permit an in-depth examination of the differences between these firms and established firms. Unlike previous studies, this work uses a sample of firms including both newly created and established firms. Our objective is to analyze whether the debt maturity structure of startups differs from that of older firms. Although the study of debt maturity structure has been widely covered in the literature, no work has specifically analyzed whether startup firms use debt with different maturities. This study is of particular importance since it has been shown that firms’ creation and survival depend greatly on their financial structure.
We use a sample of small, non-financial Spanish firms for the period 2011-2020. This includes a period of the financial crisis (2011-2014) and non-crisis (2015-2020), allowing us to analyze whether the results vary depending on the financial situation of the country. According to the Bank of Spain in its 2017 report, 2011 to 2014 was a time of deepening economic crisis in Spain, characterized by increasing instability in the Spanish financial sector, a significant increase in unpaid loans, a steep drop in credit granted, high-interest rates on credit, and growing uncertainty about the solvency of some entities and, by extension, of the banking sector as a whole. The number of companies created in Spain fell by 28.12% between 2004 and 2014. The Bank of Spain indicated in its 2015 Annual Report that the difficulty of accessing external financing caused by tightened financial conditions was one of the reasons for this decrease. This was especially relevant for newly created firms due to the lack of information they could provide financial institutions and their higher credit risk. These circumstances point to the relevance of studying debt maturity structures in newly created Spanish firms.
Spanish capital markets are less developed than those in Anglo-Saxon countries. In Spain, firms receive most of their financing from financial institutions (Schmidt & Tyrell, 1997). In addition to the fewer financing alternatives available to Spanish firms, small firms have more financial restrictions (Whited 1992; Fazzari & Petersen 1993; Audretsch & Elston 1997). The Bank of Spain stated in its 2015 Annual Report that external financing for smaller Spanish firms comes mainly from bank loans. In this line, Astebro & Bernhardt (2003) and Deloof & Vanacker (2018) demonstrated the importance of bank loans for the survival of startups.
Our work contributes to the literature on recently created firms by providing evidence of the differences in debt maturity structure between these firms and older firms, which is an issue that has not yet been addressed in the literature. It also contributes to the scarce literature on financial decisions in startup firms.
The results show that startup firms use a higher proportion of short-term debt than firms with a longer trajectory, which may be due to their bigger agency problems and information asymmetries. The results also indicate that this occurs both in periods of financial crisis and non-crisis.
The work is structured as follows: Section 2 reviews the literature on startups and debt maturity. The sample is presented in Section 3. Section 4 describes the variables and model used. Section 5 defines the data, and Section 6 presents the results obtained. Finally, Section 7 contains the main conclusions.
2. Information asymmetries and agency conflicts
Long-established firms can provide information about their previous financial situations and operations. However, financial institutions do not have this information about recently created firms. This lack of background information means that these companies have more information asymmetries than established firms. Lenders cannot easily assess the quality of a company without background information (Huyghebaert & Van de Gucht, 2007). As these authors indicated, their projects are often innovative and difficult to judge. Therefore, lenders facing adverse selection and moral hazard problems may offer short-term debt rather than medium- and long-term debt to increase their control over borrowing firms. Short-term debt gives lenders greater flexibility to cancel contracts or change credit terms. This is especially important when the quality of the company cannot be determined during its first years of existence.
During the first years of a firm’s life cycle, the risk of bankruptcy is greater (Huyghebaert and Van de Gucht, 2007), so the debt agency costs of these firms can also be higher. Regarding debt agency costs, shareholders can expropriate wealth from lenders in two ways (Ravid, 1996). They may decide not to carry out profitable investment projects if a large part of the profits must go to paying off debt (Myers, 1977). Owners do not have incentives to make investments that will largely benefit creditors, thus discouraging profitable investment projects. Myers (1977) indicated that this problem can be lessened if the debt matures before investment opportunities can be exercised. That is, the problem can be mitigated by reducing the maturity of the debt. The agency conflict between owner and creditor is also determined by owners’ incentives to carry out risky investment projects that could provide large benefits when they do not have to bear the brunt of the losses (Jensen & Meckling, 1976). These agency problems are especially important in firms with opaque information and greater risk (Pettit & Singer, 1985; Berger & Udell, 1998), such as recently created firms. As Myers (1977) and Childs et al. (2005) stated, these agency problems can be reduced by issuing short-term debt since lenders then have more flexibility to renegotiate the terms of the contracts or even decide not to renew the loans. Much of the literature has shown that short-term debt is often used in companies with more growth opportunities (Barclay & Smith, 1995; Guedes & Opler, 1996; Stohs & Mauer, 1996; Ozkan, 2000; González, 2013, López-Gracia & Mestre-Barberá, 2015, Díaz-Díaz et al., 2016; Casino-Martínez et al., 2019). Thus, as newly created firms have more information asymmetries and agency conflicts, we hypothesize that startup firms will have a higher proportion of short-term debt.
3. Sample
To carry out this study, we use a sample of small Spanish firms during the period 2011-2020, which covers a period of financial crisis and non-crisis. The data have been obtained from the SABI (Iberian Balance Analysis System) database. Only Spanish firms that meet the requirements of small firms according to the European Commission Recommendation 2003/361/EC have been selected. These requirements include firms with fewer than 50 workers, a turnover of less than 10 million euros, and a balance sheet not exceeding 10 million euros. Thus, the sample includes micro firms. Small firms have been selected because the initial size of newly created companies is generally small in Spain, with an average of 4.6 workers1. This was accentuated during the crisis, and the average size of firms created in Spain has decreased since 2008 (Bank of Spain Annual Report 2015).
Financial firms have been excluded from the sample due to their special characteristics. Observations with errors in the accounting data and extreme values for the variables of interest have also been eliminated. Specifically, the values below the 2nd percentile and above the 98th percentile have been discarded. As a consequence, the sample is made up of 60,085 firms, of which 4,904 are considered startups.
Table 1. Number of firms by activity sector
| Industry | Description | Non-startup | Startup | Total sample |
|---|---|---|---|---|
| 1 | Agriculture, livestock, and fishing | 1,316 | 180 | 1,496 |
| 2 | Manufacturing | 22,767 | 1,759 | 24,526 |
| 3 | Construction | 6,936 | 641 | 7,577 |
| 4 | Wholesale and retail trade | 14,603 | 1,196 | 15,799 |
| 5 | Services | 9,559 | 1,128 | 10,687 |
| Total | 55,181 | 4,904 | 60,085 |
Firms in existance for four years or less are considered startups. This definition is in line with that proposed by Berger & Udell (1998), who distinguished four groups of companies: infants (0 to 2 years), adolescents (3 to 4 years), middle-aged (5 to 24 years), and old (more than 25 years). Thus, we have considered the first two categories as newly created firms. According to the 2015 Bank of Spain report, there is a low probability that Spanish firms will survive more than five years. New Spanish firms are more likely to disappear than established firms. This supports our criterion for startup firms. Firms in existence for five or more years are not considered startups.
The sample has been divided into five sectors of activity. Table 1 shows the number of firms by sector, differentiating between startup and established firms.
4. Variables and model
4.1. Variables
The literature has established other factors that can influence the choice of debt maturity, which we present below.
Firms usually coordinate the maturity of their debt and assets. Firms with less debt maturity than that of their assets could have problems meeting their financial obligations. In contrast, debt maturity later than that of a firm’s assets implies meeting financial obligations at a time when assets are no longer generating liquidity. As Myers (1977) indicates, coordinating the maturity of debt and assets could reduce the problem of underinvestment. González (2009, 2013, 2015, 2017), López-Gracia & Mestre-Barberá (2015), Díaz-Díaz et al. (2016), and Casino-Martínez et al. (2019), among others, confirmed that there is a positive relationship between debt maturity and asset maturity.
Modigliani & Miller (1958) showed that without taxes and bankruptcy costs, decisions about maturity structure are irrelevant. Brick & Ravid (1985) analyzed the effect of taxes on the choice of debt maturity structure. According to these authors, if the term structure of interest rates is not flat, the value of tax benefits depends on debt maturity. If the slope is positive, firms increase their value by increasing long-term debt. In contrast, short-term debt increases the value of a firm if the slope is negative. The studies by Mauer & Lewellen (1987), Emery et al. (1988), and Díaz-Díaz et al. (2016) are in the same line as that by Brick & Ravid (1985), while Barclay & Smith (1995) and González (2013) did not obtain sufficient evidence on the relationship between debt maturity and the yield curve.
According to Kane et al. (1985), debt maturity should increase if the tax rate decreases, if floating costs increase, and if the volatility of a firm’s value decreases. González (2009, 2013) and Díaz-Díaz (2016) found that the debt maturity structure decreases when tax rates increase.
Diamond (1991), by extending the previous signalling models, assumed that firms with lower refinancing risk may choose short-term debt, while firms with high risk prefer long-term debt to reduce refinancing risk. However, firms with higher default risk may not receive long-term debt due to adverse selection costs. Thus, while firms with intermediate risk are more likely to receive long-term debt, very low-risk and risky firms are expected to receive more short-term debt.
Finally, levels of indebtedness can also affect debt maturity. As Diamond (1993) indicated, highly indebted firms prefer debt with long-term maturity to control their greater financial risk. Other authors, such as Stohs & Mauer (1996), Scherr & Hulburt (2001), González (2015), and Casino-Martínez et al. (2019), have confirmed this hypothesis by finding a positive relationship between levels of indebtedness and debt maturity. In the case of Spain, García-Teruel & Martínez-Solano (2007), López-Gracia & Mestre-Barberá (2015), and Díaz-Díaz (2016) also found a positive relationship between indebtedness and long-term debt.
4.2. Model
To analyze whether the debt maturity structure of startups differs from that of older firms, we estimate the following model:
\[\begin{equation} \label{eq1} \small \begin{split} \text{Debtmat}_{i,t} & = \beta_{0} + \beta_{1}StartupDummy + \beta_{2}\mathrm{Size}_{i,t} + \beta_{3}\mathrm{Growth}_{i,t} \\ & + \beta_{4}\mathrm{Assetmat}_{i,t} + \beta_{5}Term_{t} + \beta_{6}Taxes_{i,t} + \beta_{7}Zscore_{i,t} \\ & + \beta_{8}Zscore^{2}_{i,t} + \beta_{9}TotalDebt_{i,t} + \gamma_{t} + \varphi_{s} + \mu_{i} + \varepsilon_{i,t} \end{split} \ \ \ \ \ (1) \end{equation}\]The dependent variable (Debtmat) represents debt maturity, measured as the ratio between long-term debt and total debt2. StartupDummy is a dummy variable that takes the value of 1 for recently created firms and 0 otherwise. The rest of the independent variables used are size (Size), growth opportunities (Growth), asset maturity (Assetmat), interest rate term structure (Term), firm tax rate (Taxes), default risk (Zscore) and its square (Zscore2), and level of indebtedness (Totaldebt). \(\gamma_{t}\) and \(\varphi_{s}\) are time and industry dummy variables. \(\mu_{i}\) controls for the unobservable characteristics of each firm, and \(\varepsilon_{i,t}\) stands for random disturbance.
To control for information asymmetries, we use firm size, which is measured using the natural logarithm of sales. As the literature indicates, information asymmetries are particularly important in small businesses. We expect a positive relationship between size and debt maturity structure because these problems can be reduced by issuing short-term debt.
We also include growth opportunities to control for agency conflicts. This variable is measured using sales growth (Salest-Salest-1)/Salest. We expect that firms with greater growth opportunities will use more debt in the short term due to their higher agency costs. Therefore, we expect a negative relationship between sales growth and debt maturity structure.
Asset maturity has been measured as the ratio between fixed assets and their depreciation. Firms tend to coordinate the maturity of debt and assets to reduce agency problems. Therefore, we expect a positive relationship between asset maturity and debt maturity.
The slope of the interest rate term structure has been calculated as the difference between the yield on a ten-year Spanish Treasury bond and the yield on a twelve-month Spanish T-bill. As Brick & Ravid (1985) indicated, if the slope is positive, companies can increase their value by increasing the use of long-term debt. The tax rate has been measured as the quotient between taxes and profit before taxes. Higher tax rates are associated with a lower debt maturity structure.
The Z score variable measures the credit risk of the firm. This is calculated as the re-estimation of Altman's (1968) model by Begley et al. (1996). We use the Z score variable because the debt in our sample of firms is not rated. Based on Diamond's (1991) model, we expect an inverted U-shaped relationship between credit risk and debt maturity. While firms with intermediate risk are more likely to receive long-term debt, very low-risk and risky firms are expected to receive more short-term debt.
Finally, we include leverage as a control variable. As the literature has shown, highly indebted companies prefer long-term debt to control their financial risk. So, we include the ratio between total debt and total assets in the model, and we expect a positive relationship between levels of indebtedness and maturity structure.
To analyze whether the results are different in crisis and non-crisis periods, we estimate the following model:
\[\begin{equation} \label{eq2} \small \begin{split} \text{Debtmat}_{i,t} & = \ \beta_{0} + \beta_{1}StartupDummy + \beta_{2}Crisis_{i,t} \\ & + \beta_{3}\mathrm{CrisisxStartupDummy}_{i,t} + \beta_{4}Size_{i,t} + \beta_{5}\mathrm{Growth}_{i,t} \\ & + \beta_{6}\mathrm{Assetmat}_{i,t} + \beta_{7}Term_{t} + \beta_{8}Taxes_{i,t} + \beta_{9}Zscore_{i,t} \\ & + \beta_{10}Zscore^{2}_{i,t} + \beta_{11}TotalDebt_{i,t} + \gamma_{t} + \varphi_{s} + \mu_{i} + \varepsilon_{i,t} \end{split} \ \ \ \ \ (2) \end{equation}\]Crisis is a dummy variable that takes the value of 1 during the crisis period, that is, during 2011-2014, and zero otherwise. The rest of the variables have been defined above.
We use the Breusch & Pagan (1980) test to identify individual effects. Since the null hypothesis of no unobserved heterogeneity is rejected (p-value= 0.00), a model capturing individual heterogeneity is appropriate. The models are estimated using the fixed effects estimation since the Hausman (1978) test indicates that the null hypothesis is rejected (p-value= 0.00) and only within-group estimation is consistent.
5. Data
Table 2 shows the descriptive statistics for all the observations of the sample.
Table 2. Descriptive statistics
| Variable | Obs. | Mean | Sth.Dev. | 10th percentile | 90th percentile |
|---|---|---|---|---|---|
| Debtmat | 161,243 | 0.2888 | 0.2065 | 0.0338 | 0.5932 |
| Size | 161,243 | 7.6656 | 0.7321 | 6.6470 | 8.6307 |
| Growth | 161,243 | 0.0533 | 0.1888 | -0.1638 | 0.2914 |
| Assetmat | 161,243 | 11.2028 | 10.0557 | 2.7866 | 23.8398 |
| Term | 161,243 | 1.6585 | 0.7283 | 0.596 | 2.713 |
| Taxes | 161,243 | 0.2384 | 0.0838 | 0.1544 | 0.3000 |
| Z score | 161,243 | 0.6057 | 0.2311 | 0.3026 | 0.9216 |
| TotalDebt | 161,243 | 0.5981 | 0.1981 | 0.3142 | 0.8561 |
Debtmat is the ratio between long-term debt and total debt. Size is the natural logarithm of sales. Growth is sales growth. Assetmat is the ratio between fixed assets and their depreciation. Term is the differential of interest rates. Taxes is the quotient between taxes and profit before taxes. Z score is the re-estimation of Altman's (1968) Z score by Begley et al. (1996). TotalDebt is the ratio between total debt and total assets.
Debtmat is the ratio between long-term debt and total debt. Size is the natural logarithm of sales. Growth is sales growth. Assetmat is the ratio between fixed assets and their depreciation. Term is the differential of interest rates. Taxes is the quotient between taxes and profit before taxes. Z score is the re-estimation of Altman's (1968) Z score by Begley et al. (1996). TotalDebt is the ratio between total debt and total assets.
Figure 1 shows the evolution of the debt maturity structure for both groups throughout the analyzed period. As can be seen, newly created firms have lower debt maturity throughout the period, except in 2020. Debt maturity increases in 2020 as a result of one of the measures taken by the government to alleviate the economic effects of the Covid19 crisis (Línea ICO). According to the Bank of Spain in its 2020 Annual Report, the public guarantee lines for business financing managed by the ICO stimulated the supply of financing, which favored access to credit to firms with difficulties in obtaining external financing, especially small firms, and increased the maturity of the debt.
Figure 1. Debt maturity structure by year and firm group
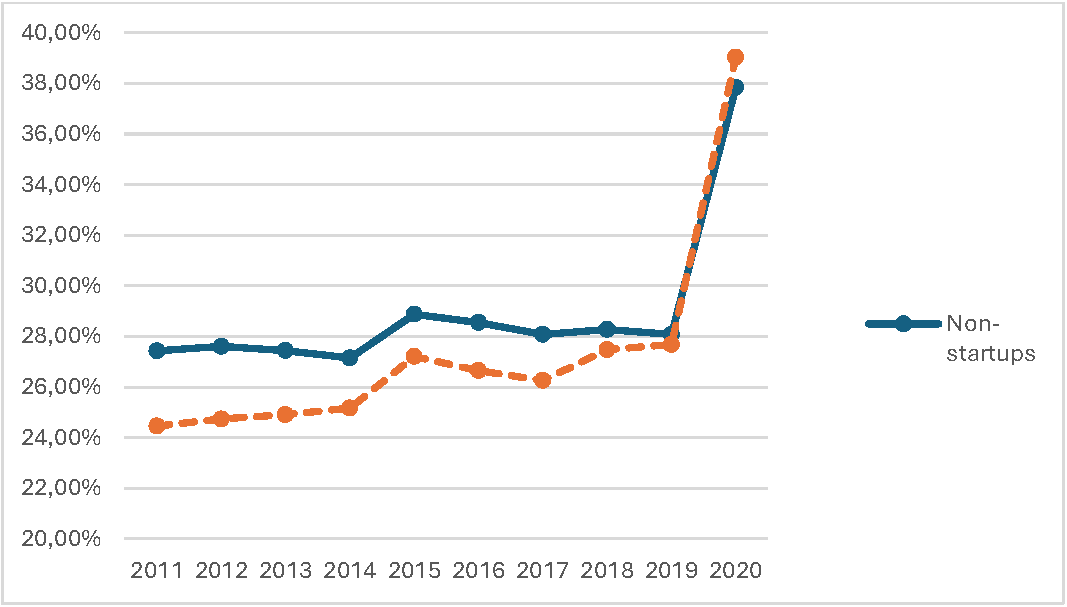
Table 3 shows the mean value of debt maturity by firm group, the difference in means, and a test of the mean differences. We can see that, on average, 27.39% of the total debt taken on by startups is long-term, while in older firms, long-term debt represents 28.95% of their total debt. This difference is significant. The results are consistent with our hypothesis that due to greater information asymmetries and agency conflicts, newly created firms make greater use of short-term debt.
Table 3. T-test for the difference in means
| Variable | Non-startups | Startups | Difference in means | t-test |
|---|---|---|---|---|
| Debtmat | 0.2895 | 0.2739 | 0.0156 | 6.2406*** |
This table presents the mean value of debt maturity for the startup and non-startup groups.
Table 4 shows debt maturity structures by activity sector, differentiating between startup and non-startup firms. We can see that in all the sectors, newly created firms are financed with short-term debt to a greater extent. We can also see that, on average, firms have longer debt maturity in the services sector and the agriculture, livestock, and fishing sectors. In Table 5, we present the debt maturity of newly created firms by age, with age zero for firms in their first year of life and age 3 for those in their fourth year of life.
Table 4. Debt maturity structure by activity sector
| Agriculture, livestock, and fishing | Manufacturing | Construction | Wholesale and retail trade | Services | |
|---|---|---|---|---|---|
| Total sample | 0.3446 | 0.2788 | 0.2458 | 0.2747 | 0.3645 |
| Startup | 0.3377 | 0.2479 | 0.2153 | 0.2628 | 0.3531 |
| Non-startup | 0.3451 | 0.2800 | 0.2474 | 0.2753 | 0.3653 |
This table presents average debt maturity by activity sector.
Table 6 presents the correlation matrix of the variables used to determine debt maturity structures.
Table 5. Debt maturity of newly created firms by age
| Debt maturity | 0 years old | 1 year old | 2 years old | 3 years old |
|---|---|---|---|---|
| Startup firms | 0.2670 | 0.2689 | 0.2712 | 0.2786 |
Debt maturity is measured as the ratio of long-term debt to total debt. 0 years old refers to the first year of life and 3 years old to the fourth year of life.
Table 6. Correlation matrix
| Debtmat | StartupDummy | Size | Growth | Assetmat | Term | Taxes | Z score | TotalDebt | |
|---|---|---|---|---|---|---|---|---|---|
| Debtmat | 1,0000 | ||||||||
| StartupDummy | -0.0155 *** | 1,0000 | |||||||
| Size | -0.1633 *** | -0.0903*** | 1,0000 | ||||||
| Growth | -0.0520 *** | 0.1008*** | 0.0745*** | 1,0000 | |||||
| Assetmat | 0.1979*** | -0.0552*** | -0.0310*** | -0.0159*** | 1,0000 | ||||
| Term | -0.0769*** | -0.0012 | 0.0212*** | 0.0078*** | -0.0126*** | 1,0000 | |||
| Taxes | -0.0394*** | -0.0084*** | -0.0247*** | -0.0225*** | 0.0189*** | -0.0082*** | 1,0000 | ||
| Z score | -0.2718*** | -0.0613*** | 0.1151*** | 0.0069*** | -0.1505*** | -0.0287*** | -0.0458*** | 1,0000 | |
| TotalDebt | 0.0754 *** | 0.1386*** | -0.0192*** | 0.0985*** | -0.0097*** | 0.0045* | 0.0761*** | -0.7156*** | 1,0000 |
Debtmat is the ratio between long-term debt and total debt. StartupDummy is a dummy variable that takes the value of 1 for recently created companies and 0 otherwise. Size is the natural logarithm of sales. Growth is sales growth. Assetmat is the ratio between fixed assets and their depreciation. Term is the difference between the yield on a ten-year Spanish Treasury bond and the yield on a twelve-month Spanish T-bill. Taxes is the quotient between taxes and profit before taxes. Z score is the re-estimation of Altman's (1968) Z score by Begley et al. (1996). TotalDebt is the ratio between total debt and total assets. ***,** and, * indicate significance at 1%, 5%, and 10%, respectively.
6. Results
6.1. Determinants of debt maturity structure
This section examines whether the debt maturity structure of newly created firms differs from that of older firms. We carry out a multivariate analysis to analyze debt maturity by controlling for its determinants. Specifically, we estimate the model (1) described in Section 4.2. The results are presented in column (1) of Table 73. As indicated above, StartupDummy is a dummy variable that takes the value of 1 for recently created firms and 0 otherwise. The coefficient of the variable StartupDummy is negative and significant, indicating that the debt maturity structure is lower in newly created firms. These firms, therefore, use short-term debt to a greater extent. This may be due to the fact that, as we have seen, startups have bigger information asymmetries and agency conflicts, so they could find it more difficult to access long-term debt.
Table 7. Debt maturity structure determinants
| (1) | (2) | |
|---|---|---|
| StartupDummy | -0.0201*** (-8.40) | -0.0236*** (-9.88) |
| Size | -0.0310*** (-16.21) | -0.0446*** (-25.93) |
| Growth | -0.0377*** (-19.52) | -0.0421*** (-21.94) |
| Assetmat | 0.0022*** (37.68) | 0.0023*** (39.92) |
| Term | -0.0396*** (-60.33) | -0.0419*** (-64.35) |
| Taxes | -0.0180*** (-4.11) | -0.0180*** (-4.10) |
| Z score | 0.1325*** (9.92) | |
| Z score2 | -0.2148*** (-23.87) | |
| TotalDebt | 0.1837*** (19.94) | 0.3467*** (78.28) |
| Constant | 0.5336*** (31.32) | 0.5345*** (31.80) |
| Time dummies | YES | YES |
| Industry dummies | YES | YES |
| R2 | 0.1654 | 0.1582 |
| P-Hausman | 0.0000 | 0.0000 |
| Observations | 161,243 | 161,243 |
The dependent variable is debt maturity (Debtmat), calculated as the ratio between long-term debt and total debt. StartupDummy is a dummy variable that takes the value of 1 for recently created companies and 0 otherwise. Size is the natural logarithm of sales. Growth reflects growth opportunities, measured as sales growth. Asset maturity (Assetmat) is the ratio between fixed assets and their amortization. Term is the differential of interest rates. Taxes is the ratio between taxes and profit before taxes. Z score measures default risk and is calculated as the re-estimation of Altman's (1968) model by Begley et al. (1996). TotalDebt is the quotient between total debt and total assets. ***,** and * indicate significance at 1%, 5%, and 10%, respectively. The t Statistic is in brackets.
Lenders may prefer to offer these firms short-term loans since this type of financing gives them more flexibility to cancel the contracts or change credit terms. The greater flexibility of short-term debt is especially important for lenders to firms in their first years of life, as they will not have enough information about these firms until several years have passed.
Regarding the rest of the variables, we find that larger firms use more short-term debt. This is contrary to the expected result that smaller firms with more information asymmetries would use more short-term debt. However, it should be noted that this may be because our sample is comprised of small firms. In terms of growth opportunities, we observe that firms with more opportunities use more short-term debt, which is consistent with the results observed in other studies (Barclay & Smith, 1995; Ozkan, 2000; García-Teruel & Martínez-Solano, 2007; González, 2013; López-Gracia & Mestre-Barberá, 2015; Díaz-Díaz et al., 2016; among others). Firms with more growth opportunities have higher agency costs, so lenders could offer these companies loans with shorter maturities, allowing them to renegotiate the terms of the contracts more often (Díaz-Díaz et al., 2016).
The coefficient of the asset maturity variable is positive and significant, indicating that firms coordinate debt maturity with the maturity of their assets. This supports the maturity-matching hypothesis. As in other studies, we observe that the relationship between the effective tax rate and debt maturity structure is negative and significant. We also obtain an inverted U-shaped relationship between default risk and debt maturity. Finally, we find a positive relationship between levels of indebtedness and debt maturity. Authors such as Stohs & Mauer (1996), Scherr & Hulburt (2001), González (2015), and Casino-Martínez et al. (2019) also found that highly indebted firms use more long-term debt. In the case of Spain, García-Teruel & Martínez-Solano (2007), López-Gracia & Mestre-Barberá (2015), and Díaz-Díaz et al. (2016) observed that the most indebted firms have longer debt maturity. These firms may prefer financing with long-term debt to control their higher financial risk (Diamond, 1993).
Given that the correlation between the Z score and TotalDebt variables is high and may result in a multicollinearity problem, we estimate the model without including the variable Z score and its square in column (2). The results hold for all the variables.
Having established that new or recently created firms have debt with shorter maturities than older firms, we analyze whether this result is maintained in times of financial crisis. To do this, we estimate model (2) described in Section 4.2. The results, which are presented in Table 8, indicate that during times of crisis, startups also have debt with shorter maturities than firms with longer histories.
Table 8. Effects of crisis periods on debt maturity structure
| (1) | (2) | |
|---|---|---|
| StartupDummy | -0.0175*** (-5.58) | -0.0207*** (-6.58) |
| Crisis | -0.0043*** (-2.71) | -0.0065*** (-4.03) |
| Crisis x StartupDummy | -0.0055 (-1.24) | -0.0064 (-1.42) |
| Size | -0.0311*** (-16.24) | -0.0447*** (-25.96) |
| Growth | -0.0376*** (-19.50) | -0.0421*** (-21.92) |
| Assetmat | 0.0022*** (37.68) | 0.0023*** (39.93) |
| Term | -0.0012* (-1.78) | -0.0007 (-1.05) |
| Taxes | -0.0180*** (-4.11) | -0.0180*** (-4.10) |
| Z score | 0.1324*** (9.91) | |
| Z score2 | -0.2148*** (-23.86) | |
| TotalDebt- | 0.1838*** (19.95) | 0.3468*** (78.30) |
| Constant | 0.4146*** (24.68) | 0.4087*** (24.74) |
| Time dummies | YES | YES |
| Industry dummies | YES | YES |
| R2 | 0.1654 | 0.1582 |
| P-Hausman | 0.0000 | 0.0000 |
| Observations | 161,243 | 161,243 |
The dependent variable is debt maturity (Debtmat), calculated as the ratio between long-term debt and total debt. StartupDummy is a dummy variable that takes the value of 1 for recently created companies and 0 otherwise. Crisis is a dummy variable that takes the value of 1 during the period of financial crisis and zero otherwise. Size is the natural logarithm of sales. Growth reflects growth opportunities, measured as sales growth. Asset maturity (Assetmat) is the ratio between fixed assets and their amortization. Term is the differential of interest rates. Taxes is the ratio between taxes and profit before taxes. Z score measures default risk and is calculated as the re-estimation of Altman's (1968) model by Begley et al. (1996). TotalDebt is the quotient between total debt and total assets. ***,** and * indicate significance at 1%, 5%, and 10%, respectively. The t Statistic is in brackets.
6.2. Robustness
Table 9. Robustness: Determinants of debt maturity structure and the effect of the crisis on debt maturity
| (1) | (2) | (3) | (4) | |
|---|---|---|---|---|
| StartupDummy | -0.0083** (-2.51) | -0.0105** (-2.32) | -0.0147*** (-6.19) | -0.0129*** (-4.10) |
| Crisis | -0.0903*** (-37.62) | -0.0027* (-1.74) | ||
| Crisis x StartupDummy | 0.0043 (0.72) | -0.0039 (-0.88) | ||
| Size | 0.0121*** (4.23) | 0.0122*** (4.25) | ||
| Growth | -0.0133*** (-5.12) | -0.0133*** (-5.13) | ||
| Assetmat | 0.0013*** (16.07) | 0.0013*** (16.06) | ||
| Term | -0.0431*** (-45.11) | -0.0041*** (-5.15) | -0.0360*** (-58.38) | -0.0004 (-0.67) |
| Taxes | -0.0171*** (-2.86) | -0.0171*** (-2.86) | -0.0174*** (-3.94) | -0.0174*** (-3.95) |
| Z score | -0.1977*** (-10.27) | -0.1975*** (-10.26) | -0.0589*** (-4.95) | -0.0590*** (-4.96) |
| Z score2 | 0.0254** (1.96) | 0.0253* (1.95) | -0.1983*** (-21.99) | -0.1983*** (-21.98) |
| TotalDebt- | 0.0565*** (4.26) | 0.0565*** (4.26) | -0.2408*** (23.73) | -0.2408*** (-23.73) |
| Constant | 0.3978*** (16.23) | 0.3626*** (14.96) | 0.6758*** (55.62) | 0.5642*** (45.99) |
| Time dummies | YES | YES | YES | YES |
| Industry dummies | YES | YES | YES | YES |
| R2 | 0.1343 | 0.1344 | 0.1526 | 0.1526 |
| P-Hausman | 0.0000 | 0.0000 | 0.0000 | 0.0000 |
| Observations | 96,778 | 96,778 | 161,243 | 161,243 |
The dependent variable is debt maturity (Debtmat), calculated as the ratio between long-term debt and total debt. StartupDummy is a dummy variable that takes the value of 1 for recently created companies and 0 otherwise. Size is the natural logarithm of sales. Growth reflects growth opportunities, measured as sales growth. Asset maturity (Assetmat) is the ratio between fixed assets and their amortization. Term is the differential of interest rates. Taxes is the ratio between taxes and profit before taxes. Z score measures default risk and is calculated as the re-estimation of Altman's (1968) model by Begley et al. (1996). TotalDebt is the quotient between total debt and total assets in columns (1) and (2), and it is instrumented by profitability, growth opportunities, tangible assets, and size in columns (3) and (4). ***,** and * indicate significance at 1%, 5%, and 10%, respectively. The t Statistic is in brackets.
We control for potential endogeneity problems in this section. Specifically, following González (2015), we first estimate the model with all the independent firm-level variables lagged by one year (Columns (1) and (2) of Table 8). As can be seen, we again find that the debt maturity structure is lower in recently created firms. We next control for the potential endogeneity problems related to variable leverage. To do this, we replace the leverage variable with its predicted values by using traditional determinants of capital structure, namely, profitability, growth opportunities, tangible assets, and size (Columns (3) and (4) of Table 8). Again, the results remain similar.
7. Conclusions
This work analyzes debt maturity structures for a sample of small Spanish firms during the period 2011-2020, differentiating between startup and non-startup firms. Unlike the rest of the studies on recently created firms, this is the first to analyze a sample of firms including both startups and established firms. This has permitted us to compare these two groups. The period of time considered in this study has allowed us to analyze both a crisis and a non-crisis period. The results show that recently created firms have debt with shorter maturities than firms with longer trajectories, which may be due to greater information asymmetries and agency conflicts. Lenders may prefer to offer short-term loans to startups due to the greater flexibility this funding source provides. With these types of loans, lenders may see the need to cancel the contracts or change the terms of credit since they will not have enough information about these firms until several years have passed.
The results obtained concerning the determinants of debt maturity structure are in line with those previously found in other studies.
These results are of interest to startup firms since they show the difficulty these firms have obtaining long-term financing due to increased information asymmetries. These firms need to make a greater effort to reduce information asymmetries if they want to obtain debt with longer maturity periods. Our results could be relevant not only for Spanish firms but also for all firms operating in countries with bank-dominated capital markets.