Political Connections and Readability of Financial Statements: Evidence from China
ABSTRACT
High-quality information disclosure improves the accuracy of investors' judgment and efficiency in resource allocation. With a focus on the readability of information disclosed, this study analyzes how political connections affect the readability of financial statements by taking A-share private-owned companies listed on Shanghai and Shenzhen Stock Exchanges as research sample from 2008 to 2019. We use ordinary least squares model and moderating effect model as our main methodology. A series of robustness tests are also carried out. Our research finds that companies with political connections are more likely to issue less readable financial statements. This negative impact is diminished for the firms with a higher marketization level, better corporate governance, and greater analyst coverage. Further research on the economic consequences demonstrates that political connections would weaken the positive effect of the readability of financial statements on the firm's future market value. This study enriches the research on the factors influencing the readability of financial statements and reveals the economic consequences of political connections in terms of textual information disclosure quality. It is therefore an important reference for regulatory authorities to formulate guidelines on text information disclosure and supervise the compliance of politically affiliated enterprises, while facilitating listed companies to enhance the readability of their financial statements.
Keywords: Political connections; Readability of financial statements; Text analysis; Information disclosure; Corporate governance.
JEL classification: G32; G38; M21; M41.
Conexiones políticas y comprensibilidad de los estados financieros: Datos de China
RESUMEN
La divulgación de información de alta calidad mejora la precisión del juicio de los inversores y la eficiencia en la asignación de recursos. Centrándose en la comprensibilidad de la información divulgada, este estudio analiza cómo las conexiones políticas afectan a la comprensibilidad de los estados financieros tomando como muestra de investigación las empresas privadas de acciones A cotizadas en las bolsas de Shanghái y Shenzhen entre 2008 y 2019. Utilizamos el modelo de mínimos cuadrados ordinarios y el modelo de efecto moderador como metodología principal. También se llevan a cabo una serie de pruebas de robustez. Nuestra investigación encuentra que las empresas con conexiones políticas son más propensas a emitir estados financieros menos comprensibles. Este efecto negativo disminuye en las empresas con mayor nivel de comercialización, mejor gobierno corporativo y mayor cobertura de los analistas. Otras investigaciones sobre las consecuencias económicas demuestran que las conexiones políticas debilitarían el efecto positivo de la comprensibilidad de los estados financieros sobre el futuro valor de mercado de la empresa. Este estudio enriquece la investigación sobre los factores que influyen en la legibilidad de los estados financieros y revela las consecuencias económicas de las conexiones políticas en términos de calidad de la divulgación de información textual. Por lo tanto, constituye una referencia importante para que las autoridades reguladoras formulen directrices sobre la divulgación de información textual y supervisen el cumplimiento de las empresas con conexiones políticas, al tiempo que facilita a las empresas cotizadas en bolsa la mejora de la legibilidad de sus estados financieros.
Palabras clave: Conexiones políticas; Legibilidad de los estados financieros; Análisis de textos; Divulgación de información; Gobierno corporativo.
Códigos JEL: G32; G38; M21; M41.
1. Introduction
High-quality information disclosure can improve the accuracy of investors’ prediction, reduce the market information asymmetry, and maintain capital markets’ stability (Loughran & McDonald, 2014; Hasan & Omar, 2015). Generally, information disclosure can be divided into standardized data information disclosure and non-standardized text information disclosure (Lo et al., 2017). Compared with numerical information, text information is with high concealment features and thus easy to be manipulated. With opportunistic behavior, the management would consciously manipulate the readability of text information (Li, 2008) to mislead judgments by investors, shareholders, governments and other stakeholders on their companies' financial performance, thus reducing the efficiency of resource allocation and increasing the risk of stock prices’ crash (Kim et al., 2019). Therefore, exploring the readability of text information disclosure and analyzing the main influencing factors are important, which is benefit to standardize the firm’s information disclosure behavior and keep sustainable development of capital markets.
Corporate political connections have been a hot research topic for more than a decade (Preuss & Königsgruber, 2021). Reflecting the relationship between corporate executives and government officials, political connections have a fundamental purpose of seeking certain economic benefits (Liu et al., 2019). Political relations affect resource allocation patterns in the macroeconomy as well as decision-making behavior of enterprises. However, the existing literature has controversy on the impact of political connections on companies (Xu et al., 2022). Some studies have shown that political connections help companies obtain tax relief (Adhikari et al., 2006; Bertrand et al., 2018; Bona-Sánchez et al., 2020), acquire financing facilities (Chen et al., 2017), enjoy governmental subsidies (Faccio et al., 2006; Acemoglu et al., 2016), and alleviate the impact of negative news reports (Yu et al., 2015). But some other studies have indicated that political connections encourage enterprises to assume such responsibilities as social assistance (Tian & Zhang, 2013), thus easily leading to enterprises’ excessive investment (Yuan et al., 2015). Meanwhile, the management with political connections is likely to manipulate the readability of the text information in financial statements (Botosan, 1997). The causal relation between firms’ political connections and the annual report quality is ambiguous (Preuss & Königsgruber, 2021). On the one hand, companies with political connections may be subject to more government supervision, therefore getting more likely to publish high-quality accounting information. On the other hand, such political connections may replace the resource allocation functions of the accounting information mechanism and thus reduce the accounting information quality.
Since the related Chinese regulation only mentions “to encourage companies to disclose information to investors, especially to small- and medium-sized investors, in a concise and understandable way1”, executives of the listed companies are thus inclined to express their opinions on the main content of financial statements, enabling political connections to easily affect the corporate information disclosure behavior. This study takes China as the research background for the following reasons. First, political connections play an important role in economic activities, especially in emerging markets with weaker investor protection and greater government interventions (Faccio, 2006; Fan et al., 2007; Claessens et al., 2008). China, as the largest emerging market, has a different institutional environment from that of the developed countries with weaker protection for shareholders (La Porta et al., 2000). The Chinese government intervenes resource allocation of transitional economies, which has led to a common phenomenon of firms keen to establish their own relationships with the government in search of benefits and political connections. The Chinese institutional context therefore provides an ideal backdrop for studying the impact of political relationships on the financial statements’ readability. Furthermore, as the Chinese economy has a significant impact on global economy growth, our findings have important practical implications for other emerging markets. Second, Chinese is more flexible than other languages, and management has more scope for language management in corporate annual reports. In addition, the semantics of Chinese are more subtle and obscure than English, making it more difficult to interpret the information in the text of financial statements. Studying Chinese financial statements is therefore instructive in identifying factors affecting readability of annual reports provided in other languages, which provides a new perspective for global investors to understand non-English annual reports. Third, with the further opening up of China's capital market, such as the policies of Shanghai-Hongkong and Shanghai-London Stock Connection, more foreign investors are willing to invest in China's capital market. Understanding the influence of political connections on financial reports’ readability would provide important guidelines for foreign investors.
By focusing on private-owned companies and taking the research samples of A-share listed companies in Shanghai and Shenzhen Stock Exchanges from 2008 to 2019, this study adopts text analysis technology to investigate the impact of executives’ political connections on the readability of corporate financial statements. It finds that political connections can reduce the financial statements’ readability, but such negative impact would be weakened in firms that are operated at a higher marketization level with better corporate governance and wider analyst coverage. Further research on the economic consequences shows that political connections may diminish the positive effect of readability on the future market value of enterprises.
The contribution of this study is mainly demonstrated in the four aspects. First, this study expands the scope of factors affecting the readability of financial statements. Previous researches on readability have found that corporate performance (Li, 2008), policies and regulations (Lang & Stice-Lawrence, 2015), earnings management (Ajina et al., 2016; Lo et al., 2017), annual report storage space (Loughran & McDonald, 2014), and political corruption (Xu et al., 2020) affect the readability of financial statements. However, this study finds that the political connections of executives also affect the readability, which enriches the understanding of the influencing factors from the view of social capital. Second, this study reveals the economic consequences of political connections through textual information disclosure quality. Different from the existing literature, which pays more attention to the financial data disclosure (Chaney et al., 2011; Harymawan & Nowland, 2016; Preuss & Königsgruber, 2021; Arcas-Pellicer et al., 2022), this study focuses on the influence of textual information’s disclosure. Third, this study contributes to the literature related to emerging markets. Research on emerging markets mainly focuses on corporate performance (Ciftci et al., 2019; Espinosa-Méndez & Jara, 2021), environmental performance (Gallego-Álvarez et al., 2018; Zahoor & Gerged, 2021), environmental information disclosure (Jacoby et al., 2019), mergers and acquisitions (Pillay et al., 2021; Yen & Andre, 2019) and the risk-taking (Tran, 2022). This study expands the research on information disclosure and economic consequences in emerging markets by examining the influence of political connections on textual information disclosure. Furthermore, it provides a new perspective for improving the capital efficiency in emerging markets. Fourth, the conclusion of this study offers certain practical references. At present, regulations on information disclosure both in China and other emerging market countries fail to set forth clear requirements on text information’s disclosure. This study would try to provide an important reference for the regulatory authorities to formulate guidelines for disclosure of text information, so as to supervise the compliance of politically affiliated enterprises and guide listed companies to improve the financial statements’ readability. With the convergence between Chinese and international accounting standards, the conclusion of this study would provide a reference for European markets’ investors to explore the quality of corporate annual reports there.
2. Literature Review and Hypothesis Development
2.1. The readability of the financial statements
The readability of financial statements refers to the objective difficulty encountered when investors read the textual accounting information contained in annual financial reports (Courtis, 1995). The current research on the readability of financial statements mainly focuses on three dimensions. First, the measure of the readability of financial statements, mainly based on two paths: One path is to examine the complexity of the semantics of text words, mainly by using Fog and Flesch indexes (Miller, 2010; Lo et al., 2017), which are generally based on the proportion of difficult words and average sentence length. For example, all words with more than three syllables are classified as complex. The other path is to directly use the sizes of annual reports for measurement, and this is more objective. Loughran & McDonald (2014) have used annual report storage space to measure the financial statements’ readability, finding that the larger the storage space, the lower the readability. If companies want to conceal their earnings management behavior, they prefer increase the disclosure of non-critical information, leading to a result that investors cannot distinguish the importance of related information (Bloomfield et al., 2015). Based on word counts, character counts and page counts of annual reports, Luo et al. (2018) have measured the readability, finding that high readability can help improve corporate transparency and lower corporate agency costs.
Second, the factors affecting the readability of financial statements. Management's self-interested motivation has received widespread attention (Li, 2008; Loughran & McDonald, 2014). When the corporate financial performance is not good, the management may add more professional words in their financial statements, so as to cover up the problems (Li, 2008). And the management can achieve the purpose of hiding or obscuring information by redundant disclosure (Loughran & McDonald, 2014). Besides, business strategy makes a difference in the readability of narrative disclosures (Habib & Hasan, 2020). Noh (2021) discovered that the cultural tightness would positively affect the firm’s financial statement’s readability.
Third, the economic consequences of the financial statements’ readability. Hesarzadeh et al. (2020) decomposed readability into its discretionary and innate components, and found that discretionary readability has a weaker uncertainty effect than innate readability. When a company discloses an annual report with less readable text information, the company's information environment will get deteriorated. In this situation, the degree of information asymmetry faced by investors will go up, thus lowering the valuation judgment of the company (Rennekamp, 2012), reducing the company’s stock trading volume (Miller, 2010; Hwang & Kim, 2017), and demanding higher risk premiums (Ertugrul et al., 2017; Bonsall et al., 2017). Since financial statements with little textual information cannot provide investors with sufficient decision-making information, investors would have further demand for external information (Asay et al., 2017). Furthermore, weak readability of financial statements may raise a company's equity financing costs (Rjiba et al., 2021), reduce trade credits from suppliers (Xu et al., 2020), aggravate the workload of auditors (Blanco et al., 2021), and trigger more frequent analyst tracking (Lehavy et al., 2011). However, there are few literatures on the influence of senior executives’ political background on the readability of financial statements.
2.2. Hypotheses Development
Political connections can produce resource benefits (Villiers et al., 2011; Yu et al., 2015; Acemoglu et al., 2016; Chen et al., 2017; Preuss & Königsgruber, 2021), which would in turn help enterprises ease financing constraints, mitigate litigation risks and enjoy preferential policies. For example, Bona-Sánchez et al. (2020) found that companies with political connections can reduce tax burden and gain tax avoidance advantage. On the other side, however, such resource benefits may diminish the readability of financial statements. Political connections reflect the relationship between corporate executives and government officials, with the fundamental purpose of seeking certain economic advantages (Liu et al., 2019; Preuss & Königsgruber, 2021). Therefore, the political connections contain a high degree of potential private information and the corresponding rent-seeking meanings. Specifically, the benefits generated from political connections are largely obtained from private informal channels through executives’ relationships with government officials (Chen et al., 2011). But such benefits are often illegal and, in many cases, at the cost of the potential loss of other economic entities, so this process has a very distinctive feature of collusion (Jiang et al., 2009). Besides, political connections are a kind of valuable resources. For their own survival and future development, many corporate executives try to take rent-seeking methods to form alliances with government officials and establish a favorable political environment. Nevertheless, enterprises with political connections have to compensate the government officials who have used their political influence to secure such benefits, but such compensation is rarely delivered publicly. The collusion feature of political connections means that the biggest beneficiaries are mainly the politically connected executives and relevant government officials, rather than external investors, so the rent-seeking income brought by political connections is inherently non-public in relational transactions (Tang et al., 2011). Therefore, political connections can be regarded as an implicit contract between corporate executives and government officials to help both sides obtain benefits.
However, in the principle of full disclosure, the acquisition and transfer of political rent-seeking income, as an economic matter, needs to be publicized in the financial reports of enterprises. The activities that corporate executives use political connections to engage are conducted in private and exist only in a gray area of the system (Shleifer & Vishny, 1993). Obviously, neither business executives nor government officials are willing to disclose relevant sensitive information, which becomes the focus of attention of external investors and regulatory bodies and increases the risk of collusion behavior being exposed (Preuss & Königsgruber, 2021). Therefore, the companies with political connections will face high cost in providing high-quality information disclosure. When a company has political connections, its rational decision is to reduce the transparency of related information. Among the information documents disclosed by such a company, the annual reports would provide the most important source of market information (Botosan et al., 1997). The content of annual reports is mostly textual information, which is difficult to be quantified and standardized as compared with numerical information. Therefore, the deployment of complex text for information disclosure becomes one of the most convenient and least costly ways for enterprises to conceal the true messages. Enterprises with political connections have the motivation to manipulate their annual reports for text information management, that is, to artificially reduce the readability of annual reports’ text information, thereby interfering with investors’ understanding and application of the information (Li, 2008; Rennekamp, 2012), so as to cover their gains from political rent-seeking actions. Therefore, the first hypothesis is proposed:
H1: Managerial political connections reduce the readability of financial statements.
China's marketization process has accelerated since its reform and opening-up. However, there are still large marketization differences across different regions. In areas with low marketization, e.g., those with high degree of government intervention, incomplete legal systems and inefficient protection of property rights, enterprises tend to exploit social relations to reduce their transaction costs and obtain certain growth resources (Chen et al., 2013). In such market environment, private-owned companies are willing to engage in rent-seeking activities via political connections (Faccio, 2006; Liu et al., 2013). In contrast, regions with a higher degree of marketization can often provide lower market transaction costs, stronger external supervision, and weaker information asymmetry (Liu et al., 2013), thus raising the risk of collusions with government officials being exposed and making it a less effective trick to cover up political rent-seeking moves by reducing financial statements’ readability. A high level of external auditing can improve information transparency in public administrations and reduce the corruption cases (Benito et al., 2019; Vela-Bargues et al., 2022). Therefore, higher level of marketization may narrow down the space for private-owned enterprises to seek rents through political connections, thus alleviating the negative impact of on the financial statements’ readability. Therefore, the second hypothesis is proposed:
H2: The higher the degree of marketization, the weaker the relationship between managerial political connections and the readability of financial statements.
In a decision-making environment where the two powers are separated, managers have the motivation and ability to manipulate and hinder information disclosure (De Angelo, 1988; Defond & Park, 1997). For example, managers can opportunistically choose certain benchmarks to exaggerate earnings growth (Schrand & Walther, 2000). Text information can also be used as a tool for managerial self-interest (Schipper, 1989). Managers can manipulate the readability of text information to hide bad news (Courtis, 1998; Li, 2008). Meanwhile, firms under good corporate governance would provide more corporate information for small and medium shareholders in the market and reduce the agent costs (Zhang et al., 2014). Arcas-Pellicer et al. (2022) found that high ratio of independent directors and women on the boards can reduce the abnormal accruals. In a word, higher degree of corporate governance can actively boost the comprehensibility of financial statements and address the problem of information asymmetry. Therefore, the third hypothesis is given as below:
H3: The better the corporate governance, the weaker the relationship between managerial political connections and the readability of financial statements.
Analysts own the professional ability of interpreting information, and become a link between management and investors, thus reducing the cost of information search and analysis by investors and improving the efficiency of resource allocation (Ma et al., 2019). Analysts perform the external supervision functions, which means that with closer inspection by analysts, companies’ earnings management behavior would be inhibited more deeply (Yu, 2008; Degeorge et al, 2013). Specifically, analysts can get to know a company through alternative channels, such as internal interviews, and distribute valuable information to capital market to attract more investors’ attention, which would bring external pressure on the enterprise’s information disclosure, thus forcing it to actively reduce the information asymmetry and improve the financial statements’ readability. Therefore, the fourth hypothesis is given as follows:
H4: The more the analyst coverage, the weaker the relationship between managerial political connections and the readability of financial statements.
3. Methodology
3.1. Data and sample
This study takes the annual financial statements of private-owned listed companies in A-share Shanghai and Shenzhen Stock Exchanges from 2008 to 2019 as the research sample. The data on are retrieved from the China Stock Market and Accounting Research database. The samples are then filtered in the following process: (1) delete the samples in financial and insurance industries; (2) remove the Special Treatment companies, because they were under abnormal financial situations; (3) delete the samples with variables having missing values; (4) winsorise the continuous variables at the 1st and 99th percentiles. Finally, the samples include total 12,731 observations.
3.2. Variable Construction
3.2.1. Readability of financial statements
At present, most researches on the readability of financial statements are made for enterprises in English-speaking countries. The FOG and Flesch indexes are usually used to measure the readability based on the length of text, the number of paragraphs, the number of sentences, the number of characters, and the quantity of professional terms (Lo et al., 2017; Hwang & Kim, 2017). However, the core problem with the Fog index is to determine complex vocabulary. As English is alphabetic, we can use the number of letters in a word to measure the complexity of the word to a certain extent. However, Chinese as a hieroglyphic language does not naturally have such conditions, and therefore this measurement method cannot be directly replicated in the Chinese context (Xu et al., 2019). The linguistic situation in Chinese has not yet developed a uniform understanding of the definition of complex words, and it lacks authoritative definition. Therefore, Fog index is not used to measure the readability of the Chinese financial statements.
The magnitude of information disclosed in annual reports is directly reflected in the length (Luo et al., 2018). Long financial statements are unlikely to arouse the reading interest of users, particularly with the shallow reading networks and massive information (Loughran & McDonald, 2014; Bloomfield et al., 2015; Luo et al., 2018). The content of financial statements is relatively difficult to comprehend. Therefore, the longer the text information in an annual report, the higher the cost for stakeholders to process and obtain relevant information, and the lower the readability of the text information.
According to Luo et al. (2018), we take the length of Chinese financial statements to measure readability by using three independent variables: Pages, Words and Sentences. Specifically, Python is used to analyze the PDF version of the annual reports, extract their contents and saves them in files in TXT format; and then programming is used to obtain Pages, Words and Sentences to measure the readability. Except for Pages data, which is retrieved from the PDF version, the other two indicators are obtained by extracting the annual reports in TXT format. For better understanding and interpretation, this study standardizes the above variables. Take Pages as an example: first, this study calculates the number of pages (N) of each annual report, and then use the maximum and minimum values of the entire sample period (1/ln(N)) to non-dimensionalize2 the number of annual reports’ pages, thus generating the indicator Readablity1. This study also uses the same method to non-dimensionalize Words to generate the indicator Readablity2 and non-dimensionalize Sentence to generate the indicator Readablity3. The greater the values of Readablity1, Readablity2 and Readablity3 of a financial statement, the higher its readability.
3.2.2. Political connections
We use a dummy variable Political to indicate whether there are political connections between corporate executives and governmental officials. Generally, the management of Chinese companies has a top leader for obvious core roles. Therefore, this study takes chairpersons and general managers who actually make decision as the research object, so as to catch the characteristics of corporate political connections. According to Faccio (2006) and Yuan (2015), if at least one of the chairpersons or general managers has served or is currently serving as a representative of the communist party, a member in the People’s Congress, a government official, or a member in the Chinese People's Political Consultative Conference (CPPCC), the company will be considered to have political connections; then, political equals to 1; otherwise, it equals to 0.
3.2.3. Moderating variables
This study constructs three moderating variables: the degree of marketization (Marketscore), the index of corporate governance (CG_index), and analyst coverage (Analyst). First, the marketization index as proposed by Wang et al. (2017) is applied to measure the marketization level of a province. This index measures the synthesis score of the following five aspects: “the relationship between the government and the market”, “the development of non-state economy”, “product market development”, “development of factor market” and “market intermediary organizations and the legal system environment”. Second, referring to the method of Gompers et al. (2003), this study measure the level of corporate governance by the 12 indexes below: (1) the largest shareholder's ratio of shares; (2) state-owned shareholding ratio; (3) the number of supervisory meetings; (4) the board size; (5) the number of shareholder meetings; (6) the number of board meetings; (7) the ratio of the shares held by the second to the fifth largest shareholders divided by the largest shareholding ratio; (8) whether Chairperson also serves as CEO; (9) the number of committees; (10) outstanding shareholding ratio; (11) the management shareholding ratio; (12) the ratio of independent directors. By finding the linear combination of all indicators to maximize the description of the change in corporate governance, this study takes the first principal component score as CG_index. Finally, following Luo et al. (2018), we take the natural logarithm number of the analyst coverage to listed firm as Analyst.
3.3. Research design
In order to test hypotheses H1 to H4, this study constructs the following four regression models in sequence:
\[\begin{equation} \label{eq1} \small \begin{split} Readability_{i,t}& = \alpha_{0} + \alpha_{1} Political_{i,t} + \sum Controls_{i,t} \hspace{1cm}\\ & + \sum Year + \sum Ind + \varepsilon_{i,t} \end{split} \ \ \ \ \ (1) \end{equation}\] \[\begin{equation} \label{eq2} \small \begin{split} Read& ability_{i,t}= \beta_{0} + \beta_{1} Political_{i,t}\\ & + \beta_{2}{ Marketscore_{i,t} \times Political}_{i,t} + Marketscore_{i,t} \hspace{0.5cm}\\ & + \sum Controls_{i,t} + \sum Year + \sum Ind + \varepsilon_{i,t} \end{split} \ \ \ \ \ (2) \end{equation}\] \[\begin{equation} \label{eq3} \small \begin{split} Read& ablility_{i,t} = \gamma_{0} + \gamma_{1} Political_{i,t}\\ & + \gamma_{2}{CG\_index}_{i,t} \times Political_{i,t} + \gamma_{3} CG\_index_{i,t} \hspace{0.8cm}\\ & + \sum Controls_{i,t} + \sum Year + \sum Ind + \varepsilon_{i,t} \end{split} \ \ \ \ \ (3) \end{equation}\] \[\begin{equation} \label{eq4} \small \begin{split} Read& ability_{i,t}= \delta_{0} + \delta_{1} Political_{i,t}\\ & + \delta_{2} Analyst_{i,t} \times Political_{i,t} + \delta_{3} Analyst_{i,t} \hspace{0.8cm}\\ & + \sum Controls_{i,t} + \sum Year + \sum Ind + \varepsilon_{i,t} \end{split} \ \ \ \ \ (4) \end{equation}\]where Control represents control variables. Referring to Lo et al. (2017), this study adopts the following variables: return on total assets (Roa), which indicates better profitability and more readable annual reports; company size (Size), which shows that the larger the company, the more information it discloses and affects the financial statement readability; book-to-market ratio (BTM), which denotes that companies in the development stage may have more uncertain business models, leading to more complex annual reports; financial leverage (Lev); age of listing (Age) , which for older companies implies a relatively low level of information asymmetry and variable readability of the annual report; company loss (Loss), which is expressed as an incentive to make more explanations and revisions if the company suffers a loss, reducing the financial statements ‘readability; company growth (Growth); volatility of monthly stock returns (RetVol); volatility of operating earnings in the past five years (EarnVol), which means that company’s information disclosure is affected by the company’s business environment and risk; proportion of independent directors (Indep); board members (Board); whether the Chairperson also serves as CEO (Dual); and the share ratio of the top ten shareholders (Top10). We control those corporate governance factors because poor corporate governance can reduce the incentive for companies to disclose information voluntarily. At the same time, the dummy variables of industry (Ind) and time (Year) effects are also controlled. Appendix shows the more detailed definitions of these control variables.
4. Empirical Analysis
4.1. Main results
Table 1 shows the descriptive statistics of the main variables. As can be seen, the average of Political is 0.392, which indicates that 39.2% of the private-owned enterprises’ executives have some backgrounds of political connections. After the transformation by logarithm, the average of Pages, Words and Sentences become 157.433 (e5.059), 77,652.576 (e11.260) and 1342.112 (e7.202), respectively. The numbers of Pages and Words are slightly larger than those offered by Luo et al. (2018), i.e., Pages is 113.296 and Words is 65512.750, because of increase in financial reports’ length in recent years. These values indicate that these listed companies have provided generally long financial statements, so the readability has become a rising practical problem for the investors in China. The distribution of other control variables falls within a reasonable range, which is basically consistent with the findings of relevant research.
Table 2 presents the Pearson correlation among the main variables of interest. As shown in Table 2, Political is negatively and significantly correlated with Readability1, Readability2 and Readability3, providing preliminary evidence that the firms with political connections provide poorer readability reports than those without political connections.
Table 1. Descriptive Statistics
| Variables | Obs | Mean | Std | 5% | 25% | Median | 75% | 95% |
|---|---|---|---|---|---|---|---|---|
| Political | 12,731 | 0.392 | 0.488 | 0.000 | 0.000 | 0.000 | 1.000 | 1.000 |
| Readability1 | 12,731 | 12731 | 0.427 | 0.110 | 0.260 | 0.356 | 0.420 | 0.490 |
| Readability2 | 12,731 | 12731 | 0.555 | 0.111 | 0.375 | 0.480 | 0.552 | 0.627 |
| Readability3 | 12,731 | 12731 | 0.464 | 0.131 | 0.270 | 0.367 | 0.455 | 0.552 |
| lnPages | 12,731 | 5.059 | 0.233 | 4.644 | 4.927 | 5.075 | 5.209 | 5.961 |
| lnWords | 12,731 | 11.260 | 0.240 | 10.860 | 11.110 | 11.270 | 11.420 | 12.460 |
| lnSentences | 12,731 | 7.202 | 0.337 | 6.611 | 6.977 | 7.226 | 7.451 | 8.393 |
| Marketscore | 12,731 | 8.089 | 1.705 | 4.950 | 7.000 | 8.380 | 9.440 | 9.950 |
| CG index | 12,731 | 0.544 | 1.198 | -1.305 | -0.344 | 0.496 | 1.379 | 4.908 |
| Analyst | 12,731 | 1.494 | 1.162 | 0.000 | 0.000 | 1.609 | 2.485 | 4.078 |
| Roa | 12,731 | 0.034 | 0.081 | -0.078 | 0.015 | 0.039 | 0.068 | 0.220 |
| Size | 12,731 | 21.730 | 1.050 | 20.180 | 20.980 | 21.670 | 22.390 | 24.600 |
| BTM | 12,731 | 0.565 | 0.229 | 0.189 | 0.388 | 0.564 | 0.738 | 1.054 |
| Lev | 12,731 | 0.399 | 0.204 | 0.096 | 0.231 | 0.383 | 0.538 | 0.966 |
| Age | 12,731 | 1.714 | 0.884 | 0.000 | 1.099 | 1.792 | 2.398 | 3.178 |
| Loss | 12,731 | 0.139 | 0.346 | 0.000 | 0.000 | 0.000 | 0.000 | 1.000 |
| Growth | 12,731 | 0.137 | 0.352 | -0.357 | -0.013 | 0.125 | 0.271 | 1.681 |
| RetVol | 12,731 | 0.136 | 0.069 | 0.062 | 0.092 | 0.121 | 0.160 | 0.595 |
| EarnVol | 12,731 | 0.043 | 0.089 | 0.004 | 0.012 | 0.021 | 0.039 | 0.845 |
| Indep | 12,731 | 0.376 | 0.053 | 0.333 | 0.333 | 0.333 | 0.429 | 0.571 |
| Board | 12,731 | 2.094 | 0.184 | 1.609 | 1.946 | 2.197 | 2.197 | 2.485 |
| Dual | 12,731 | 0.353 | 0.478 | 0.000 | 0.000 | 0.000 | 1.000 | 1.000 |
| Top10 | 12,731 | 0.572 | 0.148 | 0.309 | 0.466 | 0.584 | 0.688 | 0.877 |
Table 2. Pearson Correlations
| 1 | 2 | 3 | 4 | 5 | 6 | 7 | 8 | 9 | 10 | 11 | 12 | 13 | 14 | 15 | 16 | 17 | 18 | 19 | 20 | VIF | |
|---|---|---|---|---|---|---|---|---|---|---|---|---|---|---|---|---|---|---|---|---|---|
| 1 Readability1 | 1 | / | |||||||||||||||||||
| 2 Readability2 | 0.880 | 1 | / | ||||||||||||||||||
| 3 Readability3 | 0.779 | 0.820 | 1 | / | |||||||||||||||||
| 4 Political | -0.003 | -0.007 | -0.002 | 1 | / | ||||||||||||||||
| 5 Marketscore | -0.231 | -0.178 | -0.176 | -0.076 | 1 | / | |||||||||||||||
| 6 CG_index | -0.202 | -0.193 | -0.269 | -0.053 | 0.114 | 1 | / | ||||||||||||||
| 7 Analyst | -0.210 | -0.205 | -0.145 | 0.056 | 0.092 | 0.045 | 1 | / | |||||||||||||
| 8 Roa | 0.011 | 0.043 | 0.029 | 0.027 | 0.027 | -0.022 | 0.370 | 1 | 2.10 | ||||||||||||
| 9 Size | -0.443 | -0.464 | -0.249 | 0.067 | 0.108 | -0.144 | 0.371 | 0.072 | 1 | 2.40 | |||||||||||
| 10 BTM | -0.126 | -0.128 | -0.044 | 0.093 | 0.030 | -0.019 | -0.067 | -0.089 | 0.476 | 1 | 2.22 | ||||||||||
| 11 Lev | -0.030 | -0.090 | 0.044 | 0.020 | -0.068 | -0.164 | -0.085 | -0.347 | 0.352 | 0.213 | 1 | 1.70 | |||||||||
| 12 Age | 0.005 | -0.071 | 0.074 | -0.064 | -0.125 | -0.279 | -0.188 | -0.189 | 0.304 | -0.040 | 0.349 | 1 | 1.95 | ||||||||
| 13 Loss | 0.071 | 0.050 | 0.047 | -0.035 | -0.072 | -0.019 | -0.291 | -0.422 | -0.136 | -0.050 | 0.241 | 0.181 | 1 | 1.74 | |||||||
| 14 Growth | -0.096 | -0.099 | -0.081 | 0.002 | 0.020 | 0.077 | 0.208 | 0.315 | 0.116 | 0.004 | -0.016 | -0.089 | -0.278 | 1 | 1.19 | ||||||
| 15 RetVol | 0.071 | 0.060 | 0.007 | -0.037 | -0.007 | 0.068 | -0.054 | -0.083 | -0.162 | -0.317 | 0.016 | -0.029 | 0.103 | 0.005 | 1 | 1.68 | |||||
| 16 EarnVol | 0.114 | 0.070 | 0.058 | -0.055 | -0.099 | -0.026 | -0.204 | -0.347 | -0.188 | -0.154 | 0.224 | 0.205 | 0.300 | -0.107 | 0.110 | 1 | 1.35 | ||||
| 17 Indep | -0.030 | -0.026 | -0.044 | -0.019 | 0.024 | 0.390 | -0.039 | -0.036 | -0.060 | -0.058 | -0.027 | -0.020 | 0.020 | -0.011 | 0.028 | 0.023 | 1 | 1.69 | |||
| 18 Board | 0.014 | 0.011 | 0.056 | 0.046 | -0.061 | -0.397 | 0.103 | 0.057 | 0.135 | 0.099 | 0.064 | 0.021 | -0.034 | 0.013 | -0.048 | -0.052 | -0.433 | 1 | 1.76 | ||
| 19 Dual | -0.055 | -0.041 | -0.069 | -0.066 | 0.101 | 0.364 | 0.038 | 0.014 | -0.073 | -0.050 | -0.086 | -0.136 | -0.008 | 0.017 | 0.011 | -0.026 | 0.117 | -0.126 | 1 | 1.06 | |
| 20 Top10 | -0.111 | -0.066 | -0.113 | 0.044 | 0.119 | 0.042 | 0.231 | 0.243 | 0.070 | 0.117 | -0.178 | -0.469 | -0.228 | 0.159 | -0.024 | -0.114 | 0.020 | -0.022 | 0.073 | 1 | 1.49 |
Note: This table reports the Pearson correlation among major variables of interest, with those significant at least the 5% level bolded. Last column reports the VIF of all variables. The VIF values are all less than 3, which means there is no serious multicollinearity problem.
Table 3 demonstrates the relationship between political connections and the financial statements’ readability. In Columns (1) to (3), the regression coefficients of Political to Readability1, Readability2 and Readability3 are -0.071, -0.066 and -0.085, which are all significantly negative at the 1% level, meaning that the political association of managers can reduce the readability of the text information. So this finding supports H1.
In terms of corporate characteristic variables, the coefficients of Size, Growth and RetVol are all significantly negative. The possible reason is that such enterprises are in a period of rapid expansion. On the one hand, the business of these enterprises is complex, so it is difficult to explain them clearly in simple language; on the other hand, such enterprises are more likely to attract competitors, so they may reduce the readability of information to avoid the important information being spied by competitors. The coefficients of both Roa and Age are significantly positive. Since the good business performance and rich experience would drive the company to actively deliver clear and positive news to the outside world. In terms of corporate governance, coefficients of Indep and Dual are significantly negative. This result shows that independent directors have not played a good role in external governance, and unreasonable corporate governance structures are not conducive to high-quality corporate information disclosure.
Table 3. Managerial political connection and the readability of financial statements
| (1) | (2) | (3) | |
|---|---|---|---|
| Readability1 | Readability2 | Readability3 | |
| Political | -0.071*** | -0.066*** | -0.085*** |
| (-5.33) | (-4.87) | (-5.57) | |
| Roa | 0.635*** | 0.846*** | 0.836*** |
| (5.65) | (7.36) | (6.46) | |
| Size | -0.374*** | -0.391*** | -0.215*** |
| (-40.28) | (-41.10) | (-20.11) | |
| BTM | 0.264*** | 0.260*** | 0.179*** |
| (6.46) | (6.20) | (3.80) | |
| Lev | 0.024 | -0.058 | 0.161*** |
| (0.60) | (-1.41) | (3.49) | |
| Age | 0.230*** | 0.170*** | 0.234*** |
| (23.11) | (16.68) | (20.46) | |
| Loss | -0.006 | 0.026 | 0.022 |
| (-0.24) | (1.07) | (0.81) | |
| Growth | -0.124*** | -0.148*** | -0.150*** |
| (-6.35) | (-7.41) | (-6.67) | |
| RetVol | -0.499*** | -0.631*** | -0.737*** |
| (-4.20) | (-5.19) | (-5.40) | |
| EarnVol | 0.067 | -0.150* | -0.226** |
| (0.82) | (-1.79) | (-2.39) | |
| Indep | -0.315** | -0.263* | -0.099 |
| (-2.02) | (-1.65) | (-0.55) | |
| Board | -0.142*** | -0.120*** | -0.010 |
| (-3.15) | (-2.60) | (-0.19) | |
| Dual | -0.047*** | -0.050*** | -0.055*** |
| (-3.44) | (-3.59) | (-3.55) | |
| Top10 | 0.121** | 0.158*** | 0.026 |
| (2.34) | (2.98) | (0.43) | |
| Constant | 9.574*** | 9.532*** | 5.346*** |
| (43.65) | (42.42) | (21.16) | |
| # of Obs. | 12,731 | 12,731 | 12,731 |
| Adj. R2 | 0.498 | 0.467 | 0.336 |
Note: This table reports the regression results of the impact of managerial political connection on the readability of financial statements. The ordinary least squares model is specified as: Readabilityi, t = α0 + α1Politicali, t + ∑Controlsi, t + ∑Year + ∑Ind + εi, t. See Appendix for all variable definitions. Standard errors are clustered at both firm and year level. Industry fixed effect and year fixed effect are both controlled in all regressions. *, **, and *** indicates statistical significance at the 10%, 5%, and 1% level, respectively.
Table 4 showcases the results of the moderating effect of marketization. The coefficients of Marketscore\(\times\)Political are significantly positive at the 1% level, indicating that the higher the marketization level, the weaker the negative impact of political connections on the readability of financial statements. Furthermore, we plotted the moderating effects using Readability1 as the explanatory variable, as shown in following Figures 1. the managerial political connections have a stronger negative impact on the readability in regions with a lower degree of marketization, rather than a higher degree of marketization. This finding supports H2.
Table 4. Moderating effect of marketization level
| (1) | (2) | (3) | |
|---|---|---|---|
| Readability1 | Readability2 | Readability3 | |
| Political | -0.358*** | -0.228*** | -0.270*** |
| (-5.69) | (-3.53) | (-3.73) | |
| Marketscore×Political | 0.036*** | 0.020*** | 0.023*** |
| (4.68) | (2.61) | (2.66) | |
| Marketscore | -0.013** | 0.010* | 0.011* |
| (-2.53) | (1.84) | (1.92) | |
| Roa | 0.641*** | 0.848*** | 0.837*** |
| (5.71) | (7.38) | (6.48) | |
| Size | -0.373*** | -0.392*** | -0.217*** |
| (-40.13) | (-41.22) | (-20.26) | |
| BTM | 0.262*** | 0.258*** | 0.177*** |
| (6.43) | (6.17) | (3.77) | |
| Lev | 0.020 | -0.061 | 0.158*** |
| (0.49) | (-1.49) | (3.42) | |
| Age | 0.228*** | 0.174*** | 0.239*** |
| (22.74) | (16.93) | (20.71) | |
| Loss | -0.005 | 0.028 | 0.025 |
| (-0.22) | (1.15) | (0.90) | |
| Growth | -0.125*** | -0.147*** | -0.149*** |
| (-6.39) | (-7.38) | (-6.64) | |
| RetVol | -0.489*** | -0.619*** | -0.724*** |
| (-4.13) | (-5.10) | (-5.30) | |
| EarnVol | 0.056 | -0.149* | -0.225** |
| (0.68) | (-1.77) | (-2.38) | |
| Indep | -0.299* | -0.240 | -0.072 |
| (-1.92) | (-1.50) | (-0.40) | |
| Board | -0.137*** | -0.112** | -0.001 |
| (-3.03) | (-2.43) | (-0.02) | |
| Dual | -0.046*** | -0.052*** | -0.058*** |
| (-3.39) | (-3.78) | (-3.75) | |
| Top10 | 0.109** | 0.147*** | 0.012 |
| (2.09) | (2.75) | (0.20) | |
| Constant | 9.660*** | 9.504*** | 5.313*** |
| (43.75) | (42.01) | (20.89) | |
| # of Obs. | 12,731 | 12,731 | 12,731 |
| Adj. R2 | 0.499 | 0.468 | 0.337 |
Note: This table reports the regression results of the moderating impact of degree of marketization on the relationship between managerial political connection and the readability of financial statements. The ordinary least squares model, introducing an interaction term between degree of marketization and political connections, is specified as: Readabilityi,t = β0 + β1Politicali,t + β2Marketscorei,t × Politicali,t + β3 Marketscorei,t + ∑Controlsi,t + ∑Year + ∑Ind + εi,t See Appendix for all variable definitions. Standard errors are clustered at both firm and year level. Industry fixed effect and year fixed effect are both controlled in all regressions. *, **, and *** indicates statistical significance at the 10%, 5%, and 1% level, respectively.
Figure 1. Moderating effect of marketization degree
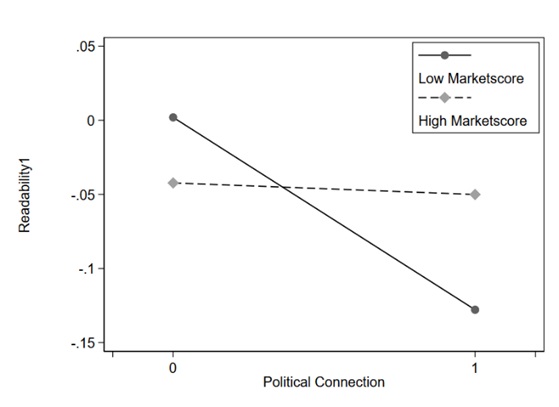
Table 5. Moderating effect of corporate governance
| (1) | (2) | (3) | |
|---|---|---|---|
| Readability1 | Readability2 | Readability3 | |
| Political | -0.091*** | -0.090*** | -0.112*** |
| (-6.42) | (-6.22) | (-6.88) | |
| CG_index×Political | 0.039*** | 0.045*** | 0.051*** |
| (3.62) | (4.17) | (4.16) | |
| CG_index | -0.147*** | -0.172*** | -0.201*** |
| (-18.10) | (-20.79) | (-21.73) | |
| Roa | 0.591*** | 0.796*** | 0.776*** |
| (5.35) | (7.05) | (6.13) | |
| Size | -0.383*** | -0.401*** | -0.227*** |
| (-41.72) | (-42.89) | (-21.65) | |
| BTM | 0.346*** | 0.356*** | 0.293*** |
| (8.55) | (8.63) | (6.32) | |
| Lev | -0.012 | -0.100** | 0.112** |
| (-0.30) | (-2.48) | (2.47) | |
| Age | 0.180*** | 0.112*** | 0.166*** |
| (17.84) | (10.86) | (14.36) | |
| Loss | -0.009 | 0.023 | 0.018 |
| (-0.37) | (0.95) | (0.67) | |
| Growth | -0.088*** | -0.107*** | -0.101*** |
| (-4.59) | (-5.42) | (-4.57) | |
| RetVol | -0.379*** | -0.491*** | -0.572*** |
| (-3.24) | (-4.11) | (-4.27) | |
| EarnVol | 0.113 | -0.097 | -0.163* |
| (1.40) | (-1.17) | (-1.77) | |
| Indep | 0.352** | 0.518*** | 0.820*** |
| (2.24) | (3.23) | (4.56) | |
| Board | -0.301*** | -0.307*** | -0.230*** |
| (-6.66) | (-6.64) | (-4.43) | |
| Dual | 0.041*** | 0.053*** | 0.065*** |
| (2.90) | (3.66) | (4.06) | |
| Top10 | -0.020 | -0.008 | -0.170*** |
| (-0.39) | (-0.14) | (-2.87) | |
| Constant | 9.895*** | 9.908*** | 5.791*** |
| (45.63) | (44.80) | (23.34) | |
| # of Obs. | 12,731 | 12,731 | 12,731 |
| Adj. R2 | 0.513 | 0.488 | 0.363 |
Note: This table reports the regression results of the moderating impact of corporate governance on the relationship between managerial political connection and the readability of financial statements. The ordinary least squares model, introducing an interaction term between corporate governance and political connections, is specified as: Readabilityi , t = γ 0 + γ 1Politicali,t + γ 2C G _i n d e x i,t × Politicali,t + γ 3C G _i n d e x i,t + ∑Controlsi,t + ∑Year + ∑Ind + εi,t. See Appendix for all variable definitions. Standard errors are clustered at both firm and year level. Industry fixed effect and year fixed effect are both controlled in all regressions. *, **, and *** indicates statistical significance at the 10%, 5%, and 1% level, respectively.
Table 5 reports the results of the moderating effect of corporate governance. The coefficients of CG_index\(\times\)Political are significantly positive at the 1% level, showing that the corporate governance would weaken the negative impact of political connections on the readability of financial statements. After using the moderating effects using Readability1 as the explanatory variable, Figure 2 shows the result. Compared with companies with a higher level of corporate governance, the managerial political connections have a stronger negative impact on the readability in companies with a lower level of corporate governance. This finding verifies H3.
Figure 2. Moderating effect of corporate governance level
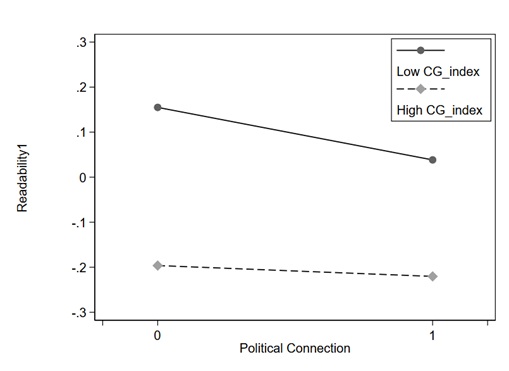
Table 6 presents the results of the moderating effect of analyst coverage. The coefficients of Analyst\(\times\)Political are significantly positive at the 1% level in columns (1) and (2), demonstrating that high analyst coverage would weaken the negative impact of political connections on the readability of financial statements. Same as previous moderating effect test, we use Readability1 as the explanatory variable and Figure 3 shows the result. Management's political connections have a greater negative impact on the readability of financial statements for companies with lower analyst coverage than for companies with higher analyst coverage. H4 is supported.
In addition, through analysis of variance, it is found that the f2 of the interaction terms Marketscore\(\times\)Political, CG_index\(\times\)Political and Analyst\(\times\)Political are 21.86, 13.14, 9.82, respectively. The P values of the interaction terms are all less than 0.01.
Table 6. Moderating effect of analyst coverage
| (1) | (2) | (3) | |
|---|---|---|---|
| Readability1 | Readability2 | Readability3 | |
| Political | -0.125*** | -0.113*** | -0.112*** |
| (-5.80) | (-5.14) | (-4.53) | |
| Analyst×Political | 0.035*** | 0.030*** | 0.017 |
| (3.13) | (2.65) | (1.35) | |
| Analyst | -0.097*** | -0.109*** | -0.096*** |
| (-11.20) | (-12.39) | (-9.61) | |
| Roa | 0.790*** | 1.026*** | 0.996*** |
| (7.03) | (8.91) | (7.68) | |
| Size | -0.303*** | -0.307*** | -0.139*** |
| (-27.00) | (-26.79) | (-10.75) | |
| BTM | 0.065 | 0.025 | -0.035 |
| (1.46) | (0.56) | (-0.69) | |
| Lev | -0.019 | -0.108*** | 0.117** |
| (-0.47) | (-2.62) | (2.53) | |
| Age | 0.196*** | 0.130*** | 0.198*** |
| (18.96) | (12.32) | (16.66) | |
| Loss | -0.017 | 0.012 | 0.010 |
| (-0.72) | (0.51) | (0.35) | |
| Growth | -0.114*** | -0.136*** | -0.139*** |
| (-5.85) | (-6.85) | (-6.20) | |
| RetVol | -0.574*** | -0.722*** | -0.822*** |
| (-4.86) | (-5.97) | (-6.03) | |
| EarnVol | 0.077 | -0.139* | -0.215** |
| (0.94) | (-1.66) | (-2.28) | |
| Indep | -0.306** | -0.252 | -0.090 |
| (-1.98) | (-1.59) | (-0.50) | |
| Board | -0.128*** | -0.103** | 0.006 |
| (-2.85) | (-2.25) | (0.11) | |
| Dual | -0.041*** | -0.043*** | -0.049*** |
| (-3.06) | (-3.15) | (-3.19) | |
| Top10 | 0.133** | 0.173*** | 0.039 |
| (2.57) | (3.26) | (0.66) | |
| Constant | 8.402*** | 8.151*** | 4.085*** |
| (34.61) | (32.82) | (14.60) | |
| # of Obs. | 12,731 | 12,731 | 12,731 |
| Adj. R2 | 0.503 | 0.474 | 0.341 |
Note: This table reports the regression results of the moderating impact of analyst coverage on the relationship between managerial political connection and the readability of financial statements. The ordinary least squares model, introducing an interaction term between analyst coverage and political connections, is specified as: Readabilityi,t = δ 0 + δ 1Politicali,t + δ 2Analysti,t × Politicali,t + δ 3Analysti,t + ∑Controlsi,t + ∑Year + ∑Ind + εi,t. See Appendix for all variable definitions. Standard errors are clustered at both firm and year level. Industry fixed effect and year fixed effect are both controlled in all regressions. *, **, and *** indicates statistical significance at the 10%, 5%, and 1% level, respectively
Figure 3. Moderating effect of analysts coverage

4.2. Robustness test
4.2.1. Excluding the samples with no change in managerial political connections
Referring to He et al. (2021), this study removes the samples with no change in the managerial political connections during the sample period, and then regression is implemented. Companies with political connections may show distinct actions before and after the entry of such executives. Therefore, a simple identification of whether there are politically related managers or not cannot rule out the possibility that there were differences between the two types of enterprises before the existence of political connections, rather than managers without political connections reducing the readability of text information. Therefore, it is better to remove the interference factors by eliminating the sub-samples without any change in terms of political connections, so as to more reliably reveal the impact of political connections on the financial statements’ readability. Specifically, there are two cases that should be excluded: the first is the samples which always have political connections and showcase no change during the sample period. The experimental group’s Political is always 0, and the control group’s Political has changed over the sample period.
This study uses Readability1, Readability2 and Readability3 as dependent variables separately. After using Models (1)-(4), Columns (1)-(4) of Table 7 show the results. Limited by the length of this paper, only the results of Readability1 are presented. The significance of the remaining dependent variables remains the same. The regression coefficients of Political are still significantly negative, and the coefficients of Marketscore\(\times\)Political, CG_index\(\times\)Political and Analyst\(\times\)Political are significantly positive, thus proving that the research hypotheses remain unchanged. The second case is the sub-samples with executives who have no political connections during the sample period. For this case, the experimental group’s Political has changed over the sample period, and the control group’s Political is always 1. Columns (5)-(8) show the results and the conclusion almost remains unchanged.
Table 7. Excluding the samples with no change in managerial political connections
| (1) Readability1 | (2) Readability1 | (3) Readability1 | (4) Readability1 | (5) Readability1 | (6) Readability1 | (7) Readability1 | (8) Readability1 | |
|---|---|---|---|---|---|---|---|---|
| Political | -0.093*** | -0.260*** | -0.112*** | -0.167*** | -0.044** | -0.183** | -0.039** | -0.096*** |
| (-5.24) | (-3.12) | (-6.06) | (-5.99) | (-2.25) | (-2.13) | (-1.98) | (-3.22) | |
| Marketscore×Political | 0.021** | 0.021** | ||||||
| (2.05) | (1.97) | |||||||
| CG_index×Political | 0.045*** | 0.049*** | ||||||
| (3.19) | (3.15) | |||||||
| Analyst×Political | 0.049*** | 0.048*** | ||||||
| (3.30) | (3.14) | |||||||
| Marketscore | -0.009* | 0.003 | ||||||
| (-1.75) | (0.30) | |||||||
| CG_index | -0.148*** | -0.159*** | ||||||
| (-17.35) | (-10.99) | |||||||
| Analyst | -0.091*** | -0.109*** | ||||||
| (-10.11) | (-7.55) | |||||||
| Roa | 0.574*** | 0.579*** | 0.543*** | 0.726*** | 0.595*** | 0.386** | 0.347** | 0.528*** |
| (4.71) | (4.75) | (4.52) | (5.94) | (3.75) | (2.52) | (2.28) | (3.43) | |
| Size | -0.374*** | -0.373*** | -0.383*** | -0.305*** | -0.363*** | -0.352*** | -0.361*** | -0.286*** |
| (-35.51) | (-35.40) | (-36.91) | (-24.11) | (-28.59) | (-28.59) | (-29.66) | (-19.35) | |
| BTM | 0.261*** | 0.262*** | 0.347*** | 0.064 | 0.316*** | 0.339*** | 0.393*** | 0.161*** |
| (5.60) | (5.62) | (7.51) | (1.26) | (5.68) | (6.31) | (7.37) | (2.76) | |
| Lev | 0.009 | 0.008 | -0.025 | -0.030 | -0.295*** | -0.267*** | -0.282*** | -0.307*** |
| (0.19) | (0.18) | (-0.57) | (-0.68) | (-5.21) | (-4.87) | (-5.20) | (-5.60) | |
| Age | 0.236*** | 0.233*** | 0.181*** | 0.203*** | 0.177*** | 0.247*** | 0.200*** | 0.210*** |
| (20.80) | (20.37) | (15.65) | (17.17) | (12.14) | (17.44) | (14.06) | (14.39) | |
| Loss | 0.001 | 0.001 | 0.002 | -0.009 | 0.012 | -0.041 | -0.046 | -0.056* |
| (0.04) | (0.02) | (0.07) | (-0.35) | (0.38) | (-1.30) | (-1.47) | (-1.77) | |
| Growth | -0.115*** | -0.116*** | -0.077*** | -0.108*** | -0.152*** | -0.128*** | -0.094*** | -0.118*** |
| (-5.43) | (-5.47) | (-3.68) | (-5.11) | (-5.47) | (-4.73) | (-3.50) | (-4.38) | |
| RetVol | -0.487*** | -0.485*** | -0.371*** | -0.563*** | -0.529*** | -0.432*** | -0.359** | -0.526*** |
| (-3.64) | (-3.62) | (-2.81) | (-4.22) | (-3.24) | (-2.74) | (-2.30) | (-3.34) | |
| EarnVol | -0.006 | -0.012 | 0.049 | 0.005 | -0.110 | 0.127 | 0.147 | 0.142 |
| (-0.07) | (-0.14) | (0.57) | (0.06) | (-0.95) | (1.13) | (1.33) | (1.27) | |
| Indep | -0.437** | -0.426** | 0.291* | -0.430** | -0.475** | -0.330 | 0.218 | -0.388* |
| (-2.51) | (-2.45) | (1.65) | (-2.48) | (-2.17) | (-1.56) | (1.02) | (-1.84) | |
| Board | -0.175*** | -0.173*** | -0.339*** | -0.162*** | -0.222*** | -0.215*** | -0.399*** | -0.211*** |
| (-3.47) | (-3.43) | (-6.71) | (-3.25) | (-3.54) | (-3.55) | (-6.53) | (-3.49) | |
| Dual | -0.024 | -0.023 | 0.065*** | -0.020 | -0.067*** | -0.055*** | 0.032* | -0.049*** |
| (-1.55) | (-1.50) | (4.08) | (-1.32) | (-3.51) | (-2.99) | (1.67) | (-2.68) | |
| Top10 | 0.071 | 0.066 | -0.071 | 0.084 | 0.046 | 0.011 | -0.105 | 0.045 |
| (1.21) | (1.12) | (-1.23) | (1.43) | (0.64) | (0.15) | (-1.51) | (0.65) | |
| Constant | 9.838*** | 9.887*** | 10.151*** | 8.719*** | 9.297*** | 9.305*** | 9.690*** | 8.279*** |
| (39.94) | (39.92) | (41.72) | (32.02) | (31.25) | (31.89) | (33.91) | (26.08) | |
| # of Obs. | 10,043 | 10,043 | 10,043 | 10,043 | 7,338 | 7,338 | 7,338 | 7,338 |
| Adj. R2 | 0.513 | 0.513 | 0.528 | 0.518 | 0.460 | 0.491 | 0.504 | 0.495 |
Note: This table reports the regression results after excluding the samples with no change in managerial political connections. Limited by the length of this paper, only the results of Readability1 are presented. See Appendix for all variable definitions. Standard errors are clustered at both firm and year level. Industry fixed effect and year fixed effect are both controlled in all regressions. *, **, and *** indicates statistical significance at the 10%, 5%, and 1% level, respectively.
4.2.2. Firm fixed effect model
In order to further alleviate the impact of the missing variables that do not change over time on the conclusion, this study uses the company fixed effect model to address the endogeneity problem. After using Readability1, Readability2 and Readability3 as dependent variables in Models (1)-(4), this study finds the analysis results shown in Tables 8. Limited by the length of this paper, only the results of Readability1 are shown. The significance of the remaining dependent variables remains the same. It can be found that the coefficients of political are all significantly negative, which proves H1. Moreover, the coefficients of Marketscore\(\times\)Political, CG_index\(\times\)Political and Analyst\(\times\)Political are all significantly positive, which is consistent with H2, H3 and H4.
Table 8. Firm fixed effect test
| (1) Readability1 | (2) Readability1 | (3) Readability1 | (4) Readability1 | |
|---|---|---|---|---|
| Political | -0.035** | -0.208*** | -0.050*** | -0.037* |
| (-2.50) | (-3.33) | (-3.43) | (-1.93) | |
| Marketscore×Political | 0.022*** | |||
| (2.86) | ||||
| CG_index×Political | 0.037*** | |||
| (3.65) | ||||
| Analyst×Political | 0.002** | |||
| (2.18) | ||||
| Marketscore | -0.045** | |||
| (-2.39) | ||||
| CG_index | -0.054*** | |||
| (-5.67) | ||||
| Analyst | -0.024*** | |||
| (-3.33) | ||||
| Roa | 0.320*** | 0.325*** | 0.316*** | 0.344*** |
| (4.07) | (4.13) | (4.02) | (4.35) | |
| Size | -0.350*** | -0.350*** | -0.342*** | -0.330*** |
| (-29.64) | (-29.63) | (-28.89) | (-25.50) | |
| BTM | 0.136*** | 0.136*** | 0.145*** | 0.085** |
| (3.73) | (3.76) | (3.98) | (2.18) | |
| Lev | 0.165*** | 0.164*** | 0.157*** | 0.153*** |
| (4.03) | (4.02) | (3.85) | (3.72) | |
| Age | 0.184*** | 0.183*** | 0.171*** | 0.176*** |
| (11.92) | (11.83) | (10.85) | (11.22) | |
| Loss | -0.002 | -0.002 | -0.002 | -0.006 |
| (-0.15) | (-0.12) | (-0.11) | (-0.35) | |
| Growth | -0.040*** | -0.041*** | -0.036*** | -0.040*** |
| (-3.17) | (-3.25) | (-2.87) | (-3.16) | |
| RetVol | -0.119 | -0.117 | -0.100 | -0.125 |
| (-1.52) | (-1.50) | (-1.28) | (-1.60) | |
| EarnVol | -0.277*** | -0.280*** | -0.266*** | -0.273*** |
| (-4.22) | (-4.27) | (-4.07) | (-4.16) | |
| Indep | -0.284* | -0.267* | -0.072 | -0.281* |
| (-1.85) | (-1.74) | (-0.45) | (-1.83) | |
| Board | -0.212*** | -0.208*** | -0.258*** | -0.208*** |
| (-4.27) | (-4.18) | (-5.07) | (-4.20) | |
| Dual | -0.017 | -0.017 | 0.008 | -0.016 |
| (-1.25) | (-1.30) | (0.56) | (-1.20) | |
| Top10 | -0.529*** | -0.523*** | -0.520*** | -0.511*** |
| (-8.89) | (-8.79) | (-8.73) | (-8.56) | |
| Constant | 9.594*** | 9.285*** | 9.472*** | 9.247*** |
| (37.42) | (32.84) | (36.88) | (33.89) | |
| # of Obs. | 12,731 | 12,731 | 12,731 | 12,731 |
| Adj. R2 | 0.597 | 0.597 | 0.598 | 0.597 |
Note: This table reports the regression results after controlling firm fixed effect. Limited by the length of this paper, only the results of Readability1 are presented. See Appendix for all variable definitions. Standard errors are clustered at both firm and year level. Firm and year fixed effects are both controlled in all regressions. *, **, and *** indicate statistical significance at the 10%, 5%, and 1% level, respectively.
4.2.3. Propensity score matching and Difference-in-Difference (PSM-DID) test
Inferring the economic effects of political connections at the level of association is challenging. For instance, for a given information disclosure, political connections would decrease the corporate information disclosure. However, level tests can be confounding due to the fact that firms with poorer financial statements’ readability have stronger incentives to establish political connections. To mitigate these concerns, this study further applies the PSM-DID design, which provides a better measure of the effectiveness of the political connections. Further clarifications are provided below.
First, PSM is used to identify a control group of non-users and account for the endogeneity of seeking political connections. The samples are divided into three sub-samples according to their political connections: the first users of establishing political connections, the users having political connections, and the non-users having political connections. If an enterprise first appears in the samples and shows that it doesn’t have political connections, but do so in the following year, then it is considered to be the first user (Treat), which is treatment group. Those who have never had political connections over the entire research period are regarded as complete non-users, which is control group. Following Hesarzadeh & Rajabalizadeh (2020), a firm’s propensity score is the probability of building political connections conditional on the company’s observable criteria including the determinants of building political connections (Chen et al., 2011). The index was matched 1:1. The following model shows the PSM process.
\[\begin{equation} \label{eq5} \small \begin{split} {Pr(Treat)}_{i,t}& = \alpha_{0} + \alpha_{1} Roa_{i,t} + \alpha_{2} Size_{i,t} + \alpha_{3} BTM_{i,t} \hspace{0.5cm}\\ & + \alpha_{4} Age_{i,t} + \alpha_{5} Loss_{i,t} + \alpha_{6}{ Growth}_{i,t}\\ & + \alpha_{7} Lev_{i,t} + \sum Year + \sum Ind + \varepsilon_{i,t} \end{split} \ \ \ \ \ (5) \end{equation}\]where Treat equals 1 for the treatment group and 0 for the control group. After PSM, 1,266 samples are obtained. Panel A of Table 9 shows the means for both treatment and control groups. The results show that after matching, p-values are all bigger than 10%, indicating that the difference in means is insignificant.
Second, an important assumption of the DID method is that shocks contemporaneous with the political connections affect the both treatment and control groups similarly. After PSM, the sample are suitable for the above requirement. The following model is designed for DID.
\[\begin{equation} \label{eq6} \small \begin{split} Readability_{i,t}& = \beta_{0} + \beta_{1} Treat_{i}{\times Post}_{t} + \beta_{2} Treat_{i} + {\beta_{3} Post}_{t}\\ & + \sum Controls_{i,t} + \sum Year + \sum Ind + \varepsilon_{i,t} \end{split} \ \ \ \ \ (6) \end{equation}\]where Post is a dummy time variable, which is 1 for the time after having political connections and otherwise, 0; and Controls are control variables, which are consistent with Equation (1). The coefficient of interest is \(\beta_{1}\), which represents the net differential change in Readability between the treatment and control group. The results are shown in Panel B of Table 9. The regression coefficients of Treat\(\times\)Post are all negative and significant above the level of 5%, indicating that H1 holds. Therefore, the findings of this study are still robust.
Table 9. PSM-DID test
| Panel A PSM Result | |||
|---|---|---|---|
| Variable | Political connections companies Treat Group | No-political connections companies Control Group | P-value |
| Roa | 0.037 | 0.036 | 0.814 |
| Size | 21.816 | 21.784 | 0.129 |
| BTM | 0.592 | 0.585 | 0.114 |
| Age | 1.644 | 1.666 | 0.212 |
| Loss | 0.123 | 0.127 | 0.526 |
| Growth | 0.137 | 0.135 | 0.749 |
| Lev | 0.403 | 0.404 | 0.846 |
| Observation | 633 | 633 | |
| Panel B PSM-DID Result | |||
| (1) | (2) | (3) | |
| Readability1 | Readability2 | Readability3 | |
| Treat×Post | -0.080*** | -0.048** | -0.065*** |
| (-4.09) | (-2.46) | (-2.97) | |
| Treat | -0.089 | -0.061 | -0.169** |
| (-1.29) | (-0.88) | (-2.08) | |
| Post | -0.039 | -0.051 | -0.112 |
| (-0.60) | (-0.78) | (-1.45) | |
| Roa | 0.388 | 0.775** | 0.579 |
| (1.11) | (2.21) | (1.41) | |
| Size | -0.346*** | -0.334*** | -0.197*** |
| (-11.73) | (-11.32) | (-5.67) | |
| BTM | 0.043 | 0.137 | 0.022 |
| (0.31) | (1.00) | (0.14) | |
| Lev | -0.128 | -0.193* | 0.053 |
| (-1.10) | (-1.65) | (0.39) | |
| Age | 0.196*** | 0.141*** | 0.246*** |
| (6.34) | (4.55) | (6.76) | |
| Loss | -0.056 | 0.023 | 0.002 |
| (-0.79) | (0.31) | (0.03) | |
| Growth | -0.056 | -0.151*** | -0.188*** |
| (-1.05) | (-2.85) | (-3.03) | |
| RetVol | -0.752** | -0.827** | -1.424*** |
| (-2.13) | (-2.34) | (-3.43) | |
| EarnVol | 0.458** | 0.366** | 0.028 |
| (2.49) | (1.99) | (0.13) | |
| Indep | 0.199 | -0.029 | 0.101 |
| (0.42) | (-0.06) | (0.18) | |
| Board | -0.151 | -0.112 | 0.051 |
| (-1.10) | (-0.82) | (0.32) | |
| Dual | -0.123*** | -0.095** | -0.081 |
| (-2.92) | (-2.25) | (-1.62) | |
| Top10 | 0.399** | 0.294* | 0.648*** |
| (2.56) | (1.89) | (3.54) | |
| Constant | 9.448*** | 8.874*** | 4.647*** |
| (12.41) | (11.64) | (5.19) | |
| # of Obs. | 1,266 | 1,266 | 1,266 |
| Adj. R2 | 0.502 | 0.482 | 0.344 |
Note: This table reports the regression results after applying PSM-DID model. See Appendix for all variable definitions. Standard errors are clustered at both firm and year level. Industry fixed effect and year fixed effect are both controlled in all regressions. *, **, and *** indicates statistical significance at the 10%, 5%, and 1% level, respectively.
4.2.4. Replacing the measurement of political connections
In order to further distinguish the influence of political positions, this study assigns scores to the political positions according to the highest administrative level when the executives served in the government or parliament bodies. Referring to Chen (2021), this study measures the strength of political identities by assigning a value to each managerial political background (Scores). If the executives are members of the central people’s congress, or work in the central ministries, the score is 5. If the executives work at provincial, municipal, district and township levels, the score is sequentially reduced from 4 to 1. The score equals to 0 for the enterprises without any government background.
This study uses Readability1, Readability2 and Readability3 as the dependent variable separately; and after using Models (1)-(4), Columns (1) to (4) of Table 10 present the results. Limited by the length of this paper, only the results of Readability1 are shown. The significance of the remaining dependent variables remains the same. The coefficients of Scores are all significantly negative at the 1% level, which is consistent with H1. Besides, the coefficients of Marketscore\(\times\)Scores, CG_index\(\times\)Scores and Analyst\(\times\)Scores are significantly positive, which is consistent with H2, H3 and H4.
Table 10. Replacing the measurement of political connections
| (1) Readability1 | (2) Readability1 | (3) Readability1 | (4) Readability1 | (5) Readability1 | (6) Readability1 | (7) Readability1 | (8) Readability1 | |
|---|---|---|---|---|---|---|---|---|
| Scores | -0.012*** | -0.037*** | -0.016*** | -0.017*** | ||||
| (-5.53) | (-3.49) | (-6.32) | (-4.65) | |||||
| Marketscore×Scores | 0.003** | |||||||
| (2.39) | ||||||||
| CG_index×Scores | 0.005*** | |||||||
| (2.74) | ||||||||
| Analyst×Scores | 0.003* | |||||||
| (1.83) | ||||||||
| Background | -0.167*** | -0.596*** | -0.206*** | -0.323*** | ||||
| (-4.71) | (-3.61) | (-5.38) | (-4.89) | |||||
| Marketscore×Background | 0.053*** | |||||||
| (2.67) | ||||||||
| CG_index×Background | 0.059** | |||||||
| (2.12) | ||||||||
| Analyst×Background | 0.061* | |||||||
| (1.80) | ||||||||
| Marketscore | -0.006 | -0.012* | ||||||
| (-1.15) | (-1.83) | |||||||
| CG_index | -0.141*** | -0.146*** | ||||||
| (-18.20) | (-14.86) | |||||||
| Analyst | -0.089*** | -0.104*** | ||||||
| (-10.71) | (-8.74) | |||||||
| Roa | 0.633*** | 0.634*** | 0.588*** | 0.781*** | 0.641*** | 0.639*** | 0.593*** | 1.004*** |
| (5.64) | (5.65) | (5.32) | (6.94) | (5.71) | (5.69) | (5.36) | (7.75) | |
| Size | -0.372*** | -0.371*** | -0.380*** | -0.301*** | -0.374*** | -0.374*** | -0.383*** | -0.139*** |
| (-39.86) | (-39.78) | (-41.29) | (-26.81) | (-40.29) | (-40.24) | (-41.71) | (-10.76) | |
| BTM | 0.259*** | 0.259*** | 0.341*** | 0.062 | 0.257*** | 0.258*** | 0.339*** | -0.045 |
| (6.33) | (6.34) | (8.42) | (1.40) | (6.28) | (6.30) | (8.36) | (-0.88) | |
| Lev | 0.023 | 0.020 | -0.012 | -0.019 | 0.029 | 0.030 | -0.005 | 0.124*** |
| (0.57) | (0.50) | (-0.30) | (-0.48) | (0.73) | (0.75) | (-0.13) | (2.67) | |
| Age | 0.230*** | 0.229*** | 0.181*** | 0.196*** | 0.231*** | 0.231*** | 0.183*** | 0.200*** |
| (23.14) | (22.81) | (17.87) | (19.03) | (23.28) | (23.15) | (18.09) | (16.81) | |
| Loss | -0.005 | -0.005 | -0.009 | -0.017 | -0.005 | -0.005 | -0.008 | 0.011 |
| (-0.22) | (-0.22) | (-0.36) | (-0.71) | (-0.19) | (-0.20) | (-0.33) | (0.41) | |
| Growth | -0.125*** | -0.125*** | -0.090*** | -0.114*** | -0.123*** | -0.124*** | -0.089*** | -0.138*** |
| (-6.39) | (-6.40) | (-4.66) | (-5.89) | (-6.32) | (-6.35) | (-4.59) | (-6.14) | |
| RetVol | -0.502*** | -0.498*** | -0.381*** | -0.580*** | -0.502*** | -0.496*** | -0.381*** | -0.830*** |
| (-4.23) | (-4.20) | (-3.26) | (-4.90) | (-4.24) | (-4.18) | (-3.25) | (-6.09) | |
| EarnVol | 0.069 | 0.065 | 0.114 | 0.080 | 0.069 | 0.065 | 0.116 | -0.213** |
| (0.85) | (0.79) | (1.41) | (0.98) | (0.84) | (0.79) | (1.43) | (-2.26) | |
| Indep | -0.310** | -0.302* | 0.349** | -0.302* | -0.281* | -0.266* | 0.371** | -0.037 |
| (-1.99) | (-1.94) | (2.23) | (-1.95) | (-1.80) | (-1.70) | (2.36) | (-0.21) | |
| Board | -0.143*** | -0.140*** | -0.302*** | -0.129*** | -0.147*** | -0.143*** | -0.305*** | -0.001 |
| (-3.16) | (-3.09) | (-6.67) | (-2.87) | (-3.26) | (-3.15) | (-6.73) | (-0.01) | |
| Dual | -0.034** | -0.034** | 0.053*** | -0.029** | -0.045*** | -0.045*** | 0.043*** | -0.048*** |
| (-2.48) | (-2.48) | (3.74) | (-2.17) | (-3.31) | (-3.30) | (3.02) | (-3.07) | |
| Top10 | 0.119** | 0.113** | -0.021 | 0.131** | 0.127** | 0.126** | -0.012 | 0.046 |
| (2.29) | (2.18) | (-0.41) | (2.53) | (2.44) | (2.42) | (-0.22) | (0.77) | |
| Constant | 9.527*** | 9.567*** | 9.848*** | 8.363*** | 9.587*** | 9.674*** | 9.906*** | 4.117*** |
| (43.36) | (43.26) | (45.32) | (34.41) | (43.71) | (43.41) | (45.64) | (14.68) | |
| # of Obs. | 12,731 | 12,731 | 12,731 | 12,731 | 12,731 | 12,731 | 12,731 | 12,731 |
| Adj. R2 | 0.498 | 0.498 | 0.513 | 0.503 | 0.498 | 0.498 | 0.512 | 0.341 |
Note: This table reports the regression results after replacing the measurement of political connections. First method is assigning a value to each managerial political background, which shows in column (1)-(4). Second method is using the proportion of directors with political connection background, which shows in column (5)-(8). Limited by the length of this paper, only the results of Readability1 are presented. See Appendix for all variable definitions. Standard errors are clustered at both firm and year level. Industry fixed effect and year fixed effect are both controlled in all regressions. *, **, and *** indicates statistical significance at the 10%, 5%, and 1% level, respectively.
In addition, this study adopts the proportion of directors with political connection background (Background) as a replacement. The results are shown in Columns (5) to (8). The coefficients of Background are significantly negative at the 1% level, indicating that the more the directors with political connections, the lower the readability of financial statements, a finding also consistent with H1. Moreover, the coefficients of Marketscore\(\times\)Background, CG_index\(\times\)Background and Analyst\(\times\)Background are all significantly positive, which is consistent with H2, H3 and H4. Therefore, these findings hold to an alternative measurement of political connections.
4.2.5. Replacing the measurement of readability.
To ensure the robustness of its results, this study further takes four methods to measure the readability of financial statements. First, as recommended by Loughran & McDonald (2014), file size is easily replicated and straightforward, with few measurement errors. Therefore, this study uses file size as variable substitution, which is calculated as the range standardization of the reciprocal of the natural logarithm of the digital file size of financial statements (Readability4). The larger the Readability4, the lower the readability of a financial statement. As shown in Column (1) of Table 11, the coefficient of Political is significantly negative at the 1% level.
Second, because annual reports contain a large number of professional accounting terms, a high threshold and certain difficulties exist for many individual investors without professional training. Therefore, the more the accounting professional terms, the worse the financial statements’ readability. Based on this finding, this study takes the number of accounting professional terms as another variable substitution, which is calculated as the range standardization of the reciprocal of the natural logarithm of the accounting terms’ amount in an annual report (Readability5). Column (2) shows the result. It can be seen that the coefficient of Political is significantly negative at the 1% level.
Third, following Xu (2019), based on difficulties in reading as well as logical structures of Chinese language, this study selects the average number of words in each clause (average_length) and the number of passive sentences in the text (passive_count) to reconstruct the Chinese readability indicator (Readability6). In the Chinese environment, the difficulty in text reading is affected by sentence structures. Given the number of words in a sentence, sentences with good clause structures are obviously easier to read (Xu, 2019). In terms of logical structures of text, the more the passive sentences in a file, the more complex the logical relationship of its text and the more difficult it is to understand (Asay et al., 2018). Therefore, this study reconstructs Readability6 by using the average value of average_length and passive_count. The larger the Readability6 for a financial report, the worse its readability. Column (3) of Table 11 shows the result and the coefficient of Political is significantly positive at the 1% level.
Fourth, large and small firms have significant differences in operating activities and business complexity, so the magnitude of information should vary across firm with different sizes. Large firms’ financial reports are generally longer than those of small firms. Thus, when the length of corporate annual reports is calculated, the firm size’s effect should be eliminated. Accordingly, this study further uses Readability1, Readability2 and Readability3 to divide the natural logarithm of the firms’ total assets separately, so as to calculate the new indicator Ab_Readability1, Ab_Readability2 and Ab_Readability3. Columns (4) to (6) present the results, which show that the coefficients of Political are all significantly negative at the 1% level. All these results verify the H1.
Table 11. Replacing the measurement of readability
| (1) | (2) | (3) | (4) | (5) | (6) | |
|---|---|---|---|---|---|---|
| Readability4 | Readability5 | Readability6 | Ab_Readability1 | Ab_Readability2 | Ab_Readability3 | |
| Political | -0.063*** | -0.082*** | 0.600*** | -0.065*** | -0.032*** | -0.068*** |
| (-4.39) | (-5.25) | (3.09) | (-5.19) | (-4.71) | (-5.48) | |
| Roa | 0.478*** | 0.863*** | -5.001*** | 0.589*** | 0.421*** | 0.673*** |
| (3.91) | (6.52) | (-3.05) | (5.58) | (7.28) | (6.43) | |
| Size | -0.225*** | -0.207*** | 1.154*** | 0.563*** | 0.879*** | 0.611*** |
| (-22.22) | (-18.94) | (8.52) | (64.41) | (183.70) | (70.53) | |
| BTM | 0.082* | 0.136*** | -0.998* | 0.264*** | 0.136*** | 0.154*** |
| (1.84) | (2.82) | (-1.67) | (6.86) | (6.47) | (4.03) | |
| Lev | 0.089** | 0.038 | 1.650*** | 0.001 | -0.037* | 0.116*** |
| (2.02) | (0.81) | (2.90) | (0.01) | (-1.81) | (3.11) | |
| Age | 0.127*** | 0.159*** | 0.372** | 0.211*** | 0.082*** | 0.185*** |
| (11.71) | (13.59) | (2.56) | (22.58) | (16.08) | (19.96) | |
| Loss | -0.026 | 0.064** | -0.400 | -0.009 | 0.012 | 0.016 |
| (-0.98) | (2.27) | (-1.14) | (-0.39) | (0.96) | (0.71) | |
| Growth | -0.042** | -0.161*** | 1.208*** | -0.116*** | -0.073*** | -0.123*** |
| (-1.96) | (-7.02) | (4.24) | (-6.31) | (-7.30) | (-6.77) | |
| RetVol | -0.118 | -0.787*** | 5.820*** | -0.444*** | -0.310*** | -0.575*** |
| (-0.91) | (-5.63) | (3.36) | (-3.98) | (-5.08) | (-5.20) | |
| EarnVol | 0.033 | -0.185* | 3.085** | 0.017 | -0.086** | -0.204*** |
| (0.37) | (-1.91) | (2.56) | (0.23) | (-2.04) | (-2.66) | |
| Indep | -0.368** | -0.328* | 4.778** | -0.280* | -0.126 | -0.068 |
| (-2.17) | (-1.79) | (2.10) | (-1.91) | (-1.57) | (-0.47) | |
| Board | -0.189*** | 0.046 | -0.968 | -0.129*** | -0.057** | -0.003 |
| (-3.84) | (0.87) | (-1.47) | (-3.04) | (-2.44) | (-0.07) | |
| Dual | -0.008 | -0.079*** | 0.998*** | -0.046*** | -0.026*** | -0.047*** |
| (-0.57) | (-4.94) | (5.05) | (-3.58) | (-3.74) | (-3.69) | |
| Top10 | 0.292*** | 0.142** | -3.566*** | 0.120** | 0.083*** | 0.028 |
| (5.17) | (2.32) | (-4.70) | (2.45) | (3.09) | (0.58) | |
| Constant | 6.565*** | 5.328*** | 20.560*** | -10.883*** | -18.572*** | -12.742*** |
| (27.48) | (20.62) | (6.42) | (-52.73) | (-164.30) | (-62.29) | |
| # of Obs. | 12,731 | 12,731 | 12,731 | 12,731 | 12,731 | 12,731 |
| Adj. R2 | 0.390 | 0.301 | 0.167 | 0.554 | 0.866 | 0.562 |
Note: This table reports the regression results after replacing the measurement of readability. See Appendix for all variable definitions. Standard errors are clustered at both firm and year level. Industry fixed effect and year fixed effect are both controlled in all regressions. *, **, and *** indicates statistical significance at the 10%, 5%, and 1% level, respectively.
4.2.6. Alternative explanation of readability and information transparency
In our study, management with a political background often choose to manipulate information disclosure, which increases the number of pages, words and sentences, and reduces information transparency. However, there may be an alternative explanation that managers are willing to disclose further textual information (i.e., a greater number of pages, words and sentences), thereby increasing information transparency. To rule out the above alternative explanation, we further test the relationship between textual information (lnPages, lnWords and lnSentences) and information transparency. We use three variables to measure information transparency, including accrued earnings management (DA), information disclosure violation (Violation) and information disclosure quality (Quality).
DA is measured by the manipulative accrued profit calculated by the modified Jones model (Dechow et al., 1995). Violation is a dummy variable which equals to 1 if the company has financial fraud, delayed disclosure, major omissions, and punishment; otherwise, it is 0. Quality is measured by the exchange’s information disclosure evaluation score data. The higher the score, the higher the quality of corporate information disclosure. Since 2001, China has been conducting an annual exchange disclosure assessment of listed companies into four levels: A, B, C, and D, which we assign a value of 4, 3, 2 and 1, respectively. The following model is designed.
\[\begin{equation} \label{eq7} \small \begin{split} DA_{i,t}(Vio& lation_{i,t}, Quality_{i,t} ) = \\ & \alpha_{0} + \alpha_{1} lnPages_{i,t}( lnWords_{i,t}, lnSentences_{i,t}) \hspace{0.5cm}\\ & + \sum Controls_{i,t} + \sum Year + \sum Ind + \varepsilon_{i,t} \end{split} \ \ \ \ \ (7) \end{equation}\]where the Controls are the same as in Equation (1). We use ordinary least squares method for DA regression, logit method for Violation regression, and ordered logit method for Quality regression. The results are reported in Table 12. In columns (1)-(6), the coefficients of lnPages, lnWords and lnSentences are all significantly positive at the 1% level. In columns (7) and (9), the coefficients of lnPages and lnSentences are significantly negative at the 1% level. These results indicates that the number of pages, words and sentences can reduce the information transparency, which is consistent with the original findings.
Table 12. Alternative Explanation
| (1) | (2) | (3) | (4) | (5) | (6) | (7) | (8) | (9) | |
|---|---|---|---|---|---|---|---|---|---|
| DA | DA | DA | Violation | Violation | Violation | Quality | Quality | Quality | |
| lnPages | 0.029*** | 0.970*** | -0.479*** | ||||||
| (3.33) | (7.24) | (-3.26) | |||||||
| lnWords | 0.037*** | 0.677*** | -0.163 | ||||||
| (4.46) | (5.39) | (-1.25) | |||||||
| lnSentences | 0.023*** | 0.487*** | -0.223** | ||||||
| (4.21) | (6.00) | (-2.30) | |||||||
| Roa | 0.644*** | 0.647*** | 0.645*** | -2.687*** | -2.683*** | -2.677*** | 5.845*** | 5.885*** | 5.880*** |
| (20.00) | (20.11) | (20.05) | (-7.36) | (-7.36) | (-7.34) | (14.22) | (14.31) | (14.32) | |
| Size | 0.005** | 0.004 | 0.006** | -0.037 | -0.014 | 0.015 | 0.623*** | 0.596*** | 0.595*** |
| (2.01) | (1.59) | (2.51) | (-1.07) | (-0.39) | (0.46) | (16.56) | (15.96) | (16.62) | |
| BTM | 0.076*** | 0.077*** | 0.076*** | 0.131 | 0.112 | 0.100 | -1.456*** | -1.437*** | -1.440*** |
| (7.39) | (7.49) | (7.40) | (0.91) | (0.78) | (0.69) | (-9.80) | (-9.68) | (-9.71) | |
| Lev | 0.002 | 0.001 | 0.003 | 0.308** | 0.300** | 0.334** | -1.335*** | -1.344*** | -1.343*** |
| (0.24) | (0.16) | (0.32) | (2.33) | (2.28) | (2.53) | (-9.30) | (-9.37) | (-9.37) | |
| Age | -0.001 | -0.001 | -0.001 | 0.123*** | 0.100*** | 0.113*** | -0.450*** | -0.435*** | -0.444*** |
| (-0.41) | (-0.40) | (-0.31) | (3.46) | (2.83) | (3.16) | (-11.80) | (-11.47) | (-11.63) | |
| Loss | 0.012** | 0.012** | 0.012** | 0.409*** | 0.415*** | 0.414*** | -0.773*** | -0.774*** | -0.773*** |
| (2.11) | (2.17) | (2.14) | (5.32) | (5.41) | (5.39) | (-9.13) | (-9.14) | (-9.12) | |
| Growth | -0.002 | -0.002 | -0.002 | 0.148** | 0.152** | 0.150** | 0.095 | 0.087 | 0.090 |
| (-0.40) | (-0.55) | (-0.45) | (2.24) | (2.30) | (2.27) | (1.31) | (1.19) | (1.23) | |
| RetVol | 0.114*** | 0.113*** | 0.113*** | 2.297*** | 2.304*** | 2.283*** | -4.791*** | -4.800*** | -4.785*** |
| (4.27) | (4.21) | (4.23) | (5.93) | (5.95) | (5.90) | (-11.67) | (-11.69) | (-11.66) | |
| EarnVol | 0.137*** | 0.135*** | 0.135*** | 0.560** | 0.533* | 0.521* | -1.438*** | -1.426*** | -1.409*** |
| (7.17) | (7.10) | (7.08) | (2.05) | (1.95) | (1.91) | (-4.33) | (-4.29) | (-4.24) | |
| Indep | 0.080** | 0.080** | 0.081** | -0.273 | -0.254 | -0.222 | -0.350 | -0.360 | -0.347 |
| (2.24) | (2.23) | (2.27) | (-0.50) | (-0.46) | (-0.41) | (-0.65) | (-0.66) | (-0.64) | |
| Board | 0.002 | 0.002 | 0.003 | 0.054 | 0.062 | 0.080 | 0.299* | 0.290* | 0.298* |
| (0.23) | (0.22) | (0.29) | (0.34) | (0.39) | (0.51) | (1.90) | (1.84) | (1.89) | |
| Dual | 0.007** | 0.007** | 0.007** | 0.080* | 0.083* | 0.082* | -0.010 | -0.015 | -0.015 |
| (2.37) | (2.32) | (2.35) | (1.70) | (1.75) | (1.74) | (-0.22) | (-0.31) | (-0.32) | |
| Top10 | 0.001 | 0.001 | -0.001 | -0.341* | -0.352* | -0.369** | 0.337* | 0.369* | 0.371** |
| (0.05) | (0.05) | (-0.07) | (-1.88) | (-1.95) | (-2.05) | (1.78) | (1.96) | (1.97) | |
| Constant | -0.365*** | -0.614*** | -0.407*** | -6.322*** | -9.668*** | -6.243*** | |||
| (-6.36) | (-6.79) | (-6.82) | (-7.38) | (-7.10) | (-7.04) | ||||
| # of Obs. | 9497 | 9497 | 9497 | 12731 | 12731 | 12731 | 9431 | 9431 | 9431 |
| Adj. R2 | 0.079 | 0.079 | 0.079 | ||||||
| Pseudo R2 | 0.055 | 0.053 | 0.053 | 0.143 | 0.142 | 0.142 |
Note: This table reports the regression results of the relationship between textual information and information transparency. The ordinary least squares model is specified as: DAi,t(Violationi,t,Qualityi,t) = α0 + α1lnPagesi,t(lnWordsi,t, lnSentencesi,t)+∑Controlsi,t + ∑Year + ∑Ind + εi,t. Columns (1)-(3) show the results after using ordinary least squares method. Columns (4)-(6) show the results after using logit method. Columns (7)-(9) show the results after using ordered logit method. See Appendix for all variable definitions. Standard errors are clustered at both firm and year level. Industry fixed effect and year fixed effect are both controlled in all regressions. *, **, and *** indicates statistical significance at the 10%, 5%, and 1% level, respectively.
5. Further analysis
Good readability of financial statements’ text information can diminish the cost of processing companies' information by investors, facilitate investors to extract valuable information more efficiently (Miller, 2010), and finally boost the future value of firms (Hwang & Kim, 2017). Therefore, this study further examines the political connections economic consequence for the firm value by using the model below:
\[\begin{equation} \label{eq8} \small \begin{split} Tob& in_{i,t + 1}= \beta_{0} + \beta_{1}Readability_{i,t}\\ & + \beta_{2}{ Readablility_{i,t} \times Political}_{i,t} + {\beta_{3} Political}_{i,t}\\ & + {\beta_{4} Tobin}_{i,t} + \sum Controls_{i,t} + \sum Year + \sum Ind + \varepsilon_{i,t} \end{split} \ \ \ \ \ (8) \end{equation}\]Tobin stands for the future market value of an enterprise. Following Salvi et al., (2021), Tobin is measured by the sum of book value of assets and market value of equity less common equity divided by book value of assets. Based on the existing literature (Hejazi et al., 2016; Harrigan et al., 2018; Salvi et al., 2021), the control variables include: Size, Lev, Age, Growth, Indep, Board, Dual, Top10 and Cash which is calculated by corporate cash holdings divided by total asset. In order to avoid the endogenous problem, the Tobin in the current year is controlled in the model, and the effects of industry (Ind) and time (year) are also controlled.
Table 13 shows the results. All coefficients of Readability1, Readability2 and Readability3 are positive at the 1% significance level. These results suggest that the better the readability of financial statements promote the firms’ future value, which is consistent with the findings of Hwang & Kim (2017). The coefficients of Political\(\times\)Readbility1, Political\(\times\)Readability2 and Political\(\times\)Readability3 are all significantly negative at the 1% level, indicating that the political connections of senior executives would reduce the positive effect of the readability on the firms’ future value. Due to the weak motivation of the enterprises with political connections to deliver high-quality information disclosure, the readability of such enterprises' financial statements is reduced, leading to the decline in their market value.
Table 13. Economic consequences test
| (1) | (2) | (3) | |
|---|---|---|---|
| Tobint+1 | Tobint+1 | Tobint+1 | |
| Readability1 | 0.056*** | ||
| (2.74) | |||
| Readability2 | 0.057*** | ||
| (2.76) | |||
| Readability3 | 0.098*** | ||
| (5.22) | |||
| Political×Readability1 | -0.070*** | ||
| (-2.72) | |||
| Political×Readability2 | -0.068*** | ||
| (-2.59) | |||
| Political×Readability3 | -0.077*** | ||
| (-2.94) | |||
| Political | -0.033 | -0.034 | -0.030 |
| (-1.23) | (-1.25) | (-1.12) | |
| Tobin | 0.427*** | 0.427*** | 0.427*** |
| (40.41) | (40.42) | (40.48) | |
| Size | -0.382*** | -0.381*** | -0.380*** |
| (-20.03) | (-19.93) | (-20.77) | |
| Lev | 0.341*** | 0.349*** | 0.344*** |
| (4.05) | (4.15) | (4.09) | |
| Age | 0.112*** | 0.113*** | 0.103*** |
| (5.57) | (5.68) | (5.14) | |
| Growth | -0.093** | -0.091** | -0.084** |
| (-2.35) | (-2.32) | (-2.13) | |
| Indep | 0.111 | 0.103 | 0.120 |
| (0.35) | (0.33) | (0.38) | |
| Board | -0.067 | -0.070 | -0.069 |
| (-0.72) | (-0.76) | (-0.75) | |
| Dual | 0.026 | 0.025 | 0.028 |
| (0.94) | (0.91) | (1.03) | |
| Top10 | 0.531*** | 0.531*** | 0.544*** |
| (5.09) | (5.09) | (5.21) | |
| Cash | 0.792*** | 0.792*** | 0.800*** |
| (7.08) | (7.08) | (7.16) | |
| Constant | 10.046*** | 10.049*** | 9.976*** |
| (21.13) | (21.19) | (22.01) | |
| # of Obs. | 10453 | 10453 | 10453 |
| Adj. R2 | 0.446 | 0.446 | 0.447 |
Note: This table reports the regression results of the impact of managerial political connection on corporate firm. The ordinary least squares model is specified as: Tobini,t + 1 = β0 + β1Readabilityi,t + β2Readablilityi,t × Politicali,t + β3Politicali,t + β4Tobini,t + ∑Controlsi,t + ∑Year + ∑Ind + εi,t. See Appendix for all variable definitions. Standard errors are clustered at both firm and year level. Industry fixed effect and year fixed effect are both controlled in all regressions. *, **, and *** indicates statistical significance at the 10%, 5%, and 1% level, respectively.
6. Summary and Conclusion
The readability of financial statements can help reduce information asymmetry and maintain the stability of capital market. Therefore, it is of great significance to study the readability of text information disclosure by listed companies and analyze the related influencing factors. Especially, in the emerging market environment, political connections, as an important supplement to the economic system, play an important role. In fact, political connections can be regarded as an implicit contract reached between corporate executives and government officials, through which both sides may obtain the benefits they are seeking for. With the help of text analysis technology, this study examines the impact of managerial political connections on the readability of corporate financial statements, finding that the private-owned listed companies with political connections provides poor readable financial statements, while the negative impact is weakened in firms at higher marketization environment, which can deliver better corporate governance and more analyst coverage. Further research on the economic consequences demonstrates that the political connections may reduce the positive effect of readability on the future market value of enterprises.
6.1. Theoretical Implications
Generally, managers have two different information disclosure motives: information supply and information ambiguity. The theory on information supply claims that managers are willing to disclose textual information to form a useful supplement to data information. For example, when a company faces greater litigation risks, its managers would like to disclose more warning messages in their financial statements or improve the readability of the text. The theory on information ambiguity holds that if the market cannot fully reflect the vague information disclosed by a company, then when the company’s performance is poor, its managers will have a strong motivation to release vague text information, in order to conceal the its negative information from investors.
Private-owned enterprises may, in rent-seeking mechanisms, try to secure more financing facilities by establishing political ties with local governments as well as more tax incentives and governmental subsidies (Guillamón et al., 2021). The benefits and opportunities obtained by politically connected senior executives privately through informal channels are often illegal and unconventional. Therefore, management with political connection backgrounds often chooses to manipulate information disclosures and lower the information transparency. This study supplements the research on information disclosure quality from the perspective of concealment of rent-seeking income. It supports the information ambiguity theory.
6.2. Practical Implications
The findings of this study also deliver certain enlightenments for the emerging capital market countries to improve the efficiency of their capital market. First, the government should regulate the disclosure of text information of listed companies. In order to improve the information efficiency in capital market, regulatory authorities should strengthen the supervision of information disclosure by the private-owned companies with political connections and guide them to provide investors with concise and easy-to-understand financial statements. Second, the improvement in the marketization can effectively alleviate the negative effect of managerial political connections on text information disclosure. Therefore, the countries of emerging markets are required to keep improving the construction of capital market system by diminishing the information asymmetry between information publishers and users. Third, companies need to improve their corporate governance and information disclosure quality. Especially, in an environment of increasing macroeconomic uncertainty, it is necessary to actively enhance the readability of financial statements, so as to alleviate the information asymmetry.
6.3. Limitations and Future Research
Like previous researches, this study also has its limitations, which should be addressed in the future. First, based on the availability of data, the measurement of political connections is limited to the political background of corporate executives. However, many of the relationships are hidden. For example, the political background of social relations, such as relatives and friends of senior executives, may also be an important factor influencing political connections in the complex network society. Therefore, future exploration can pay more attention to the political connection information of senior executives' relatives and friends, so as to make the research conclusions more effective by refining the measurement methods of political connections. Second, most of the previous researches of the financial statement’s readability are made specific to English-speaking countries. This study investigates the impact under the Chinese context, which may not be a comprehensive measure. Therefore, future research can design more indicators to measure the readability of financial statements in different language contexts. Finally, further research can further explore the impact of the heterogeneity of senior executives on the level of readability, e.g., their education backgrounds, majors and academic qualifications.
Appendix. Variable Definitions
Independent Variable Measures
Readability1: We calculate the number of pages of each annual report, and then use the maximum and minimum values of the entire sample period to non-dimensionalize the number of annual reports’ pages. It equals to {1/ln(pages)-min[1/ln(pages)]}/{max[1/ln(pages)]-min[1/ln(pages)]}.
Readability2: We calculate the number of words of each annual report, and then use the maximum and minimum values of the entire sample period to non-dimensionalize the number of annual reports ‘words. It equals to {1/ln(words)-min[1/ln(words)]}/{max[1/ln(words)]-min[1/ln(words)]}.
Readability3: We calculate the number of sentences of each annual report, and then use the maximum and minimum values of the entire sample period to non-dimensionalize the number of annual reports ‘sentences. It equals to {1/ln(sentences)-min[1/ln(sentences)]}/{max[1/ln(sentences)]-min[1/ln(words)]}.
Dependent Variables Measures
Political: dummy variable. Referring to Faccio (2006) and Yuan (2015), if at least one of the chairman or general managers has served or is currently serving as a communist party representative, a deputy to the people’s congress, a member of the CPPCC, or a government official, it is considered to have political connection, that is, the value of political is 1, otherwise it is 0.
Moderating Variables Measures
Marketscore.: The degree of regional marketization which is measured by Wang et al. (2017).
CG_index: Corporate governance index, which is calculated by the first principal component loading coefficient of the 12 indexes.
Analyst: the natural logarithm of the number of analysts (team) following a focal listed firm.
Control Variables Measures
Roa: return on total assets.
Size: company size, which calculated by natural log of total assets
BTM: book-to-market ratio, which calculated by period-end book value divided by market value.
Lev: financial leverage ratio, which uses total liabilities divided by total assets.
Age: the logarithm of the firm’s age since the IPO.
Loss: if the net profit in the previous year was negative, the value is 1, otherwise the value is 0.
Growth: growth of the company, which is operational income growth rate.
RetVol: standard deviation of monthly stock returns.
EarnVol: standard deviation of operating earnings in the past five years.
Indep: the number of independent directors divided by total number of boards.
Board: natural logarithm of board members.
Dual: if the Chairperson also serves as CEO, it equals to 1; otherwise, it equals to 0.
Top10: top ten shareholders holding shares divided by the total shares.