What are you accumulating for? Managing slack resources in the face of a generalized economic downturn
ABSTRACT
Research to date has shown that a company can accumulate slack resources for a variety of reasons. But how do managers use this excess of resources in a general economic crisis? This study aims to ascertain how companies apply these resources when faced with a financial crisis and economic meltdown, in order to provide answers to the underexplored questions regarding the ways in which firms consume their slack resources. Through the analysis of a sample of 449 Spanish industrial companies during the 2006-2017 period, and the application of Latent Growth Modelling, the evolution of the different slack and performance indicators is observed for the identification of disparate behaviour between companies with high and low initial endowments of slack resources. The results also show that each type of slack serves a different purpose and, therefore, their consumption or use shows clear divergences.
Keywords: Earnings; Economic crisis; Re-investment.
JEL classification: M10; M20; M41.
¿Para qué acumulas? Gestionar los recursos no utilizados ante una recesión económica generalizada
RESUMEN
Las investigaciones realizadas hasta la fecha han demostrado que una empresa puede acumular un exceso de recursos por diversas razones. Pero, ¿cómo utilizan los directivos este exceso de recursos en una crisis económica generalizada? Este estudio pretende averiguar cómo aplican las empresas estos recursos cuando se enfrentan a una crisis financiera y a un colapso económico, con el fin de dar respuesta a las cuestiones poco exploradas sobre las formas en que las empresas consumen sus recursos holgados. Mediante el análisis de una muestra de 449 empresas industriales españolas durante el periodo 2006-2017, y la aplicación de la Modelización Latente del Crecimiento, se observa la evolución de los distintos indicadores de holgura y rendimiento para la identificación de comportamientos dispares entre empresas con altas y bajas dotaciones iniciales de recursos de holgura. Los resultados también muestran que cada tipo de holgura sirve a un propósito diferente y, por tanto, su consumo o utilización muestra claras divergencias.
Palabras clave: Beneficios; Crisis económica; Reinversión.
Códigos JEL: M10; M20; M41.
1. Introduction
Research to date has shown that firms accumulate slack resources for two main reasons (Bourgeois, 1981), to keep the necessary inputs in reserve to develop aggressive strategies and/or to protect itself against both external and internal adverse situations or shocks. In the latter case, companies would use these resources to maintain their performance and/or to ensure their survival (Carnes et al., 2019; Paeleman & Vanacker, 2015; Tan & Peng, 2003). But how do managers employ this excess of resources in a general economic crisis? Considering that there are different types of slack resources and that they present disparate natures (Bourgeois, 1981), the former question can be reformulated by asking: What is the process through which companies consume or use the different types of slack when confronting a crisis? Although this question has already been posed in the literature (Tsang, 2006), very few researchers have attempted to provide an answer by considering the different types of slack resources (Love & Nohria, 2005; Mellahi & Wilkinson, 2010; Namiki, 2013, 2016) and by means of the inclusion of an extended time span.
In general, researchers have pointed out the benefits of having more resources than those strictly necessary for the normal operation of an organization (Bromiley, 1991; Daniel et al., 2004; Gral, 2014). However, certain studies suggest that the impact on performance depends not on the level or quantity of these slack resources, but rather on how firms consume or employ these resources to achieve the objectives that originally justified their accumulation (Carnes et al., 2019; Cheng & Kesner, 1997; Deb et al., 2017). Therefore, it is the variation of slack resources, i.e., their consumption, and their accumulation (Lavie, 2012), and not the mere possession thereof, that enables the operationalization of the relationship between slack and performance to be understood (Daniel et al., 2004; Namiki, 2016).
In order to successfully cover this gap in the research on slack resources, this study strives to analyse how organizations consume, apply, and/or manage these resources within an unfavourable context, such as an economic meltdown.
Due to the scarcity of the literature regarding resource consumption, we draw on the existing literature into which this behaviour can be assimilated. From the literature on downsizing effects (Keum, 2019; Mellahi & Wilkinson, 2010; Love & Nohria, 2005), it can be identified how companies adjust their levels of resources, mostly human, in certain situations (Cheng & Kesner, 1997). Similarly, the use of retrenchment has also been analysed in the literature to tackle major business crises (Lim & McCann, 2013; Morrow, et al., 2004; Baker & Mone, 1994), and to study how the reduction of assets and costs in a turnaround process affects business recovery (Barbero et al., 2020; Barker & Duhaime, 1997; Rico et al., 2021; Tangpong et al., 2015). Finally, several finance-oriented researchers have studied the management of liquidity and other financial resources in situations of widespread economic crisis (Campello et al., 2011; Deb et al., 2017; Jiang & Lie, 2016; Jung et al., 2020; Kim & Bettis, 2014). However, most of these studies consider relatively short periods of time and focus on a particular outcome of the effect of these resources.
In order to move forward in our understanding of how companies use or consume slack resources, this study aims to ascertain how companies apply these resources when they face a general economic crisis. This application of resources is determined by studying the evolution of the different types of slack during the periods of crisis and of economic recovery, for which the average or common response of companies to these economic shocks is considered, and by considering the average or common response of companies to these economic shocks. Instead of taking into account whether the individual response of a company has positive or negative results, as in previous studies, our focus is on how companies use these resources in a situation of generalised crisis (Flammer & Ioannou, 2021; Zona, 2012).
Given the absence of existing theories on economic meltdowns (Flammer & Ioannou, 2021), we adopt a fact-based, exploratory approach (Flammer & Ioannou, 2021; Hambrick, 2007; Helfat, 2007) and focus our study on observing the impact of a specific situation on a firm-level analysis that links to the possible explanation of non-identical situations, such as downturn and crisis, that can be found in the literature on organizational slack.
This study analyses the case of Spain, which is one of the countries where the crisis had its greatest impact, and uses a sample of 449 Spanish industrial companies, with indicators of the different types of slack covering the period 2006-2017. This period includes both the years prior to the major crisis, which began in 2008, and the subsequent years of recovery. In order to analyse the consumption or application (variation) of slack resources, we use a growth curve modelling (GCM) approach (Bergh & Fairbank, 2002; Lessne & Hanumara, 1988; Revilla & Fernandez, 2013), which makes it possible to study the change in variables over time for a set of companies or individuals for whom repeated measurements are available.
The results show a difference in behaviour between companies with high initial endowments of slack resources and those with low initial endowments, and the type of slack also influences behaviour. At the beginning of the crisis, companies are mainly focused on ‘protecting the cash box’, acting immediately on the available slack, while the potential slack reveals a different evolution.
The study contributes to the literature and practice of slack resources in various ways. First, most research on slack is cross-sectional and therefore incapable of providing answers to consumption or application issues (Paeleman & Vanacker, 2015). The present study uses an extended period of time, as requested by several authors (Carnes et al., 2019; Daniel et al., 2004), which enables the analysis not only of the application or consumption of slack resources, but also of their possible accumulation in a process of economic recovery, thereby considering the complete management that companies make of this type of resource. Second, the few studies that analyse the consumption process have used a variance-based approach (Love & Nohria, 2005; Namiki et al., 2016; Paeleman & Vanacker, 2015), while the present work uses a more dynamic approach, which has not previously been employed in the analysis of slack resources, and is valuable in the study of change (Bergh & Fairbank, 2002). From a practical point of view, although the study lacks any normative or predictive characteristics, company managers can learn how a group of companies, when faced with a generalised crisis, employ their slack resources depending on their level of slack, and how they manage these resources once the recovery process has begun: all with the hindsight that all the companies analysed have survived the crisis period and continue operating in the recovery period.
2. Theoretical framework
Organizational slack is a resource buffer, above that necessary to produce a given level of output, and can be deployed in a variety of ways to achieve the objectives of an organization (Bourgeois, 1981; Sharfman et al., 1988). This commonly accepted definition reflects, to a certain extent, the versatility of this type of resource, since the slack can play numerous roles and functions (Gral, 2014; Karacay, 2017), associated to different types of slack, being the typology set by Bourgeois (1981) the most accepted (differentiating available, recoverable, and potential slack) and supporting a variety of actions to achieve organizational goals (Sharfman et al., 1988), including adaptation to internal and external pressures (Bourgeois, 1981) and the promotion of adaptation and change (Carnes et al., 2019).
However, there are two contradictory positions regarding the usefulness of these resources. The Resource-Based View (Barney, 1991) and the Theory of Organizational Behaviour (Cyert & March, 1963) have each been used to justify the positive effect of slack resources on certain organizational variables (Pitelis, 2007). In contrast, agency theory (Jensen & Meckling, 1976) considers that an excess of resources can be understood as evidence of their inefficient management (George, 2005), or as a source of conflict due to the search for their appropriation (Bourgeois, 1981; Nohria & Gulati, 1997; Tan & Peng, 2003).
2.1. Organizational slack and crisis
To date, many researchers have tried to answer the question regarding whether organizational slack grants the ability of firms to face environmental shifts (Latham & Braun, 2009). During economic recessions, as environmental munificence decreases, liquidity and adequate financing become critical for the survival and performance of a firm. Indeed, many of these recessions are characterized by shocks in demand which affect the cost structures and returns of such firms (Zarnowitz, 1999).
The different studies that have analysed the effects of slack in a situation of financial crisis (Bradley et al., 2011; Tang et al., 2015; Zona, 2012), point out that this type of resource allows companies to act when confronted with uncertain situations (Meier et al., 2013) and to protect themselves to guarantee their survival (Evans, 1991). Tan & Peng (2003) state that, in crisis situations, resource scarcity forces companies to use their slack resources to ensure survival, although the maintenance of high levels of this type of resource in periods of munificence can negatively affect performance (Vanacker et al., 2017). In this respect, the availability of high levels of slack resources, especially those considered flexible (Arslan-Ayaydin et al., 2014), enables the company to create various strategic options to tackle the crisis (Klingebiel & Adner, 2015), which allows, through redeployment or consumption, the effects of external adversities to be halted (Wenzel et al., 2021).
From a theoretical perspective, it is possible to find contradicting proposals regarding holding slack resources in an adverse environment. On the one hand, many researchers follow the idea that, when a firm is facing a situation of generalised crisis that reduces its profitability and may threaten its survival, the firm will use its slack resources to deal with said situation and the uncertainty that it entails (Bourgois and Singh, 1983). Most of the results found in the literature suggest that there is a benefit of possessing slack resources when facing a crisis (Arslan-Ayaydin et al., 2014; Hendrick, 2006; Latham & Braun, 2009; Marlowe, 2005; Zona, 2012). In this respect, firms with slack tend to react to environmental changes more proactively than those without (Cheng & Kessner, 1997), and the results show that the availability of slack resources positively influences the capability of a firm to respond to environmental change (Cheng & Kesner, 1997), which grants organizational slack a contingent effect.
On the other hand, certain studies have found that the possession of high levels of slack may slow down the speed of reaction to recessions or crises (Arogyaswamy et al., 1995; Mellahi & Wilkinson, 2010; Namiki et al., 2015), and that even these slack resources may not be fully consumed in order to prevent possible situations from arising that would affect the survival of the firm (Campello et al., 2011).
All in all, as Bourgeois (1981, p. 38) stated, “Slack is not planned [...] but perhaps it should be”. Indeed, there are slack gainers and losers which reinforces the relevance of their deliberate management of the firm’s organizational slack (Hambrick & D’Aveni, 1988; Cheng & Kesner, 1997).
2.2. Slack Consumption
The Resource-Based View has not yet paid much attention to understanding how resources are accumulated and used (Lavie, 2012), and even less to the deployment of slack resources (Flammer & Ioannou, 2021; Namiki et al., 2015, 2016).
As mentioned earlier, organizational slack has been regarded as an instrument with particular importance for those companies that face environmental turbulence, such as that provoked by an economic recession (Bradley et al., 2011; Cheng & Kesner, 1997; Latham & Braun, 2008; Zona, 2012). In this situation, the key challenge to effective management involves the application of a firm’s available resources in order to minimize the impact of exogenous threats on the organization while attempting both to capture the opportunities and to guarantee the survival of the firm.
Bourgeois (1981) has already emphasized the need to analyse the consumption of this type of resource for the understanding of its effect. Unfortunately, later work that has continued with this approach, has only considered holdings of slack resources, instead of focusing on their consumption (Flammer & Ioannou, 2021; Namiki et al., 2016). Therefore, no clear understanding has yet been reached regarding how companies employ these resources in order to offer a better environmental response (Cheng & Kesner, 1997), and "without a clear specification of slack's utilization, our understanding of how and when slack affects performance will remain conflicted and limited" (Carnes et al., 2019, p.58).
Since there are multiple functions and types of slack resources (Bourgeois, 1981; Gral, 2014; Song & Choi, 2017; Stan et al., 2014), their consumption, deployment, and application must respond to different patterns. In this respect, the literature has analysed these particular characteristics in specific situations of the company, such as in cases of turnaround and retrenchment, in downsizing processes in relation to human resources, and in liquidity management when the company faces widespread financial crises.
2.3. Slack consumption as a retrenchment action
The specific literature on slack makes very few allusions to "asset and cost retrenchment" (for exceptions, see Lim et al., 2013; Morrow et al., 2004; Sharfman et al., 1988), which can be defined as "deliberately eliminating assets and/or reducing costs as a means of increasing firm efficiency" (Lim & McCann, 2013, p.43). This definition links directly to slack resource management from an inefficiency-based perspective (George, 2005). Indeed, cost retrenchment refers to the net reduction of total costs (such as selling, general, and administrative expenses (SGA), interest expenses, and miscellaneous costs (Robbins & Pearce, 1992; Lim & McCann, 2013)), which enables this management process to be linked to the use or application of recoverable slack. Most of the literature enhances the use of these cuts in a business crisis; more recently, however, researchers have also considered a contingent approach for the effects of retrenchment (Dewitt, 1998; Francis & Pett, 2004; Guthrie & Datta, 2008; Morrow et al., 2004). These cuts, especially those in costs, may therefore respond to decreases in the munificence of the environment (Boyne & Meier, 2009). However, and despite the fact that this response to crisis is necessary largely in the short run (Wenzel et al., 2021), the long-term viability of this response remains far from uncontested (Chadwick et al., 2004; Wenzel et al., 2021).
2.4. Slack consumption through the lens of downsizing
Downsizing is defined as "the decision of a company to reduce its human resource capacity that exceeds the requirements necessary for the efficient operation of the company" (Mellahi & Wilkinson, 2010: 485), and directly relates to recoverable slack. Within the extensive literature on downsizing, most studies have analysed how this process affects innovation (Dougherty & Bowman, 1995; Mellahi & Wilkinson, 2010) and performance (Love & Nohria, 2005; Guthrie & Datta, 2008). Mellahi & Wilkinson (2010) point out that one of the main weaknesses of the studies linking slack and innovation lies their exclusive focus on the level of slack holdings and their consequent neglect of the impact on innovation of a sudden reduction in slack. This constitutes a major gap in this field of research, since companies regularly adjust their level of slack in consonance with the business environment in which they operate in order to remain competitive (Cheng & Kesner, 1997). Mellahi & Wilkinson (2010) conclude that the relationship between the reduction of this available slack and innovation is more complex than initially thought, and consequently more dynamic studies are required into this issue.
2.5. Slack consumption by liquidity management
Finally, in the area of finance, numerous studies analyse liquidity management and other financial decisions of companies in a situation of widespread crisis (Nason & Patel, 2016; Campello et al., 2011; Jung et al., 2020, among others). These slack financial resources are usually related to available and potential slack (Voss et al., 2008). Available slack, associated with liquid assets, constitutes a major element of protection against the environment and facilitates adaptation and the search for options (Deb et al., 2017; Kim & Bettis, 2014). Thus, in circumstances where a rapid response is required, this type of resource is particularly relevant (Kim & Bettis, 2014), since it is vital for survival and reaction to crises (Arslan-Ayaydin et al., 2014; Campello et al., 2011; Nason & Patel, 2016). Along with liquidity, several authors have argued that the firm's leverage, that is, the potential slack, is of particular significance in crisis situations, even beyond that of liquid resources (Arslan-Ayaydin et al., 2014). In this respect, empirical evidence has shown that companies with higher levels of slack present a greater decline in profitability at the beginning of the crisis; however, they also show a higher increase in profitability in the recovery period (Latham et al., 2008; Latham & Braun, 2009).
3. Sample and methodology
The analysis of the consumption patterns of slack resources requires evaluation of longitudinal information on the variables. Most of slack resources can be measured by means of the information contained in the financial statements (Bourgeois, 1981). Data were retrieved from the database of the Iberian Balance-Sheet Analysis System (known as SABI in its Spanish acronym) for the 2007-2017 period. This time span is justified because it includes both the years prior to the major crisis, which began in 2008, and the subsequent years of recovery.
In order to reduce sectoral heterogeneity (Gral, 2014), our study focused on industrial companies, and the sectors ranging from NACE 20 to 38, inclusive, were selected exclusively. The sample selection process began with all those companies that had had a favourable audit report, or a favourable audit report with qualifications, in each and every year of the period considered, which resulted in a total of 645 companies being selected. This criterion guarantees, to a certain extent, the reliability of the information, since extreme situations are successfully excluded by an external audit. At the same time, companies that failed to present information for any single variable of those proposed were discarded. The resulting sample of the study was thereby reduced to 449 industrial companies.
For the purpose of our study, and following the approach of Bentley & Kehoe (2020), those companies within the sample that have a slack level above the industry average were singled out. This is justified since our interest lies in ascertaining how companies that have accumulated slack either consume it or apply it in a situation of economic crisis. However, although the study focuses on those companies with greater slack, the behaviour of companies with little or no slack were also analysed, since all companies were affected by the economic meltdown (Flammer & Ioannou, 2021). Logically, the use that these latter types of companies can make of slack should differ.
With regard to the measurement of the variables, we distinguish between the three types of slack considered: available, recoverable, and potential (Bourgeois & Singh, 1983). Following reviews made in the literature (Carnes et al., 2019; Daniel et al., 2004; Gral, 2014; Karacay, 2017), it was found that the most frequent indicators used in the measurement of available slack include the Current ratio (CR) and the Quick ratio (QR); for the potential slack, this indicator is the leverage ratio (debt/equity (D/E) ratio); and where the greatest variety exists lies in the measurement of recoverable slack with measures associated to predominance of general expenses, R&D, marketing or human resources. Given the information that companies must report in their annual statements, the measure of personnel expenses over income (PE/I) (Karacay, 2017; Lecuona & Reitzig, 2014; Paeleman; Vanacker, 2015) was chosen since personnel expenses constituted one of the key elements in the 2008 financial crisis, particularly in Spain. Two measures are used for the available slack, since the CR is the most commonly used measure for this type of slack (Daniel et al., 2004; Carnes et al., 2019); although there is also an increasing number of studies that have emphasised the importance of cash in business management and strategy (Deb et al., 2017; Kim & Bettis, 2014), especially in cases of widespread financial crises (Campello et al., 2011), with the QR being the most widely used measure of this variable. Along with the measures of the slack variables, the study also considers two performance measures, those of ROA and Sales, in order to ascertain and compare the evolution of these variables.
The period of analysis (2007-2017) was divided into two subperiods (2007-2012 and 2012-2017), whereby the last year of the first subperiod coinciding with the first year of the second subperiod. The first sub-period corresponds to the years immediately following the major economic crisis that Spain suffered from 2008 onwards. In that year, the Spanish economy technically entered into recession by accumulating three consecutive quarters of reduction in GDP. After a brief and momentary recovery in 2010, GDP growth became negative again until the end of 2013 (National Institute of Statistics). In that period, unemployment rose from 8% in 2007 to 27% in 2013, with more than six million unemployed. The number of companies contracted by 30% with the disappearance of more than 1.5 million companies. As in many other countries (Eurostat), but with particular virulence in Spain, the crisis that began in 2008 has become known as the Great Recession and constitutes the most dramatic financial situation known to the Spanish economy since the Civil War of 1936 and up to the Covid19 crisis. The recovery began at the end of 2013, with GDP growing positively in 2014 and remaining clearly above the European average from 2015 onward.
Figure 1. Gross Domestic Product
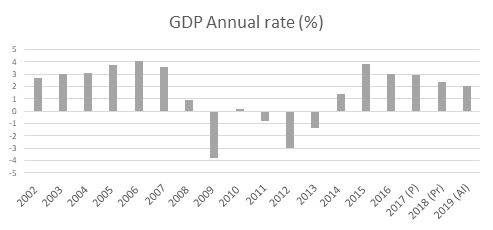
Source: National Institute of Statistics (INE)
Note: (Pr) Preview, (P) Provisional, (AI) Anticipated Indicator
Due to the use of four different types of slack and two sub-periods, the analysis involved working with eight different populations based on whether, in the initial year of each sub-period (2007 and 2012), the value of the slack considered was either above or below the average, so that the extent of the slack that had been consumed or accumulated in the subsequent 5 years could be verified.
3.1. Analytic Approach: Growth Curve Modelling
As mentioned earlier, one of the main limitations of the analysis of slack resources is, with few exceptions (Flammer & Ioannou, 2021; Love & Nohria, 2005; Namiki et al., 2013, 2016), that studies have considered the level or holding of slack as a determinant of performance. However, the work of Bourgeois (1981) had previously stated that it is the application of these resources that can lead to the desired results, and more recently, Carnes et al. (2019) have pointed out the need for the specification of the use of such slack resources in order to determine how these resources affect performance. The few studies that have examined the consumption or application of slack resources have used a variation-based approach (Namiki et al., 2013, 2016). Although this type of analysis allows us to understand the sensitivity of resource use, it fails to determine the overall trajectory or pattern of use, nor does panel data analysis make this possible.
Bergh & Fairbank (2002) suggested the possibility of studying the level of a variable as a function of time (Linn, 1981, p.89) by means of growth curve modelling (GCM), which offers interesting solutions for the mapping and understanding of the nature of change within the strategic management field. To be precise, this technique is particularly suitable when the researchers have access to repeated measures for the same individuals over time (Duncan & Duncan, 2004).
In this study, latent-growth structural equation modelling (SEM) is applied using AMOS 25.0 (Ferrer et al., 2004; Schumacker & Lomax, 2004), although other options do exist, such as Hierarchical Level Modelling (Revilla & Fernandez, 2013). Specifically, SEM is appropriate since it provides a statistical test to determine whether the relationships proposed for the sample follow a common developmental path, as depicted by latent-growth parameters, or whether each relationship develops along a unique trajectory. Structural equation modelling also offers statistical tests of the overall model fit (Duncan & Duncan, 2004). Although SEM can be challenged by unbalanced panels, our panel is balanced since it only includes firms whose data covers each and every period under analysis. We therefore follow the suggestion by which the application of Latent Growth Modelling requires the researcher to carefully select a sample with a focus on the substantive latent variables whose changes provide the necessary means to test the hypotheses (Williams et al., 2009).
The analysis from an SEM perspective requires two phases. First, the "form" or shape that the trajectory or change of the variable has over time should be identified. In this respect, and unlike other techniques, this form is not imposed. Second, following this identification stage, the characteristics of the trajectory can be analysed.
4. Results
Table 1 contains the descriptive statistics of the different variables of the study for the samples used. Note that the size of each sample is different since the selection criterion for determining high or low slack is the sector average. These differences in size do not affect the determination of the growth curves for each of the samples considered. The data indicates that there are notable and clearly significant differences in the initial levels of all the variables analysed between the companies with high slack and those with low or no slack.
In order to analyse the growth curves, instead of setting all possible shapes to the curve, and due to the limitations of degrees of freedom, three models were used: linear, quadratic, and an unspecified growth function model (Meredith & Tisak, 1990). This latter model is acceptable when the shape of the trajectories remains unknown and data can determine the shape of the curve (Duncan & Duncan, 2004). In Table 2, the results of the different models tested are presented for each of the two periods: that beginning in 2007 and that beginning in 2012.
Due to the difference in the samples, the selection of the models was made following the proposal for the use of more than one indicator (Hair et al., 1998), especially including that of Hu & Bentler (1999). Specifically, the values obtained for the CFI, RMSEA, and SRMR have been taken into account.
Table 1 – imagen grande tumbda
| N | Mean | S.D. | 2017 CR | 2016 CR | 2015 CR | 2014 CR | 2013 CR | 2012 CR | 2011 CR | 2010 CR | 2009 CR | 2008 CR | 2007 CR | 2017QR | 2016QR | 2015QR | 2014QR | 2013QR | 2012QR | 2011QR | 2010QR | 2009QR | 2008QR | 2007QR | 2017D/E | 2016D/E | 2015D/E | 2014D/E | 2013D/E | 2012D/E | 2011D/E | 2010D/E | 2009D/E | 2008D/E | 2007D/E | 2017PE/I | 2016PE/I | 2015PE/I | 2014PE/I | 2013PE/I | 2012PE/I | 2011PE/I | 2010PE/I | 2009PE/I | 2008PE/I | 2007PE/I | |
|---|---|---|---|---|---|---|---|---|---|---|---|---|---|---|---|---|---|---|---|---|---|---|---|---|---|---|---|---|---|---|---|---|---|---|---|---|---|---|---|---|---|---|---|---|---|---|---|
| 2017 CR | 457 | 2.31 | 1.93 | ||||||||||||||||||||||||||||||||||||||||||||
| 2016 CR | 457 | 2.31 | 1.72 | .861** | |||||||||||||||||||||||||||||||||||||||||||
| 2015 CR | 457 | 2.25 | 1.80 | .701** | .880** | ||||||||||||||||||||||||||||||||||||||||||
| 2014 CR | 457 | 2.20 | 1.73 | .642** | .793** | .851** | |||||||||||||||||||||||||||||||||||||||||
| 2013 CR | 457 | 2.14 | 1.57 | .642** | .762** | .789** | .914** | ||||||||||||||||||||||||||||||||||||||||
| 2012 CR | 457 | 2.13 | 1.68 | .587** | .731** | .823** | .761** | .834** | |||||||||||||||||||||||||||||||||||||||
| 2011 CR | 457 | 2.10 | 1.66 | .598** | .711** | .771** | .738** | .813** | .933** | ||||||||||||||||||||||||||||||||||||||
| 2010 CR | 457 | 1.95 | 1.29 | .515** | .620** | .672** | .719** | .823** | .849** | .887** | |||||||||||||||||||||||||||||||||||||
| 2009 CR | 457 | 2.03 | 1.88 | .481** | .666** | .788** | .650** | .655** | .855** | .826** | .733** | ||||||||||||||||||||||||||||||||||||
| 2008 CR | 457 | 1.92 | 1.98 | .430** | .597** | .730** | .561** | .555** | .803** | .782** | .637** | .937** | |||||||||||||||||||||||||||||||||||
| 2007 CR | 457 | 1.66 | 1.01 | .491** | .623** | .622** | .655** | .654** | .683** | .716** | .725** | .722** | .743** | ||||||||||||||||||||||||||||||||||
| 2017QR | 457 | 0.41 | 0.80 | .734** | .536** | .449** | .349** | .366** | .408** | .396** | .293** | .314** | .313** | .249** | |||||||||||||||||||||||||||||||||
| 2016QR | 457 | 0.40 | 0.64 | .699** | .735** | .592** | .456** | .450** | .499** | .507** | .379** | .434** | .424** | .393** | .745** | ||||||||||||||||||||||||||||||||
| 2015QR | 457 | 0.33 | 0.52 | .535** | .608** | .628** | .490** | .478** | .490** | .477** | .395** | .423** | .428** | .380** | .661** | .835** | |||||||||||||||||||||||||||||||
| 2014QR | 457 | 0.28 | 0.42 | .404** | .445** | .433** | .486** | .490** | .420** | .432** | .398** | .271** | .268** | .360** | .515** | .664** | .795** | ||||||||||||||||||||||||||||||
| 2013QR | 457 | 0.26 | 0.41 | .405** | .453** | .429** | .459** | .530** | .431** | .419** | .398** | .302** | .288** | .361** | .520** | .645** | .748** | .830** | |||||||||||||||||||||||||||||
| 2012QR | 457 | 0.23 | 0.38 | .338** | .379** | .390** | .410** | .477** | .485** | .475** | .444** | .351** | .373** | .417** | .457** | .549** | .638** | .745** | .814** | ||||||||||||||||||||||||||||
| 2011QR | 457 | 0.23 | 0.42 | .310** | .362** | .380** | .356** | .414** | .467** | .522** | .461** | .405** | .466** | .480** | .414** | .534** | .596** | .641** | .705** | .817** | |||||||||||||||||||||||||||
| 2010QR | 457 | 0.23 | 0.39 | .304** | .350** | .373** | .387** | .472** | .451** | .457** | .540** | .375** | .364** | .476** | .362** | .445** | .562** | .618** | .694** | .773** | .791** | ||||||||||||||||||||||||||
| 2009QR | 457 | 0.26 | 0.50 | .346** | .443** | .433** | .448** | .490** | .462** | .491** | .496** | .505** | .472** | .581** | .283** | .417** | .457** | .512** | .563** | .643** | .698** | .761** | |||||||||||||||||||||||||
| 2008QR | 457 | 0.23 | 0.65 | .320** | .460** | .560** | .391** | .367** | .570** | .564** | .402** | .678** | .776** | .603** | .330** | .438** | .482** | .355** | .432** | .553** | .683** | .559** | .662** | ||||||||||||||||||||||||
| 2007QR | 457 | 0.31 | 0.59 | .418** | .526** | .508** | .525** | .487** | .452** | .485** | .439** | .509** | .549** | .791** | .282** | .429** | .438** | .408** | .438** | .461** | .517** | .535** | .673** | .669** | |||||||||||||||||||||||
| 2017D/E | 457 | 1.40 | 4.06 | -.147** | -.158** | -.141** | -.130** | -.140** | -.127** | -.142** | -.145** | -.111* | -0.09 | -.116* | -0.07 | -.104* | -.096* | -0.08 | -0.08 | -0.08 | -0.09 | -.093* | -0.09 | -0.06 | -0.08 | ||||||||||||||||||||||
| 2016D/E | 457 | 1.31 | 2.57 | -.190** | -.228** | -.209** | -.195** | -.203** | -.183** | -.196** | -.200** | -.157** | -.131** | -.163** | -0.08 | -.149** | -.138** | -.117* | -.104* | -.096* | -.108* | -.124** | -.125** | -0.08 | -.113* | .362** | |||||||||||||||||||||
| 2015D/E | 457 | 1.33 | 3.35 | -.180** | -.165** | -.157** | -.154** | -.156** | -.139** | -.146** | -.152** | -.129** | -.121** | -.149** | -.106* | -.118* | -.113* | -.102* | -0.09 | -0.08 | -0.09 | -.099* | -.099* | -0.07 | -.126** | .143** | .709** | ||||||||||||||||||||
| 2014D/E | 457 | 1.47 | 2.93 | -.194** | -.208** | -.208** | -.229** | -.225** | -.200** | -.208** | -.211** | -.169** | -.143** | -.167** | -.111* | -.158** | -.160** | -.158** | -.142** | -.138** | -.132** | -.150** | -.142** | -.102* | -.144** | .314** | .630** | .796** | |||||||||||||||||||
| 2013D/E | 457 | 1.45 | 2.91 | -.188** | -.203** | -.205** | -.214** | -.230** | -.202** | -.212** | -.220** | -.168** | -.145** | -.186** | -.104* | -.147** | -.152** | -.151** | -.137** | -.135** | -.131** | -.152** | -.142** | -.106* | -.151** | .608** | .541** | .684** | .849** | ||||||||||||||||||
| 2012D/E | 457 | 1.36 | 3.07 | -.155** | -.145** | -.142** | -.167** | -.181** | -.171** | -.168** | -.180** | -.144** | -.139** | -.178** | -.103* | -.106* | -.105* | -.107* | -.095* | -.100* | -.095* | -.119* | -.113* | -0.09 | -.137** | -.101* | .245** | .463** | .369** | .233** | |||||||||||||||||
| 2011D/E | 457 | 1.95 | 8.28 | -0.08 | -0.08 | -0.08 | -.096* | -.104* | -.096* | -.099* | -.095* | -0.09 | -0.08 | -.094* | -0.05 | -0.07 | -0.08 | -0.08 | -0.07 | -0.07 | -0.07 | -0.08 | -0.08 | -0.04 | -0.06 | .265** | .188** | .245** | .279** | .313** | .563** | ||||||||||||||||
| 2010D/E | 457 | 13.07 | 223.52 | -0.04 | -0.05 | -0.04 | -0.04 | -0.04 | -0.04 | -0.04 | -0.04 | -0.03 | -0.02 | -0.04 | -0.03 | -0.03 | -0.03 | -0.04 | -0.03 | -0.03 | -0.03 | -0.03 | -0.03 | -0.02 | -0.03 | .734** | .300** | .139** | .278** | .570** | -.444** | 0.01 | |||||||||||||||
| 2009D/E | 457 | 1.29 | 11.33 | -0.04 | -0.03 | -0.04 | -0.04 | -0.04 | -0.03 | -0.03 | -0.03 | -0.02 | -0.02 | -0.03 | 0.01 | 0.01 | 0.02 | 0.01 | -0.01 | -0.02 | -0.02 | -0.02 | -0.02 | -0.01 | -0.02 | -0.01 | 0.07 | 0.05 | 0.07 | 0.02 | .122** | .116* | -0.08 | ||||||||||||||
| 2008D/E | 457 | 2.24 | 8.45 | -0.07 | -0.06 | -0.07 | -.099* | -.099* | -0.09 | -.093* | -.094* | -0.09 | -0.08 | -0.09 | -0.07 | -0.07 | -0.08 | -0.08 | -0.07 | -0.07 | -0.08 | -0.09 | -0.09 | -0.06 | -0.07 | 0.08 | .195** | .233** | .234** | .197** | .300** | .770** | 0.09 | 0.04 | |||||||||||||
| 2007D/E | 457 | 1.66 | 9.75 | -0.05 | -0.04 | -0.04 | -0.06 | -0.05 | -0.05 | -0.06 | -0.05 | -0.04 | -0.04 | -0.03 | -0.03 | -0.02 | -0.03 | -0.02 | -0.03 | -0.03 | -0.04 | -0.03 | -0.04 | -0.02 | -0.03 | .207** | .265** | .197** | .206** | .240** | -.252** | .108* | .372** | 0.00 | .263** | ||||||||||||
| 2017PE/I | 457 | 19.70 | 11.76 | .187** | .182** | .137** | .177** | .181** | .115* | .149** | .130** | 0.07 | 0.05 | .142** | 0.05 | .109* | 0.09 | .137** | .146** | .120** | .104* | .110* | .098* | 0.03 | .111* | -0.08 | -.097* | -0.09 | -.097* | -.106* | -0.02 | -.104* | -0.07 | 0.03 | -.126** | -0.09 | |||||||||||
| 2016PE/I | 457 | 19.99 | 11.72 | .092* | .117* | .123** | .170** | .175** | .118* | .130** | .121** | 0.07 | 0.05 | .103* | 0.04 | 0.04 | 0.07 | .149** | .157** | .133** | .109* | .106* | 0.08 | 0.03 | 0.07 | -0.07 | -.093* | -.094* | -.108* | -.110* | -0.01 | -.104* | -0.08 | 0.02 | -.117* | -.093* | .929** | ||||||||||
| 2015PE/I | 457 | 19.87 | 12.13 | .153** | .111* | .105* | .159** | .165** | .124** | .133** | .132** | 0.07 | 0.06 | .102* | .131** | 0.05 | 0.07 | .139** | .136** | .136** | .110* | .121** | 0.09 | 0.03 | 0.06 | -0.07 | -0.08 | -0.09 | -0.09 | -.098* | -0.02 | -.100* | -0.08 | 0.01 | -.135** | -.098* | .910** | .942** | |||||||||
| 2014PE/I | 457 | 20.03 | 11.64 | .094* | .132** | .135** | .180** | .205** | .152** | .170** | .161** | .111* | 0.09 | .123** | 0.03 | 0.06 | 0.09 | .139** | .157** | .148** | .127** | .122** | .094* | 0.05 | 0.07 | -0.09 | -.111* | -.095* | -.112* | -.120* | -0.02 | -.112* | -0.08 | 0.01 | -.130** | -.105* | .924** | .936** | .936** | ||||||||
| 2013PE/I | 457 | 20.25 | 12.06 | .096* | .140** | .146** | .191** | .211** | .164** | .181** | .178** | .118* | .095* | .126** | 0.03 | 0.07 | 0.09 | .131** | .140** | .151** | .122** | .130** | 0.09 | 0.04 | 0.07 | -0.08 | -.101* | -0.09 | -.112* | -.120* | -0.03 | -.112* | -0.08 | 0.01 | -.136** | -.104* | .902** | .911** | .918** | .963** | |||||||
| 2012PE/I | 457 | 20.52 | 12.28 | .149** | .184** | .156** | .199** | .214** | .159** | .190** | .180** | .123** | .099* | .158** | 0.04 | .097* | 0.09 | .111* | .126** | .127** | .104* | .120* | 0.09 | 0.04 | .093* | -0.09 | -.114* | -0.09 | -.101* | -.110* | -0.02 | -.109* | -0.08 | 0.01 | -.136** | -.108* | .901** | .889** | .887** | .928** | .951** | ||||||
| 2011PE/I | 457 | 19.94 | 11.89 | .102* | .147** | .139** | .176** | .189** | .126** | .153** | .162** | .100* | 0.08 | .128** | 0.03 | 0.07 | .097* | .107* | .125** | .106* | .105* | .122** | 0.07 | 0.03 | 0.07 | -0.08 | -.094* | -0.08 | -.096* | -.099* | 0.01 | -.100* | -0.08 | 0.00 | -.133** | -.111* | .874** | .880** | .890** | .933** | .936** | .945** | |||||
| 2010PE/I | 457 | 19.92 | 11.71 | .092* | .125** | .123** | .146** | .165** | .106* | .121** | .143** | .099* | 0.07 | .110* | 0.02 | 0.05 | 0.08 | 0.07 | .106* | 0.09 | 0.08 | .109* | 0.07 | 0.02 | 0.05 | -0.08 | -.093* | -0.07 | -0.09 | -0.09 | 0.02 | -.104* | -0.08 | 0.01 | -.131** | -.133** | .852** | .849** | .854** | .896** | .903** | .931** | .947** | ||||
| 2009PE/I | 457 | 21.43 | 12.39 | 0.06 | 0.09 | 0.09 | .117* | .125** | .093* | .106* | .128** | 0.08 | 0.07 | .117* | -0.01 | 0.00 | 0.03 | 0.03 | 0.06 | 0.05 | 0.06 | 0.07 | 0.04 | 0.01 | 0.03 | -0.08 | -.099* | -0.08 | -.102* | -.097* | 0.00 | -.110* | -0.09 | 0.01 | -.121** | -.128** | .806** | .814** | .822** | .865** | .855** | .866** | .888** | .912** | |||
| 2008PE/I | 457 | 18.63 | 11.16 | 0.07 | 0.08 | 0.05 | 0.06 | 0.08 | 0.05 | 0.08 | 0.09 | 0.04 | 0.04 | 0.09 | -0.01 | 0.03 | 0.04 | 0.04 | 0.06 | 0.03 | 0.05 | 0.05 | 0.01 | -0.01 | 0.02 | -0.06 | -0.09 | -0.07 | -0.08 | -0.09 | 0.03 | -.101* | -0.08 | 0.03 | -.131** | -.243** | .804** | .790** | .811** | .846** | .844** | .846** | .881** | .882** | .895** | ||
| 2007PE/I | 457 | 17.48 | 10.53 | 0.06 | 0.07 | 0.04 | 0.05 | 0.06 | 0.03 | 0.06 | 0.05 | 0.02 | 0.02 | 0.07 | -0.01 | 0.04 | 0.04 | 0.05 | 0.07 | 0.06 | 0.05 | 0.06 | 0.03 | 0.00 | 0.03 | -0.06 | -0.08 | -0.07 | -0.08 | -0.08 | 0.04 | -.096* | -0.08 | 0.03 | -.119* | -.168** | .813** | .804** | .820** | .852** | .840** | .847** | .886** | .886** | .884** | .958** |
In Table 2, it can be seen that the trend in slack variation differs depending on the period studied. Nevertheless, and independently of the time horizon used, the results show a clear predominance of curvilinear and unspecified trajectories since, as the literature suggests, the use and result of this type of resource is contingent and depends on the circumstances where it is applied (Love & Nohria, 2005).
Table 2. Global Fit Indices for the period 2007-2017
| SAMPLE | SLACK RATIO | MODEL | N | Chi-Sqr | d.f. | Sig. | RMSEA | CFI | TLI | SRMR | |
|---|---|---|---|---|---|---|---|---|---|---|---|
FIRMS WITH SPECIFIC SLACK | CR 2007 | 1 | Linear | 143 | 33.701 | 12 | 0.001 | 0.113 | 0.978 | 0.966 | 0.0227 |
| 2 | Quadratic | 24.983 | 8 | 0.002 | 0.122 | 0.983 | 0.967 | 0.0166 | |||
| 3 | Unspecified | 60.974 | 9 | 0.000 | 0.122 | 0.949 | 0.915 | 0.0164 | |||
| QR 2007 | 4 | Linear | 119 | 33.903 | 12 | 0.001 | 0.124 | 0.961 | 0.951 | 0.0284 | |
| 5 | Quadratic | 5.388 | 8 | 0.715 | 0.000 | 0.999 | 0.999 | 0.0186 | |||
| 6 | Unspecified | 20.068 | 9 | 0.017 | 0.102 | 0.980 | 0.967 | 0.0257 | |||
| D/E 2007 | 7 | Linear | 247 | 7.263 | 12 | 0.840 | 0.000 | 0.999 | 0.999 | 0.0053 | |
| 8 | Quadratic | 5.984 | 8 | 0.649 | 0.000 | 0.999 | 0.999 | 0.0036 | |||
| 9 | Unspecified | 6.791 | 9 | 0.659 | 0.000 | 0.999 | 0.999 | 0.0060 | |||
| PE/I 2007 | 10 | Linear | 198 | 94.819 | 12 | 0.000 | 0.187 | 0.954 | 0.942 | 0.0304 | |
| 11 | Quadratic | 47.810 | 8 | 0.000 | 0.159 | 0.978 | 0.958 | 0.0205 | |||
| 12 | Unspecified | 94.784 | 10 | 0.000 | 0.207 | 0.952 | 0.929 | 0.0283 | |||
| CR 2012 | 13 | Linear | 152 | 23.977 | 12 | 0.020 | 0.081 | 0.989 | 0.986 | 0.0164 | |
| 14 | Quadratic | 12.221 | 8 | 0.142 | 0.059 | 0.996 | 0.993 | 0.0125 | |||
| 15 | Unspecified | 16.161 | 9 | 0.064 | 0.073 | 0.993 | 0.989 | 0.0098 | |||
| QR 2012 | 16 | Linear | 133 | 33.690 | 12 | 0.001 | 0.117 | 0.966 | 0.957 | 0.0546 | |
| 17 | Quadratic | 7.308 | 8 | 0.504 | 0.000 | 0.999 | 0.999 | 0.0187 | |||
| 18 | Unspecified | 7.935 | 9 | 0.541 | 0.000 | 0.999 | 0.999 | 0.0161 | |||
| D/E 2012 | 19 | Linear | 282 | 15.930 | 12 | 0.194 | 0.034 | 0.998 | 0.998 | 0.0069 | |
| 20 | Quadratic | 8.508 | 8 | 0.385 | 0.015 | 0.999 | 0.999 | 0.0060 | |||
| 21 | Unspecified | 7.448 | 9 | 0.591 | 0.000 | 0.999 | 0.999 | 0.0050 | |||
| PE/I 2012 | 22 | Linear | 204 | 24.751 | 12 | 0.016 | 0.072 | 0.994 | 0.993 | 0.0045 | |
| 23 | Quadratic | 20.035 | 8 | 0.010 | 0.086 | 0.995 | 0.990 | 0.0045 | |||
| 24 | Unspecified | 63.838 | 10 | 0.000 | 0.138 | 0.984 | 0.977 | 0.0077 | |||
In addition to the trajectory, it is possible to determine whether these curves reflect the behaviour of the sample, or whether they are just a statistical artefact. Table 3 shows the mean and variance of the intercept and the slope of each of the selected curves. From this data, the random effects can be extracted that reflect the variance of the individual trajectories (by capturing between-firm variability in the intercepts and slopes). In this case, it can be observed that it is mainly the recoverable slack that shows a greater dispersion and variability in its results, and that the other types of slack resources (available and potential) are more uniform since there is little difference across the sample at either time of initial entry or within the sample over time.
In order to ascertain whether the evolution of these companies differs from those which had less or no slack, we created an independent sample and repeated an identical analysis. The results present the trajectories that appear in Table 3. Once more, a clear predominance of curvilinear trajectories can be observed, whose levels of dispersion are again significant in the recoverable slack, with greater homogeneity for the other types of slack resources.
Table 3. Means and Variance for the selected models of firms with firms with slack (2007-2012)
| SAMPLE | SLACK | MODELO | ICEPT Average | SLOPE Average | ICEPT E6 Variance | SLOPE E7 Variance |
|---|---|---|---|---|---|---|
FIRMS WITH SPECIFIC SLACK | CR 2007 | Quadratic | 0.174 | 0.003 / 0.003 | 0.096 | -0.008 |
| QR 2007 | Quadratic | 0.115 | -0.005 / -0.005 | 0.124 | -0.065 | |
| D/E 2007 | Quadratic | 0.082 | -0.002 / -0.002 | 0.034 | -0.007 | |
| PE/I 2007 | Quadratic | 2.300 | -0.051 / -0.051 | -40.042 | -8.012 | |
| CR 2012 | Unspecified | 0.341 | 0.033 | 0.100 | 0.012 | |
| QR 2012 | Unspecified | 0.126 | 0.032 | 0.045 | 0.019 | |
| D/E 2012 | Unspecified | -0.007 | 0.017 | -0.014 | 0.004 | |
| PE/I 2012 | Quadratic | 1.911 | 0.000 / 0.000 | 21.781 | 7.036 |
Tables 4 and 5 represent the estimates for each variable considered for the period 2007-2012 and for the period 2012-2017, respectively. Together with the slack trajectories, the evolution of economic profitability and sales for each of the two samples has also been represented. It can be observed that the differences in the levels of all the types of slack are appreciable; these differences are maintained throughout the periods considered and sometimes the types of slack show similar evolutions, while at other times very different trajectories are observed. Regarding the performance variables, companies with greater slack show higher returns in both periods, but have lower sales levels.
Table 4. Means and Variance for the selected models of firms with firms with no slack (2007-2012)
| SAMPLE | SLACK | MODELO | ICEPT Average | SLOPE Average | ICEPT E6 Variance | SLOPE E7 Variance |
|---|---|---|---|---|---|---|
FIRMS WITH NO SLACK | CR 2007 | Unspecified | -0.030 | 0.029 | -0.024 | -0.001 |
| QR 2007 | Quadratic | 0.020 | 0.001 / 0.001 | -0.003 | -0.001 | |
| D/E 2007 | Quadratic | 0.273 | -0.018 / -0.018 | 0.239 | 0.027 | |
| PE/I 2007 | Quadratic | 0.823 | 0.045 / 0.045 | -3.352 | 5.715 | |
| CR 2012 | Quadratic | 0.066 | -0.004 / -0.004 | -0.343 | 0.015 | |
| QR 2012 | Quadratic | 0.006 | 0.002 / 0.002 | -0.038 | -0.009 | |
| D/E 2012 | Unspecified | 0.245 | -0.047 | 0.150 | -0.003 | |
| PE/I 2012 | Quadratic | 0.159 | 0.029 / 0.029 | -1.935 | 4.094 |
The values in Table 4 indicate that in three of the slack variables analysed, CR, D/E and PE/I, the companies with high and low slack levels follow similar trajectories. This fact is corroborated by the correlation coefficients between the two samples (in all cases r above 0.93 and p<0.05). Consequently, the two groups of companies manage or consume their slack resources in a relatively similar way, logically taking into account the different levels from which they start. In contrast, the indicator of the most available slack, QR, presents different evolutions without correlation between the values of the two samples (r = -0.001), which indicates that the companies with high and low levels of slack make different applications of this resource. Thus, companies with a high level of slack reduce their cash flow suddenly and considerably to face the crisis, but then maintain a fairly large liquidity cushion, in comparison with other companies, to withstand a prolonged period of recession. Companies with low or no slack strive to maintain their QR, with a slight decrease at the beginning of the crisis and a slight increase in the following years. In both cases, companies entering a crisis situation give their utmost to 'protect the cash box' (Arslan et al., 2006), as a means to ensure the survival of the company.
Although the trajectories are similar, those companies with low levels of slack seek to significantly improve their debt position (D/E), and therefore increase their potential slack during the crisis years, since they were already starting from relatively high levels of debt in relation to their equity.
Table 5 also shows that companies with high slack reap the benefit of permanently higher returns than those with low or no slack, which generally confirms the relationship between slack and performance (Carnes et al., 2019). However, low-slack companies enjoy higher sales and more steeply pronounced trajectories of income increase during the crisis period. The higher efficiency that low slack companies have (George, 2005), translates into a greater emphasis on sales strategies than profitability.
Table 5. Estimates of the trajectories in the period 2007-2012
| 2007 | 2008 | 2009 | 2010 | 2011 | 2012 | ||
|---|---|---|---|---|---|---|---|
| PE/I | SLACK | 24.8030 | 26.1200 | 29.1660 | 26.9760 | 27.1420 | 27.6690 |
| NO SLACK | 10.9490 | 11.9460 | 14.3940 | 13.5520 | 13.6170 | 14.0480 | |
| CR | SLACK | 2.19 | 2.38 | 2.51 | 2.41 | 2.60 | 2.57 |
| NO SLACK | 1.175 | 1.267 | 1.387 | 1.414 | 1.47 | 1.503 | |
| D/E | SLACK | 0.97 | 0.82 | 0.75 | 0.77 | 0.76 | 0.74 |
| NO SLACK | 2.587 | 2.251 | 1.929 | 1.839 | 1.727 | 1.594 | |
| QR | SLACK | 0.75 | 0.37 | 0.42 | 0.39 | 0.39 | 0.37 |
| NO SLACK | 0.069 | 0.049 | 0.075 | 0.073 | 0.069 | 0.084 | |
| ROA | SLACK | 10.833 | 9.184 | 7.017 | 7.623 | 6.994 | 5.732 |
| NO SLACK | 5.713 | 3.95 | 1.959 | 4.047 | 3.867 | 3.309 | |
| SALES | SLACK | 60,383.42 | 68,838.77 | 44,632.47 | 49,781.05 | 55,758.69 | 53,614.49 |
| NO SLACK | 120711.86 | 133540.617 | 118262.985 | 160192.075 | 182610.016 | 197282.233 |
Table 6 shows the trajectories of the variables in each of the two samples during the recovery period. In this case, it presents a different evolution. The three variables that followed similar trajectories during the crisis now present different evolutions, with correlations between the two samples that are not significant in all cases (CR, r=-0.788; D/E, r=-0.029; PE/I, r=-0.662). The companies with high and low slack maintain their resource levels throughout the period, with a slight tendency of those firms with low slack to increase their holdings of the three types of slack resources. In contrast, the QR presents very similar trajectories in the two groups of companies (r=0.935, p<0.05), which indicates that all the companies increase their liquidity with remarkable speed in order to protect themselves before the possibility of new recessions arises. Furthermore, if the levels of this variable are observed during and after the crisis, it can be deduced that companies strive to establish a sufficiently large cushion in the wake of a crisis as deep as that experienced in the Great Recession of 2008.
Table 6. Estimates of the trajectories in the period 2012-2017
| YEAR | 2012 | 2013 | 2014 | 1015 | 2016 | 2017 | |
|---|---|---|---|---|---|---|---|
| PE/I | SLACK | 29.8490 | 29.0050 | 28.3330 | 27.8850 | 27.9500 | 27.5680 |
| NO SLACK | 12.6200 | 12.9810 | 13.0980 | 12.8890 | 13.2930 | 12.9890 | |
| CR | SLACK | 3.1820 | 3.1740 | 3.1200 | 3.0530 | 3.0820 | 3.0860 |
| NO SLACK | 1.3960 | 1.4390 | 1.4910 | 1.5580 | 1.7010 | 1.7030 | |
| D/E | SLACK | 0.6730 | 0.6520 | 0.6480 | 0.6550 | 0.6570 | 0.7220 |
| NO SLACK | 2.2640 | 2.0970 | 1.9250 | 1.9510 | 1.8880 | 1.9310 | |
| QR | SLACK | 0.6320 | 0.6440 | 0.6340 | 0.7110 | 0.7560 | 0.7790 |
| NO SLACK | 0.0580 | 0.0740 | 0.1020 | 0.1260 | 0.1710 | 0.1620 | |
| ROA | SLACK | 5.4450 | 5.7960 | 6.8040 | 7.2580 | 7.9330 | 7.4120 |
| NO SLACK | 3.0950 | 2.5140 | 3.9710 | 6.6270 | 6.2000 | 5.8460 | |
| SALES | SLACK | 66651.6360 | 72643.6810 | 70757.5210 | 77591.6230 | 78237.2610 | 77233.5550 |
| NO SLACK | 186792.7960 | 196670.5440 | 161927.3290 | 156550.5710 | 146966.4230 | 155036.7980 |
As in the crisis period, the group with a high level of slack resources enjoys higher returns than those with low or no slack, although the latter experience a significant rise on taking advantage of the economic recovery. Sales in low-slack companies remain higher, but now, unlike in the previous period, they have a downward trend.
4.1. Results Robustness
In any empirical study, and especially in one with an exploratory nature, it is necessary to analyse the consistency of the results obtained in order to verify that they are not simply statistical artefacts or due to selection decisions (Flammer & Ioannou, 2021). Three additional types of analysis were carried out to check this robustness1.
First, the distinction between companies with high and low slack may lead to problems in the selection of the sample since the different samples of companies had different sizes. In order to prevent such potential problems, the upper and lower quartiles of the distribution were selected for each variable to distinguish between companies with high and low slack. Furthermore, in this way, all the samples contained the same number of companies. The results of the growth curves are very similar to those obtained in the baseline specification and the trajectories for the different variables are almost identical. Moreover, different tests were developed to confirm the effect of the different industries considered, observing that the industries considered individually reflect the general behaviour1.
Second, the baseline analysis has been carried out by identifying samples of companies for each type of slack, although it is possible for companies to carry out coordinated management of all their slack resources. To address this issue, a sample was created with those companies with positive and superior slack in each and every one of the ratios considered (40 for the period 2007-2012 and 50 companies for the period 2012-2017). For these small samples, the trajectories of the different types of slack resources were determined with the same procedure. The estimates obtained show a very similar evolution to that observed for the companies with higher slack in the original samples, the only exception being that of the CR in the 2012-2017 period, which failed to present a high correlation.
Table 7. Correlation between general sample and firms with slack in every year.
| 2007-2012 | 2012-2017 | |
|---|---|---|
| PE/I | 0.907 p<0.01 | 0.990 p<0.01 |
| CR | 0.971 p<0.01 | 0.532 |
| QR | 0.992 p<0.01 | 0.872 p<0.05 |
| D/E | 0.954 p<0.01 | 0.979 p<0.01 |
Third, and finally, the results could be affected by the time periods selected. To explore this possibility, the crisis period was extended to include the initial year of recovery (2007-2014) and the recovery period was started one year after the base model (2013-2017). The results are almost identical, despite the difference of the initial levels of the different variables, and confirm the trajectories of the slack resources that have been analysed.
5. Conclusions
Following the many authors that have proposed the importance of analysing the consumption or application of slack resources (Love & Nohria, 2005; Singh, 1986; Tan, 2003; Tan & Peng, 2003; Wiseman & Bromiley, 1996), this article explores the way in which companies use their slack resources in a situation of generalised crisis, specifically the reaction to the global financial crisis of 2008. Despite the extensive literature on slack resources, this is an issue rarely addressed in the literature (Latham et al., 2008; Latham & Braun, 2009; Namiki et al., 2015; Wiersma, 2017).
In order to perform this analysis, a distinction was made between the different types of slack (available, recoverable, and potential), since it was estimated that the company's behaviour with respect to each of these types would be different (Alessandri et al., 2014). At first, in the face of a deep economic recession, the initial action undertaken by firms should be aimed at using the available slack, since it constitutes an element of buffering against an unexpectedly hostile environment (Deb et al., 2017; Kim & Bettis, 2014). However, the use that companies make of this slack resource is very different depending on whether it is measured through the CR or the QR, which constitute the two most commonly employed indicators to determine this type of slack.
In a situation of generalised downturn, the most available slack, represented by QR, is of crucial importance. Companies with high slack reduce QR drastically to cope with the first shock caused by the crisis, and subsequently keep it at stable levels in order to 'protect the cash box' to ensure the manoeuvrability and capacity of the company during the crisis period (Mishina et al., 2004; Deb et al., 2017; Kim & Bettis, 2014). These behaviours confirm the existence of a minimum or survival level of the most available slack (Campello et al., 2011), although this level will differ according to the efficiency orientation of the firm (Deb et al., 2017; Kim & Bettis, 2014).
The other types of slack, in contrast, present no buffering function against the initial jolt, since their levels do not diminish during the crisis period. Indeed, a slight increase in these resources can be observed instead. The management of the CR is particularly paradoxical since, as a type of available slack, a reduction of this indicator could be expected in the first moments of the crisis and a recovery with the change of cycle. However, as soon as the crisis begins, the CR presents an increase, not due to the company's actions but from an accumulation of stocks and credits to customers, including unpaid accounts, due to the effect of the economic crisis on sales. In short, the available slack resources do not present the same level of availability, and special attention should be paid to the consideration of cash as a strategic asset (Deb et al., 2017; Kim & Bettis, 2014). This underlines the importance of the interpretation of the variables chosen for the analysis and possibly of the interpretation of the discrepancy between some of the results obtained in the past literature (Daniel et al., 2004).
Regarding potential slack, certain authors have pointed out the need to consider the joint level of financial flexibility (Arslan-Ayaydin et al., 2014), availability, and leverage of the firm, in order to understand the success of firms in crisis situations. In our case, companies increase their potential slack during the crisis by improving (reducing) their leverage ratio (D/E), with greater intensity in those companies with lower levels of slack, which are, therefore, relatively more indebted. This trend responds both to a desire by the company to have a margin of indebtedness in case of greater financial difficulties, and above all to the difficulty or impossibility of accessing external sources of financing (Campello et al., 2011).
With regard to recoverable slack, as noted in previous studies (Carnes et al., 2019), this type of absorbed resource is not easy to recover in times of crisis, since the cost of reducing it can offset the benefits generated (Lecuona & Reitzig, 2014). However, at a time of economic recession, with a general and sometimes overall decline in companies' sales, the maintenance of the PE/I ratio reflects the fact that companies have reduced their personnel expenses at the same rate as the decline in sales. Nevertheless, from a slack resource perspective, those companies with high levels of slack resources have been unable to 'recover' them to increase their efficiency and improve their situation against the crisis. However, the estimation of this variable presents a wide variability in the samples used, which reflects the relatively disparate behaviour of companies in this type of slack.
All in all, the study shows that, faced with a deep, generalised crisis, companies with high levels of slack immediately rely on the most available slack to deal with the first shock of the impact, and maintain or slightly increase the levels of the other types of slack during the crisis period. This can be interpreted either as a means of protection against a possible deepening of the crisis, as occurs with potential slack, or as a consequence of the deterioration of sales, as is the case of the available slack measured by the CR. During the period of recovery, companies with a high level of slack resources maintain their resource levels, while companies with a low level of slack resources tend to increase these levels. Thus, after a period of deep economic recession, all companies place special emphasis on increasing their financial availability during the recovery phase, showing higher levels of cash than that shown in the pre-crisis period.
This study makes a number of theoretical and practical contributions. First, from an academic point of view, the paper provides an orientation towards answering how slack resources are consumed or applied (Paeleman & Vanacker, 2015). The results also show that the commonly used measures in the literature should be used with caution when analysing the function of slack resources, since not every type of slack resource is used as a cushion against an external or internal shock (Bourgeois, 1981), and each type plays its own role in the company. Second, through a fact-based approach, and by focusing our study on documenting the impact of the complex phenomenon of the 2008 economic downturn on firm-level decision-making, we strive to answer the call by Agarwal et al. (2009) for studies on these rare phenomena that contribute towards the better understanding of their effects. Third, the study is longitudinal and uses a dynamic approach not previously employed in the analysis of slack resources, and therefore contributes to the analysis of the consumption or application that companies make of these resources: an issue scarcely addressed in the literature. From a practical point of view, the results show how industrial companies use their slack resources when faced with a generalised crisis in accordance with the level of slack they possess, and how they manage these resources once the recovery process begins: this can serve as guidance or direction for other companies that are faced with a similar situation. It should be considered that all the companies analysed have survived the crisis period and have continued to operate in the recovery period.
This study is not without limitations. Although the methodology reflects changes with much more precision than most of the studies carried out to date, only a few slack indicators have been used, and shows that slack resources associated with the same type can present radically different behaviour. Therefore, it is necessary to introduce new measures to verify the results obtained. Additionally, a finer analysis of accounting policies, such as the possible effect of arbitrary accounting of accruals (McNichols & Stubben, 2018) on performance could affect the cash flow or earnings reflected by firms (Yang, 2019). However, although the results confirm that companies with higher levels of slack present higher profitability, the causality of the relationships has yet to be addressed, which would require a study of a totally different nature. Finally, the analysis has been carried out on Spanish industrial companies, and any generalization of the results obtained could be questioned; however, the economic crisis of 2008 affected almost all countries worldwide and the studies that have been carried out on other countries and contexts have shown similar results (Namiki et al., 2015, 2016; Campello et al., 2011).