What Determines Intragroup Debt Financing? Spanish Evidence
ABSTRACT
In this paper, we examine the determinants of internal or intragroup debt financing and its relationship with other debt funding alternatives, especially external debt. We perform a panel data analysis with a sample of 787 non-financial Spanish companies actively financing their operations with intragroup debt during the six-year period between 2013 and 2018. Our results show that intragroup debt positively depends on size and asset’s tangibility, but it is negatively related to profitability, age, and growth. We also find that greater intragroup debt funding substitutes a reduction in external debt of as much as a quarter. Furthermore, we identify a hierarchy of preferences in the selection of different financing pathways, with intragroup debt much supporting the pecking order theory than external debt.
Keywords: Business groups; Capital structure; Internal capital markets; Intragroup debt financing; Pecking order theory.
JEL classification: G32; C33.
¿Qué determina la financiación mediante deuda intragrupo? Evidencia en España
RESUMEN
En este trabajo, examinamos los determinantes de la financiación mediante deuda intragrupo y su relación con otras alternativas de financiación, especialmente la deuda externa. Realizamos un análisis de datos de panel con una muestra de 787 empresas no financieras españolas, que financian sus operaciones de manera recurrente mediante deuda intragrupo durante el periodo que abarca entre 2013 y 2018. Nuestros resultados muestran como la deuda intragrupo depende positivamente del tamaño y la tangibilidad de los activos, mientras que la rentabilidad, la edad y el crecimiento mantienen una relación negativa. También observamos como tener una mayor financiación mediante deuda intragrupo supone reducir hasta en una cuarta parte la financiación con deuda externa. Además, identificamos la existencia de una jerarquía de preferencias en la selección de distintas fuentes de financiación, donde la deuda intragrupo cumple mejor con la teoría de la jerarquía de preferencias que la deuda externa.
Palabras clave: Grupos empresariales; Estructura de capital; Mercados internos de capitales; Financiación de la deuda intragrupo; Teoría del pecking order.
Códigos JEL: G32; C33.
1. Introduction
How firms make their capital structure decisions continues to be one of the most extensively studied areas in corporate finance. A large part of that research treats debt as uniform, without considering its heterogeneity. Nevertheless, several studies, such as those by Johnson (1997), Denis & Mihov (2003), Rauh & Sufi (2010), and Colla et al. (2013), have highlighted that debt structure is a first-order issue of a firm’s capital structure. Moreover, traditional determinants of capital structure show heterogeneous cross–sectional correlations with different types of debt.
The empirical capital structure literature has proved that market imperfections such as taxes, costs of financial distress, agency conflicts, and asymmetric information, among others, not only affect corporate indebtedness but also the characteristics of the debt (Barclay & Smith, 1995a and 1995b; Johnson, 1998). A limitation of capital structure theories is that they consider firms with direct access to well-developed financial markets as units of study, while the opposite might in fact be the case.
In response to this drawback, a growing field of capital structure literature has focused on business groups and internal capital markets, with their corresponding implications for companies’ financing.1 Spanish firms are an interesting case for research on this topic, as they are seldom listed in the stock exchange and corporate debt markets are still far from being a prevalent financing option. Indeed, most firms in Spain secure financing through internal resources, internal capital markets and private debt, which is almost exclusively bank debt.
In this vein, De Andrés et al. (2018) conducted a survey of Spanish CFOs, revealing the relevant role played by intragroup financing in Spanish companies. In their sample of non–financial Spanish companies, total debt accounted for 46% of assets, and of this debt, 48% was bank debt and 23% came from other group–affiliated companies (intragroup debt). Moreover, intragroup debt was the third most preferred source of financing, after retained earnings and bank loans.
The main purpose of this paper is to explore intragroup debt financing and its potential determinants in a sample of Spanish non–financial companies in the period 2013–2018. To the best of our knowledge, there have been no empirical studies to date that analyse the factors influencing intragroup debt policy in Spain.
Our study makes several important contributions to the corporate finance literature. First, it offers new empirical evidence on the question of what determines companies’ capital structure. It contributes to the research debate on internal capital markets by studying intragroup debt financing determinants. In this respect, our motivation is different from that of most of the empirical studies on business groups’ internal capital markets, which predominantly focus on the general indebtedness of group firms. Second, our paper also contributes to the literature on debt structure; as Colla et al. (2013) suggest, one avenue for empirical research in corporate finance could be to examine the underlying economic factors explaining the cross–sectional heterogeneity in different types of debt financing, and in our case, intragroup debt. Finally, our analysis concerns Spanish firms’ capital structure; the institutional setting in Spain makes it an interesting case to study because firms are characterized by a relatively higher concentration of ownership with banks playing an important role as financial creditors. Therefore, our research is of interest for firms in most countries outside the market–oriented British-American financial system.
Under a well-specified capital structure model, we carry out a panel data Tobit regression analysis. The resulting empirical evidence suggests that profitability, size, tangibility, age, and growth all seem to play an important role in determining intragroup debt financing. Specifically, we find intragroup debt financing to be significantly negatively related to profitability, age and growth. On the contrary, size and tangibility are significantly positively related with intragroup leverage. Furthermore, there is a substitution effect between intragroup debt and external debt. Finally, our evidence supports the pecking order hypothesis regarding intragroup debt financing, suggesting that this type of debt is less affected by information asymmetries.
The rest of the paper is organized as follows. Section 2 reviews previous literature on intragroup financing, while Section 3 presents the rationale for and the formulation of the hypotheses to be tested. The empirical strategy, including the capital structure model employed as well as the econometric issues, are explained in Section 4. In Section 5, we describe our sample and provide a descriptive analysis. The empirical results are discussed in Section 6, while Section 7 includes several robustness tests. Finally, Section 8 concludes.
2. Review of the literature on internal capital markets and business groups
An interesting and fast-growing field of research in corporate finance deals with internal capital markets. There are three main areas of focus in this branch of the literature, namely,
Conglomerates or multi–segment firms, where external financing is often assumed to be raised by headquarters and passed through to divisions (Gertner et al., 1994; Stein, 1997). In this area, the most extensively analysed systems have been U.S. conglomerates (see Stein, 2003, for a survey), and Japanese Keiretsus (Hoshi et al., 1990; Gul, 1999), where the presence of group banks makes the capital structure policy unique.
Multinational corporations, operating in countries with differences in tax rates and/or with shallow credit markets, might replace some of the internal debt with external debt. In fact, affiliates borrow less from external sources and more from their multinational parents in countries with weak creditor rights and where credit markets are poorly developed, with greater parent lending offsetting approximately three–quarters of the reduction in external borrowing (Desai et al., 2004). This could offer such firms a significant advantage over local companies, which have no access to this sort of financing.
Business groups, which constitute a group of legally independent firms under common ownership, each one with its own ownership and capital structure (Khanna & Yafeh, 2007; Masulis et al., 2011). Firms in business groups can be separately listed in the stock exchange and issue debt independently. In the Spanish setting, and according to Article 42.1 of the Spanish Commercial Code, the business group definition is based on the concept of “control”: there is a group when one company has control of another or others. Such control is presumed when the dominant company holds, directly or indirectly, the majority of the voting rights of the dominated company or has the direct or indirect capacity to appoint the majority of the members of its management board. The former criterion has been incorporated in the Spanish General Accounting Plan in Standard 13, which establishes that “for the purposes of presentation of a company’s annual accounts, another company shall be considered to form part of the group when there is a relationship of direct or indirect control between the two companies similar to that foreseen in Article 42 of the Commercial Code for groups of companies, or when the companies are controlled by any means, by one or more individuals or legal entities in conjunction or which are solely managed in accordance with statutory clauses or agreements”.
Our work is related to the last of these; that is, business groups. They are widespread around the world and typically have significant operational and financial interlinkages. Prior literature on the internal capital markets of business groups illustrates the general debate about business groups, which have a mixed reputation (Khanna & Yafeh, 2007; Buchuk et al., 2020). On the one hand, some researchers claim that transfers of resources between affiliated firms within a group are a sign of tunnelling or self–dealing, referring to the agency problem where minority investors are expropriated by controlling shareholders (Bertrand et al., 2002; Jiang et al., 2010). On the other hand, others argue that such transfers can lessen financial constraints (Gopalan et al., 2007; Buchuk et al., 2014; Almeida et al., 2015; Santioni et al., 2020).
As Buchuk et al. (2014) point out, although there is a vast literature on business groups, this is not the case for intragroup lending. That said, there are several papers on this sort of financing that are worth mentioning.
Focusing on Belgian private domestic business groups, Verschueren & Deloof (2006), and Dewaelheyns & Van Hulle (2010, 2012) find evidence of the financial advantages of intragroup loans regarding the internal debt cost in comparison to the external debt cost. Besides, internal debt financing gives the borrower more financial flexibility, for example, in terms of the maturity period. This flexibility can foster capital structure adjustments; Dewaelheyns & Van Hulle (2012) argue that business groups’ affiliates might face relatively low adjustment costs to attain target leverage, due to their better access to capital markets, along with the beneficial reputation effects of belonging to a group. Furthermore, new high-risk investments can be undertaken due to the absence of asymmetric information. In conclusion, internal debt can be considered as a substitute for external debt (Verschueren & Deloof, 2006).
In the Chilean market, Buchuk et al. (2014) report evidence on intragroup lending that is consistent with the financing advantage hypothesis, but less so with tunnelling. As a result, business groups allow their companies to increase their indebtedness beyond what would be considered acceptable by financial markets. Besides, firms that are receivers of intragroup loans have lower external leverage than other firms, while those that are providers of intragroup loans have higher external leverage. More recently, Buchuk et al. (2020) focus on the intermediation of credit during distress as another advantage of the ownership structures of business groups and study the response of Chilean business groups to the recession of 2008-2009. Using a unique dataset of intragroup loans in Chile, Buchuk et al. (2020) conclude that internal credit relationships are permeated by strong control rights, which ease financial contracting in periods of distress.
Jiang et al. (2010) state that the controlling shareholders of Chinese groups mostly use intragroup loans for tunnelling significant amounts of profits at the expense of minority shareholders. In contrast, Gopalan et al. (2007) argue that intragroup loans in India are motivated by the financing advantage, as these loans reduce the likelihood of bankruptcy in affiliated firms; furthermore, they find that intragroup capital transfers help affiliated firms facing low cash flow.
Italian business groups have been studied by Schiantarelli & Sembenelli (2000), Bianco & Nicodano (2006), and Santioni et al. (2020). They all support the idea that being a group member is likely to confer an advantage in accessing external finance; nonetheless, Bianco & Nicodano (2006) find that in Italian business groups, subsidiaries use less external debt than the group holding company. On the other hand, Santioni et al. (2020) consider how the value of the internal capital market responds to shocks, such as the global financial and sovereign debt crises, to the external providers of capital. Moreover, Santioni et al. (2020) suggest that, in times of crisis or distress, belonging to a group could have many benefits, including avoiding negative spillover to the rest of the group, or obtaining better conditions from creditors due to the good reputation of the group.
Lee et al. (2009), Almeida et al. (2011), and Almeida et al. (2015) study Korean groups or Chaebols and their specific characteristics, along with the unique behaviour of their internal capital markets. Specifically, Almeida et al. (2015) analyse how Korean Chaebol-related firms use cross-firm equity investment to transfer funds to firms with better investment opportunities and show that this helped to mitigate the fall in affiliated firms’ investment in the aftermath of the 1997 Asian financial crisis.
Lastly, Masulis et al. (2011) carry out a cross–country study and suggest that the financing advantage of family business groups outweighs tunnelling problems. When comparing the firm characteristics of group and non–group firms, they find that despite having higher idiosyncratic risk, group firms are larger, more established, and use more leverage, reflecting their financing advantages.
3. Rationale and formulation of hypotheses
According to Dewaelheyns & Van Hulle (2010) and Santioni et al. (2020), the internal versus external financing decision is likely to be a complex, group-wide trade–off between the benefits and costs of internal and external financing. In this section, we describe the specific hypotheses that we test using the data from our sample of companies.
3.1. Intragroup debt and companies’ characteristics
Capital structure determinants have been extensively examined by previous empirical literature (see among others, Frank & Goyal, 2009, and Öztekin, 2015). Overall, those determinants usually correspond to different companies’ specifics, and leverage ratios include debt as though it were a single form of funds. Another strand of the corporate finance literature has analysed the heterogeneity of debt ownership structures (Johnson, 1997; López Iturriaga, 2005; Ojah & Manrique, 2005; Rauh & Sufi, 2010), and has highlighted the necessity of analysing separately the determinants of different types of debt. Finally, the internal capital markets and business groups literature discussed in Section 2 has attempted to find explanations for the use of intragroup debt financing by firms. Based on all this previous research, we formulate several testable hypotheses on the determinants of intragroup debt financing.
The more cash flows a business generates, the less it needs to resort to debt, either internal or external. Ghatak & Kali’s (2001) model suggests that business groups that are financially interlinked through cross–shareholding and cross–guarantee of loans can be viewed to obviate credit rationing caused by asymmetric information. Gopalan et al. (2007) propose a group support motive for the transfer of resources across group firms; thus, groups provide more loans to financially weaker firms, which have lower profitability. In this sense, internal financing might fill cash flow shortages caused by low profitability.
Over time, companies can save funds and therefore avoid resorting to other financing. Frank & Goyal (2009) and Dewaelheyns & Van Hulle (2010) suggest that age is often associated with the likelihood of generating more internal resources because of the time effect. As a result, firms may be able to reduce their financing needs. Thus, younger firms cannot retain earnings as easily as older firms can, giving rise to a negative relationship between age and intragroup debt.
Firms with high growth opportunities are more likely to exhaust internal resources and therefore need to resort to other sources of financing. Due to its higher capacity to reduce asymmetric information problems between lenders and borrowers, internal debt could be chosen to finance growth needs (Hoshi et al., 1990; Dewaelheyns & Van Hulle, 2010).
This argument suggests that companies in business groups with growth opportunities tend to use the internal capital market for their financial needs.
Previous empirical research, such as the study by Dewaelheyns & Van Hulle (2010), does not provide a prediction on the relationship between internal debt and size, and internal debt and tangibility. Notwithstanding, a direct and positive relationship is expected in both cases, in line with the relationships found in general capital structure studies. This is because the size of a company and the percentage of tangible assets that it has are both related to the business risk and the potential costs of financial distress (Frank & Goyal, 2009, and Öztekin, 2015).
To sum up, we formulate the following hypotheses:
H1: Intragroup debt financing is negatively related to firms’ profitability and age.
H2: Intragroup debt financing is positively related to firm size, tangibility, and growth.
3.2. Substitutability of intragroup debt and external debt
Intragroup borrowing might have financial advantages over alternative sources of financing. It may even be the only option if capital market frictions, such as asymmetric information and agency problems, mean companies only have access to very expensive financing, or have no access at all.
A clear advantage of intragroup or internal debt when compared to other external sources of funds is that the former is very flexible and easier to renegotiate than the latter, especially in the event of financial distress. We have to bear in mind that the owner or shareholder is an interested party at both ends of the lending relationship (Buchuk et al., 2014). Another advantage of internal debt stems from the fact that it can be categorized as owner–provided, which leads to a more efficient allocation of resources and reduced monitoring costs (Gertner et al., 1994; Stein, 1997). Moreover, as suggested by Lin et al. (2011), intragroup debt prevents excessive reliance on outside investors, especially banks, who could monitor shareholders. Accordingly, by borrowing with intragroup debt, a group member firm in need of external funds can avoid agency costs associated with external bank loans (Gertner et al., 1994).
A direct implication of the financing advantages of intragroup debt is the idea that companies taking on intragroup loans are likely to be overleveraged compared to their stand–alone counterparts; in addition, intragroup loans can crowd out external debt such as bank debt, bonds, commercial paper, trade credit or others (Buchuk et al., 2014). As Dewaelheyns & Van Hulle (2012) point out, the total leverage of group companies includes both internal and external debt, and thus these companies must decide not only on their total level of leverage, but also on the relative weight of internal and external debt. In this vein, Desai et al. (2004) find that foreign affiliates of US-based multinational corporations use parent-provided debt as a substitute for external debt, with a special prevalence in countries where access to external financing is limited or expensive. Similarly, Santioni et al. (2020) provide direct evidence of the substitution towards internal capital markets, showing that Italian firms belonging to a group use internal capital transfers more when the health of their own banks deteriorates. All the foregoing highlights the importance of internal sources of funds combined with an active internal capital market as a substitute for banking and external finance.
The above rationale gives rise to the following hypothesis:
H3: There is a substitution effect between intragroup debt financing and external debt financing.
3.3. Intragroup debt and pecking order
Brought to prominence by Myers (1984) and Myers & Majluf (1984), the pecking order theory predicts that firms’ choice of the source of financing is influenced by external financing transaction costs and costs arising from asymmetric information between managers and investors. The defining prediction of the theory is that firms will not have an optimal capital structure but will instead follow a pecking order: retained earnings are preferred over different debt types (ranging from the safest to the riskiest) with equity finance as a last choice.
Internal funds do not bear any transaction costs, while the total transaction costs of new debt are typically lower than the total costs of obtaining other new external financing such as equity capital (Shyam-Sunder & Myers, 1999; Frank & Goyal, 2003). Due to the financial advantages of intragroup or internal debt over external debt, the associated transaction costs are likely to be lower with the former than with the latter. On the other hand, intragroup lending will generate more monitoring than external (bank) lending, and there will be a better flow of information between users and providers of capital (Verschueren & Deloof, 2006). Dewaelheyns & Van Hulle (2010) report evidence consistent with a pecking order of internal debt over external (bank) debt in Belgian private domestic groups.
Furthermore, under the asymmetric information argument for the pecking order theory, the firm should issue the safest possible securities, i.e., those whose future value changes least when the managers’ inside information is revealed to the market. Accordingly, the hierarchy of financing choices is based on volatility value, with retained earnings being the least volatile source, followed by intragroup debt, and then external debt.
The above arguments lead us to propose the following hypothesis:
H4: Companies resorting to intragroup debt financing follow more closely the pecking order theory than when relying on external debt financing.
4. Empirical strategy
In this section, we describe our empirical approach to test the hypotheses developed in Section 3. Specifically, we regress intragroup debt financing on several explanatory variables that correspond to the proposed hypotheses H1 and H2. Our capital structure regression model is given by Equation (1),
\[\begin{equation} \label{eq1} \small \begin{split} \text{IGDEBT}_{it} =& \beta_{0} + \beta_{1}\text{PROF}_{it-1} + \beta_{2}\text{SIZE}_{it-1} + \beta_{3}\text{TANG}_{it-1}\\ & + \beta_{4}\text{AGE}_{it-1} + \beta_{5}\text{GROWTH}_{it-1} + \varepsilon_{it} \end{split} \ \ \ \ \ (1) \end{equation}\]where \(\varepsilon_{it}\) is the error term, and the computation of the variables is explained below.
As far as the dependent variable is concerned, we have focused on the intragroup debt ratio.
- Intragroup Debt Financing (IGDEBT): the sum of intragroup debt scaled by total assets.
As the dependent variable, IGDEBT, is measured as a ratio with values censored at the top and bottom (one and zero, respectively), we use a panel data Tobit estimation approach. On the other hand, we also consider total debt (TOTALDEBT) and external debt (EXTDEBT) ratios for comparison purposes in the regression analysis.
The explanatory variables are defined as follows,
Profitability (PROF): the ratio of earnings before interest, taxes, depreciation and amortization to total assets.
Size (SIZE): we use the natural logarithm of total assets as a proxy for firm size. The log transformation allows us to control for possible non-linearity in the data and the related problem of heteroscedasticity.
Tangibility (TANG): we use the ratio of plant, property and equipment to total assets to proxy for tangible assets.
Age (AGE): it is calculated as the natural logarithm of the number of years since the company’s incorporation. As we expect that a one-year difference in age is more important to the financing of a young firm than to that of an older firm, we use the log transformation.
Growth (GROWTH): it is measured as the annual change in the natural logarithm of total assets.
Table A1 in the Appendix provides a summary of the definitions of all the variables, and the expected signs of the effects of the explanatory variables on the intragroup debt financing, respectively.
The extent to which companies substitute intragroup debt for external debt (i.e., H3) can be measured directly. To test this hypothesis, we use the capital structure regression model of Equation (1), and add a new independent variable, which is external debt (EXTDEBT). The estimated beta coefficient of the said explanatory variable will measure the degree of substitution between these two types of debt financing.
Regarding the hypothesis that there is a pecking order in the companies’ financing policy (H4), we develop a pecking order model based on Shyam-Sunder & Myers (1999), and Frank & Goyal (2003):
\[\begin{equation} \label{eq2} \small \Delta \text{DEBT}_{it} = \beta_{0} + \beta_{1} \text{FD}_{it} + \varepsilon_{it}, \ \ \ \ \ (2) \end{equation}\]where \(\Delta \text{DEBT}_{it}\) is equal to the change in debt outstanding for firm i from time t-1 to t; specifically, we refer to intragroup debt (IGDEBT), total debt (TOTALDEBT) and external debt (EXTDEBT), thus carrying out three different regression estimations. Conversely, the financing deficit of a firm i for period t, FDit, is defined by the following difference:
\[\begin{equation*} \label{eq2_2} \small \text{FD} = [ \text{CAPEX} + \text{DIV} + \Delta \text{WC} + \Delta \text{CASH} ] - \text{CF}, \end{equation*}\]where \(\Delta\) represents the first difference, CAPEX equals capital expenditures, DIV is dividend payments, WC is working capital, CASH includes cash holdings, and CF accounts for earnings after taxes plus depreciation. Note that Equation (2) is not an accounting identity because the financing deficit does not include equity issues and/or repurchases (Shyam-Sunder & Myers, 1999). All dependent and explanatory variables are scaled by beginning-of-year total assets (i.e., total assets at t-1).
The regression model of Equation (2) could be estimated with the financing deficit in aggregate or in disaggregate form. On the one hand, in the aggregate version of the pecking order model, greater proximity of the \(\beta_{1}\) coefficient to unity would indicate how companies cover their debt financing shortfall. On the other hand, the preference hierarchy can be confirmed through a disaggregated regression with all those variables that make up the financing deficit. In order to do this, we carry out a regression with all those explanatory variables used for the financial deficit calculation. We expect a positive relationship with all those variables that entail funding needs. Conversely, a negative relationship is expected with the cash flow variable, which refers to the resources generated by companies. Lastly, the comparison between the estimated beta parameters of the intragroup debt versus the external debt financing will determine whether there is a hierarchy of preferences in the selection of the different financing pathways; the coefficients corresponding to the former way of financing are expected to be higher than those associated with the latter.
Lemmon & Zender (2010) point towards the debt capacity factor as an important limitation for issuing new debt. In this vein, firms with depleted debt capacity could not take on new debt, and the remaining option would be the issue of new equity. If this were the case, it would not be possible to reject the pecking order hypothesis. Thus, companies resorting to issuing new shares to address their financing deficit would not necessarily imply that the theory of the hierarchy of preferences should be rejected. This choice may be motivated by the fact that companies have exhausted their borrowing capacity. Faced with the need for new resources, and as a result of having previously consumed all other financing modes, companies resort to the last of the options in the hierarchical order. Accordingly, Lemmon & Zender (2010) propose including the square of the financing deficit as an additional independent variable. This leads us to extend the pecking order model of Equation (2) as follows,
\[\begin{equation} \label{eq3} \small \Delta \text{DEBT}_{it} = \beta_{0} + \beta_{1} \text{FD}_{it} + \beta_{1} \text{FD}_{it}^{2} + \varepsilon_{it} \ \ \ \ \ (3) \end{equation}\]As in Equation (2), \(\Delta \text{DEBT}_{it}\) is equal to the change in debt outstanding for firm i from time t-1 to t; specifically, we refer to intragroup debt (IGDEBT), total debt (TOTALDEBT) and external debt (EXTDEBT), thus carrying out three different regression estimations. Table A1 in the Appendix provides a summary of the definitions of all the variables, and the expected signs of the explanatory variables included in the pecking order models.
5. Data and descriptive analysis
The data used in this research come from Sistema de Análisis de Balances Ibéricos (SABI), a database managed by Bureau Van Dijk and Informa D&B, S.A. The selection is limited to Spanish firms that file complete annual accounts, thus providing data on internal debt financing.2 The sample is built from all the companies for which positive data in accounting subgroup 16 “Non-current payables to related parties” and subgroup 51 “Current payables to related parties”3 are available for each year of the sample period. By establishing this criterion, we ensure that the selected firms received intragroup debt financing during the timeframe under study. The construction of the sample includes as many years in a row as possible from SABI database, until we reach the largest number of companies complying the abovementioned criteria, which results in the 2013-2018 period.
The final sample obtained consists of 787 companies. As is standard in the empirical literature, we disregard financial institutions and governmental enterprises because these firms have very different capital structures, and their financing decisions may not convey the same information as for non-financial and non-regulated companies. Additionally, we exclude any firms that are not organized as limited liability companies, recorded negative equity, or have zero sales. The companies range from small (10% of the sample firms have sales of less than €5 million) to very large (7% have sales of at least €500 million), with most of the sample firms (55%) being in the €5 – €50 million range. Conversely, most of the companies are private (98%), and only the remaining 2% are listed on the stock exchange.
The companies in our sample represent all major non-financial industries, and as Table 1 shows, they are concentrated in the manufacturing (23%), wholesale and retail trade (16%), and professional, scientific, health, administrative and support service activities (17%) sectors.
Table 1. Industry Composition
| Sectors | Firms | % | |
|---|---|---|---|
| Sector 1 | Agriculture, forestry, fishing, mining, and energy | 108 | 13.72 |
| Sector 2 | Manufacturing | 184 | 23.38 |
| Sector 3 | Construction and real estate activities | 89 | 11.31 |
| Sector 4 | Wholesale and retail trade | 125 | 15.88 |
| Sector 5 | Transportation and storage | 65 | 8.26 |
| Sector 6 | Information and communication | 29 | 3.68 |
| Sector 7 | Professional, scientific, health, administrative and support service activities | 132 | 16.77 |
| Sector 8 | Others | 55 | 6.99 |
| TOTAL | 787 | 100.00 |
Figure 1 depicts the evolution of leverage ratios over time for two different categories of debt, namely, intragroup debt and external debt. Specifically, intragroup debt is the sum of total intragroup debt scaled by total assets (IGDEBT), while external debt is the sum of total external financial debt (including bank debt, bonds, and other marketable securities) scaled by total assets (EXTDEBT). Total debt scaled by total assets (TOTALDEBT) is also illustrated in Figure 1.
Figure 1. Evolution of Leverage Ratios Over Time

Interestingly, the leverage ratio based on intragroup debt remains consistently above that based on external debt, by roughly 9 percentage points throughout the entire period. Figure A1 in the Appendix includes three panels, corresponding to the evolution of intragroup, total, and external sector debt ratios, respectively, throughout the period under study. On the one hand, Sector 1 (i.e., Agriculture, forestry, fishing, mining, and energy) shows the highest leverage in terms of total indebtedness and intragroup debt for most of the period. On the other hand, Sector 4 (i.e., Wholesale and retail trade) stands out as the sector with the lowest level of total debt and intragroup indebtedness over the period. As far as external debt is concerned, the largest proportion of external indebtedness corresponds to Sector 3 (i.e., Construction and real estate activities), whereas Sector 6 (i.e., Information and communication) registers the smallest proportion in most of our sample period.
Table 2 presents summary statistics of the dependent and explanatory variables across companies and time, included in the capital structure regression model of Equation (1). All variables are winsorized at the upper and lower 0.5th percentiles to mitigate the effect of outliers and data error.
Table 2. Descriptive Statistics* (Capital Structure Model)
| Variable | Mean | Median | St. Dev. | Min. | Max. | P25 | P75 |
|---|---|---|---|---|---|---|---|
| IGDEBT | 0.273 | 0.220 | 0.214 | 0.017 | 0.732 | 0.088 | 0.425 |
| TOTALDEBT | 0.464 | 0.452 | 0.232 | 0.087 | 0.886 | 0.279 | 0.641 |
| EXTDEBT | 0.182 | 0.096 | 0.207 | 0.000 | 0.687 | 0.009 | 0.304 |
| PROF | 0.077 | 0.070 | 0.064 | -0.027 | 0.223 | 0.027 | 0.113 |
| SIZE | 11.083 | 11.020 | 1.634 | 8.281 | 14.223 | 9.837 | 12.191 |
| TANG | 0.276 | 0.169 | 0.281 | 0.001 | 0.862 | 0.034 | 0.463 |
| AGE | 3.017 | 3.050 | 0.652 | 1.688 | 4.128 | 2.534 | 3.466 |
| GROWTH | 0.010 | 0.002 | 0.052 | -0.087 | 0.135 | -0.023 | 0.034 |
*Table A1 in the Appendix provides definitions of all the variables.
The average intragroup debt to total assets ratio is 27%, with a minimum value of 2% and a maximum value of 73%, while total debt and external debt to total assets ratios record average values of 46% and 18%, respectively.
We calculate the correlation matrix for all the variables. Additionally, we perform a multicollinearity test using the variance inflation factor (VIF). Results are shown in Table 3. As reported, the correlation coefficients are well below 0.60 and the low VIF values are not indicative of multicollinearity problems among the variables considered.
Table 3. Correlation Matrix and Variance Inflation Factors* (Capital Structure Model)
| TOTALDEBT | EXTDEBT | PROF | SIZE | TANG | AGE | GROWTH | |
|---|---|---|---|---|---|---|---|
| IGDEBT | 0.545 (0.000) | -0.434 (0.000) | -0.035 (0.015) | 0.102 (0.000) | 0.094 (0.000) | -0.187 (0.000) | -0.009 (0.532) |
| TOTALDEBT | 0.511 (0.000) | -0.084 (0.000) | 0.071 (0.000) | 0.196 (0.000) | -0.272 (0.000) | -0.026 (0.078) | |
| EXTDEBT | -0.057 (0.000) | -0.039 (0.008) | 0.117 (0.000) | -0.092 (0.000) | -0.018 (0.221) | ||
| PROF | 0.001 (0.979) | 0.348 (0.000) | -0.114 (0.000) | 0.080 (0.000) | |||
| SIZE | -0.005 (0.730) | 0.085 (0.000) | -0.074 (0.000) | ||||
| TANG | -0.160 (0.000) | -0.094 (0.000) | |||||
| AGE | -0.054 (0.000) | ||||||
| VIF | 1.17 | 1.04 | 1.15 | 1.02 | 1.17 | 1.05 | 1.03 |
*Significance levels in parentheses. Table A1 in the Appendix provides definitions of all the variables.
The data for the financing deficit variable in the pecking order regression model are sourced from the companies’ cash flow statement. Table 4 reports descriptive statistics of the dependent and explanatory variables, which have again been winsorized at the upper and lower 0.5th percentiles.
Table 4. Descriptive Statistics* (Pecking Order Model)
| Variable | Mean | Median | St. Dev. | Min. | Max. | Skewness | Kurtosis |
|---|---|---|---|---|---|---|---|
| ∆IGDEBT | 0.001 | 0.000 | 0.055 | -0.113 | 0.141 | 0.505 | 4.191 |
| ∆TOTALDEBT | -0.001 | -0.010 | 0.078 | -0.139 | 0.193 | 0.714 | 3.502 |
| ∆EXTDEBT | -0.004 | 0.000 | 0.041 | -0.085 | 0.104 | 0.602 | 4.369 |
| FD | 0.003 | -0.006 | 0.079 | -0.131 | 0.200 | 0.789 | 3.535 |
| CAPEX | 0.043 | 0.021 | 0.071 | -0.060 | 0.237 | 1.280 | 4.229 |
| DIV | 0.013 | 0.000 | 0.028 | 0.000 | 0.105 | 2.313 | 7.156 |
| WC | 0.007 | 0.002 | 0.055 | -0.104 | 0.137 | 0.356 | 3.419 |
| CASH | 0.004 | 0.000 | 0.028 | -0.050 | 0.076 | 0.689 | 4.114 |
| CF | 0.070 | 0.060 | 0.064 | -0.031 | 0.219 | 0.644 | 2.880 |
*All the variables are scaled by total assets at the beginning of the accounting year. Table A1 in the Appendix provides definitions of all the variables.
6. Empirical results and discussion
6.1. Determinants of intragroup debt financing
In this subsection, we assess the relationship between intragroup debt financing and different firm characteristics. Table 5 presents estimated coefficients from the multivariate Tobit regression model with intragroup debt ratio as the dependent variable, together with the other two regressions in which the dependent variables are total debt and external debt ratios.
Table 5. Estimation Results of the Capital Structure Model
| Explanatory Variables | IGDEBT | TOTALDEBT | EXTDEBT |
|---|---|---|---|
| PROF | -0.356*** (0.038) | -0.482*** (0.037) | -0.091*** (0.032) |
| SIZE | 0.011*** (0.004) | 0.021*** (0.004) | 0.011*** (0.004) |
| TANG | 0.073*** (0.019) | 0.134*** (0.019) | 0.062*** (0.017) |
| AGE | -0.055*** (0.008) | -0.104*** (0.008) | -0.046*** (0.007) |
| GROWTH | -0.059** (0.029) | 0.061** (0.028) | 0.119*** (0.024) |
| Observations | 4,447 | 4,447 | 4,447 |
| Log likelihood | 3,332.57 | 3,430.09 | 4,039.07 |
| Likelihood ratio test | 5,134.26 (0.000) | 5,674.70 (0.000) | 6,348.44 (0.000) |
Panel data Tobit regression coefficients estimated from Equation [1] with robust standard errors in parentheses. Table A1 in the Appendix provides definitions of all the variables. Superscript asterisks indicate statistical significance at 0.01(***) and 0.05(**) levels. The likelihood ratio test compares the pooled estimator with the panel estimator with the null hypothesis that there are no panel-level effects; in this case, the test supports the rejection of the null hypothesis, and accordingly a panel data estimation is performed, as it is more appropriate (Green, 2018).
The regression results in Table 5 indicate that companies make more use of intragroup debt financing when they are larger and have a high portion of tangible assets. Conversely, firms’ profitability, age and growth are all found to be significantly negatively related to intragroup debt. Therefore, H1 can be considered verified, while H2 is partially confirmed. All three regressions yield the same signs for the estimated coefficients, except for the growth estimate. Specifically, growth has a negative and significant coefficient in the specification explaining intragroup debt, but it turns out to be positive and significant in explaining total debt and external debt. Our predictions on the behaviour of the growth variable are contrary to the empirical results obtained. A possible explanation for this fact will be discussed in Section 7.
Not only are the results statistically significant, but economically. On the basis of Mitton (2022), we compute the change in the dependent variable, as a percentage of its mean, associated with a one-standard-deviation change in the explanatory variable, based upon the estimated regression coefficient in absolute values. For instance, a one standard deviation change in profitability implies a change equal to 8.35% of mean intragroup leverage. The corresponding figures of the economic significances of the other explanatory variables for the intragroup debt regression are 6.58% (SIZE), 7.51% (TANG), 13.14% (AGE), and 1.12% (GROWTH).
Due to the different proportions of intragroup, total, and external debt over total assets 4, it would be better to transform the estimated coefficients displayed in Table 5 into their corresponding elasticities, so that we can compare them more effectively. For instance, the -0.356 estimated profitability coefficient reported in the IGDEBT column of Table 5, combined with a sample mean intragroup debt ratio of 0.273, and a sample mean profitability of 0.077, implies a profitability elasticity of intragroup debt equal to -0.100. By comparing this implied profitability elasticity with the corresponding ones obtained in the TOTALDEBT and EXTDEBT regressions (-0.080 and -0.039, respectively), it can be seen that the more profitable companies are (i.e., the greater cash flow generating capacity they have), the less they resort to debt financing, with intragroup debt being the most negatively affected by this issue. As far as size and tangibility are concerned, their corresponding elasticities imply a relatively less effect on intragroup debt financing than on total debt and external debt. This outcome could be due to the fact that although the companies’ size and tangibility relate both to business risk and financial distress costs, intragroup debt financing serves as a financial support in case member firms of a group face financial difficulties (Gopalan et al., 2007). All the specific implied elasticities are presented in Table 6.
Table 6. Estimated Coefficients Implied Elasticities
| Explanatory Variables | IGDEBT | TOTALDEBT | EXTDEBT |
|---|---|---|---|
| PROF | \(\small -0.356 \cdot \frac{0.077}{0.273}=-0.100\) | \(\small -0.482 \cdot \frac{0.077}{0.464}=-0.080\) | \(\small -0.091 \cdot \frac{0.077}{0.182}= -0.039\) |
| SIZE | \(\small 0.011 \cdot \frac{11.083}{0.273}= 0.447\) | \(\small 0.021 \cdot \frac{11.083}{0.464}=0.502$\) | \(\small 0.011 \cdot \frac{11.083}{0.182}=0.670\) |
| TANG | \(\small 0.073 \cdot \frac{0.276}{0.273}=0.074\) | \(\small 0.134 \cdot \frac{0.276}{0.464}=0.080\) | \(\small 0.062 \cdot \frac{0.276}{0.182}=0.094\) |
| AGE | \(\small -0.055 \cdot \frac{3.017}{0.273}=-0.608\) | \(\small -0.104 \cdot \frac{3.017}{0.464}=-0.676\) | \(\small -0.046 \cdot \frac{3.017}{0.182}=-0.763\) |
| GROWTH | \(\small -0.059 \cdot \frac{0.010}{0.273}=-0.002\) | \(\small 0.061 \cdot \frac{0.010}{0.464}=0.001\) | \(\small 0.119 \cdot \frac{0.010}{0.182}=0.007\) |
6.2. Substitutability of intragroup and external debt
An interesting research question is whether intragroup or internal debt and external debt are substitutes. As stated in Section 4, a direct way to test whether this is the case is to regress intragroup debt on external debt and the rest of explanatory variables. In this setting, perfect substitutability between these two types of debt financing would imply a coefficient of -1.0 on external debt. As reported in Table 7, the extent to which companies substitute intragroup debt for external debt is smaller than perfect, though statistically significant, with roughly 25% degree of substitutability. Therefore, our substitution effect hypothesis (i.e., H3) is fulfilled. This effect is also economically relevant, as a one standard deviation decrease in external debt is associated with an increase of 0.19 mean intragroup debt.
For ease of comparison, Table 7 also includes the regression estimates considering total debt as another independent variable instead of external debt; it yields a significant positive coefficient for the relationship with intragroup debt.
Table 7. Estimation Results of the Capital Structure Model
| Explanatory Variables | IGDEBT | IGDEBT |
|---|---|---|
| EXTDEBT TOTALDEBT PROF SIZE TANG AGE GROWTH | -0.245*** (0.016) -0.411*** (0.037) 0.014*** (0.003) 0.094*** (0.018) -0.070*** (0.008) -0.041 (0.028) | 0.360*** (0.014) -0.150*** (0.037) 0.003 (0.003) 0.020 (0.017) -0.022*** (0.007) -0.093*** (0.027) |
| Observations Log likelihood Likelihood ratio test | 4,447 3,451.47 4,475.60 (0.000) | 4,447 3,620.84 4,589.63 (0.000) |
Panel data Tobit regression coefficients estimated from Equation [1] with robust standard errors in parentheses. Table A1 in the Appendix provides definitions of all the variables. Superscript asterisks indicate statistical significance at 0.01(***) level. The likelihood ratio test compares the pooled estimator with the panel estimator with the null hypothesis that there are no panel-level effects; in this case, the test supports the rejection of the null hypothesis, and accordingly a panel data estimation is performed, as it is more appropriate (Green, 2018).
6.3. Pecking order with intragroup debt financing
In Subsection 6.1. we report a significantly negative relationship between profitability and intragroup debt, with a coefficient notably larger than the one for external debt. This result might suggest a financing choices hierarchy, where intragroup debt would be preferred to external debt for covering any external funds requirements. However, what this inverse relationship really shows is that internal funds are preferred to (intragroup/external) debt, but it does not actually prove that debt is preferred to new equity. Therefore, we need a more rigorous empirical analysis to test the existence of the pecking order financing pattern.
As already stated, the pecking order theory predicts that firms with financing deficits are more likely to issue debt. Therefore, in Equation (2) the hypothesis to be tested is \(\beta_{0}=0\) and \(\beta_{1} > 0\).5 The results of the estimation by fixed effects panel-data regressions are shown in Table 8. The Wald test confirms the significance of the overall regression equations. Conversely, the results of the Hausman test enable us to reject the hypothesis regarding the absence of correlation between the unobservable effects and the explanatory variables; we thus consider the individual effects as fixed.
Table 8. Estimation Results of the Aggregated Pecking Order Model
| Explanatory Variable | ∆IGDEBT | ∆TOTALDEBT | ∆EXTDEBT |
|---|---|---|---|
| Intercept FD | 0.000 (0.001) 0.478*** (0.010) | -0.003*** (0.000) 0.912*** (0.007) | -0.004*** (0.000) 0.267*** (0.008) |
| Observations R-Squared Within Wald test (F statistic) Hausman test (χ2) | 4,084 0.407 1.48 (0.000) 11.10 (0.001) | 3,994 0.855 2.08 (0.000) 9.65 (0.002) | 4,084 0.238 1.52 (0.000) 6.71 (0.010) |
Panel data fixed-effects regression coefficients estimated from Equation [2] with robust standard errors in parentheses. Table A1 in the Appendix provides definitions of all the variables. Superscript asterisks indicate statistical significance at 0.01(***) level. Wald test statistic refers to the null hypothesis that all coefficients of the explanatory variables are equal to zero. Hausman test refers to the null hypothesis that fixed effects and random effects are equivalent.
As can be seen in Table 8, the hypothesis formulated for the existence of a pecking order in the companies’ financing policy (i.e., H4) is verified, as the parameter associated to the financing deficit is positive and statistically significant. The figures are comparatively larger in the intragroup debt regression, and its economic significance is noteworthy: a one standard deviation increase in financing deficit is associated with a 0.69 standard deviation in intragroup debt. All the foregoing indicates that there is a pecking order in debt financing, and companies are more prone to take on intragroup debt than external debt in order to cover their internal financing shortages.
Frank & Goyal (2003) stress the importance of separately examining the components of the financing deficit, which allows an analysis of the impact of each component on debt. The estimated coefficients of our disaggregated version of Equation (2) are reported in Table 9. In addition to confirming our results in Table 8 and comparing the results for intragroup debt and external debt, Table 9 shows the higher values of the intragroup coefficients compared to the external debt coefficients. Once again, it can be concluded that hypothesis H4 is confirmed. This explains how the use of the internal capital market maintains a hierarchy of preferences when companies have to cover their funding shortfalls. Furthermore, the intercept coefficient value is very close to zero in all regressions, which confirms our predictions of its value.
Table 9. Estimation Results of the Disaggregated Pecking Order Model
| Explanatory Variables | ∆IGDEBT | ∆TOTALDEBT | ∆EXTDEBT |
|---|---|---|---|
| Intercept CAPEX DIV ∆WC ∆CASH CF | 0.001 (0.002) 0.387*** (0.014) 0.693*** (0.042) 0.444*** (0.016) 0.413*** (0.029) -0.438*** (0.022) | -0.012*** (0.002) 0.803*** (0.013) 1.090*** (0.040) 0.851*** (0.015) 0.866*** (0.028) -0.690*** (0.022) | -0.010*** (0.001) 0.265*** (0.011) 0.200*** (0.032) 0.230*** (0.012) 0.277*** (0.023) -0.160*** (0.017) |
| Observations R-Squared Within Wald test (F statistic) Hausman test (χ2) | 4,084 0.306 1.44 (0.000) 17.16 (0.004) | 3,994 0.651 1.52 (0.000) 16.99 (0.005) | 4,084 0.211 1.50 (0.000) 23.97 (0.000) |
Panel data fixed-effects regression coefficients estimated from Equation [2] in disaggregated form with robust standard errors in parentheses. Table A1 in the Appendix provides definitions of all the variables. Superscript asterisks indicate statistical significance at 0.01(***) level. Wald test statistic refers to the null hypothesis that all coefficients of the explanatory variables are equal to zero. Hausman test refers to the null hypothesis that fixed effects and random effects are equivalent.
As Chirinko & Singha (2000) and Lemmon & Zender (2010) point out, under the pecking order theory, the relationship between the change in debt and the financing deficit when firms face debt capacity constraints is concave. The quadratic term of the financing deficit in Equation (3) captures the concave nature of the relationship and Table 10 presents the results of the estimations. Intragroup debt shows a squared financial deficit coefficient of -0.371, which is statistically significant. This fact corroborates our results from Table 8 and confirms the existence of a concave relationship between the increase in intragroup debt and the financing of the funding shortfall. Total debt follows a process similar to that of intragroup debt variation. It is important to note that in situations in which companies are closer to their maximum borrowing capacity, under the premise of the hierarchy theory, they will be forced to issue new shares to meet any financing needs. As a result, the degree of concavity between the variation in intragroup debt and the financing deficit will be determined by the companies’ debt capacity.
Table 10. Estimation Results of the Pecking Order Model
| Explanatory Variable | ∆IGDEBT | ∆TOTALDEBT | ∆EXTDEBT |
|---|---|---|---|
| Intercept FD FD2 | 0.003*** (0.000) 0.507*** (0.011) -0.371*** (0.054) | -0.003*** (0.000) 0.918*** (0.007) -0.074** (0.037) | -0.005*** (0.001) 0.265*** (0.009) 0.035*** (0.045) |
| Observations R-Squared Within Wald test (F statistic) Hausman test (χ2) | 4,084 0.415 1.47 (0.000) 10.51 (0.005) | 3,994 0.855 2.05 (0.000) 18.67 (0.000) | 4,084 0.239 1.52 (0.000) 9.21 (0.010) |
Panel data fixed-effects regression coefficients estimated from Equation [3] with robust standard errors in parentheses. Table A1 in the Appendix provides definitions of all the variables. Superscript asterisks indicate statistical significance at 0.01(***) and 0.05(**) levels. Wald test statistic refers to the null hypothesis that all coefficients of the explanatory variables are equal to zero. Hausman test refers to the null hypothesis that fixed effects and random effects are equivalent.
7. Robustness and additional checks
This section presents several different tests to examine the robustness of our results, and to discuss possible extensions of the research.
One concern about our results on the relationship between intragroup debt financing and companies’ characteristics is the issue of endogeneity. In order to tackle this problem, we first test the potential endogeneity of our explanatory variables and then use instruments when necessary; specifically, we use two lagged values of the explanatory variables as instruments. Table 11 reports the new regression results using instrumental variables.
Table 11. Estimation Results of the Capital Structure Model
| Explanatory Variables | IGDEBT | TOTALDEBT | EXTDEBT |
|---|---|---|---|
| PROF SIZE TANG AGE GROWTH | -0.257*** (0.040) 0.014*** (0.004) 0.066*** (0.020) -0.064*** (0.009) -0.082** (0.030) | -0.304*** (0.039) 0.019*** (0.004) 0.144*** (0.020) -0.105*** (0.009) 0.102** (0.030) | -0.084** (0.035) 0.006* (0.004) 0.016 (0.018) -0.040*** (0.008) 0.121*** (0.026) |
| Observations Log likelihood Likelihood ratio test | 3,700 2,828.50 4,306.99 (0.000) | 3,730 2,885.81 4,807.87 (0.000) | 3,726 3,395.04 5,352.36 (0.000) |
Panel data Tobit regression coefficients estimated from Equation [1] with robust standard errors in parentheses, using two lagged values of endogenous explanatory variables as instruments. Table A1 in the Appendix provides definitions of all the variables. Superscript asterisks indicate statistical significance at 0.01(***) and 0.05(**) levels. The likelihood ratio test compares the pooled estimator with the panel estimator, with the null hypothesis that there are no panel-level effects; in this case, the test supports the rejection of the null hypothesis, and accordingly a panel data estimation is performed, as it is more appropriate (Green, 2018).
As can be seen, the estimates in Table 11 are in line with and relatively similar in magnitude to those reported in Table 5.
The growth variable maintains a negative relationship to intragroup debt.6 This relationship contradicts our initial predictions about a positive relationship, and it confirms the results obtained in Section 6. This points to the fact that there might be some kind of interaction between companies’ cash flow generation and the existence of growth opportunities. We analyse the firm–year observations that belong to the first and fourth quartiles of the growth variable distribution, and then check the corresponding cash flow levels for the same quartiles. The results obtained point to a direct correspondence between growth and cash flow. Companies with less growth opportunities have a cash flow generation capacity of 3.44%. On the other hand, companies that face higher growth, are in turn able to generate a higher cash flow, registering a value of 9.24%. These results lead us to believe that those companies that have more growth opportunities reduce their intragroup debt because they are able to generate higher cash flows.
As a complementary analysis, we take into account debt maturity in the capital structure model of Equation (1); the regressions’ estimates with long-term and short-term intragroup debt as dependent variables are not reported to avoid the proliferation of tables in the paper.7 The results indicate that for long-term intragroup debt, the signs and statistical significance of all the explanatory variables are the same as in Table 5, with the exception of growth (it turns out to be non-significant). Conversely, for short-term intragroup debt, most of the variables are no longer significant, except profitability, which maintains both its statistical significance and sign, albeit with a value that is now close to zero. Overall, these results suggest that the intragroup funding is driven by a structural rather than a circumstantial behaviour.
The substitution effect between intragroup debt and external debt has been re-tested considering the potential endogeneity of explanatory variables. The untabulated estimates, for the sake of simplicity, confirm our previous results displayed in Table 7, and therefore the substitution effect between external debt and intragroup debt holds.
Lastly, we check the robustness of our pecking order hypothesis results. In order to do so, we re-estimate the pecking order models specified in Equations (2) and (3), subject to the constraint that the financing deficit only takes positive values. The new estimation results show no noticeable changes compared to those displayed in Tables 8, 9 and 10, and are not reported so as not to lengthen the paper with minor details.
8. Conclusions
In this study, we analyse the debt policy of non-financial Spanish companies that have resorted to intragroup debt financing on a recurring basis over the six-year period 2013-2018. As already stated at the introduction of the paper, this is the first empirical research aiming to analyse the factors influencing intragroup debt policy in Spain. Specifically, we examine the determinants of intragroup debt financing, the degree of substitutability between intragroup debt and external debt, and the existence of a pecking order with the use of different financing funds.
The analysis shows that intragroup debt financing is negatively related to firms’ profitability, age and growth. Conversely, size and tangibility constitute important determinants of intragroup debt financing, as they are both positively related to it. The empirical evidence has confirmed that internal or intragroup debt is preferred over external debt, with roughly a 25% degree of substitutability. Last but not least, we identify a pecking order in companies’ financing sources, where the difference between their investment needs and their cash flows generated, that is their financing deficit, is covered significantly more with intragroup debt than with external debt.
Understanding what determines intragroup debt financing is an important issue in finance. The results of our research could be of benefit to policymakers and company managers by helping them to better understand the mechanics underlying companies’ capital structure policies. In turn, our research can give providers of financial resources an insight into how the internal capital markets operate, thus allowing them to tailor their commercial offers to companies that, in addition to being part of a business group, obtain resources from it.
Our study has focused on intragroup debt financing, but this is not the only source of intragroup financing; another option is raising intragroup funds through equity. The latter has not been taken into account in the current paper, which constitutes a limitation of our study. However, the relevant data were not available for the firms in our sample; besides, in practice private domestic group companies do not seem to fill extra financing needs through internal equity (Dewaelheyns & Van Hulle, 2010). Nonetheless, a focus on the role of intragroup equity financing could open up a new direction for future research.
Finally, considering that many companies seldom resort to public debt or equity –as is the case in Spain– another interesting line of future research could be to explore the potential existence of an optimal mix of different private debt types, such as term loans, lines of credit, capital leases, participative loans, government-subsidized loans, etc., and attempt to identify their main determinants.
APPENDIX
Table A1. Definition of Variables
| Variables | Definition | Expected Signs* |
|---|---|---|
| IGDEBT | Intragroup debt scaled by total assets | |
| TOTALDEBT | Total debt scaled by total assets | |
| EXTDEBT | External financial debt scaled by total assets | |
| PROF | Earnings before interest, taxes, depreciation and amortization scaled by total assets | – |
| SIZE | Natural logarithm of total assets | + |
| TANG | Plant, property and equipment scaled by total assets | + |
| AGE | Natural logarithm of number of years since company’s incorporation | – |
| GROWTH | Annual change in natural logarithm of total assets | + |
| CAPEX | Capital expenditures as the change in total amount of non-current assets (intangible assets + tangible assets + other fixed assets) scaled by beginning-of-year total assets | + |
| DIV | Dividends scaled by beginning-of-year total assets | + |
| WC | Working capital as the change in total inventories, plus the change in trade receivables minus the change in trade creditors scaled by beginning-of-year total assets | + |
| CASH | Change in the amount of cash holdings (cash at bank and in hand) scaled by beginning-of-year total assets | + |
| CF | Cash flow computed as earnings after taxes plus depreciation scaled by beginning-of-year total assets | – |
* This column shows the expected signs of the effects of the explanatory variables on the intragroup debt financing for the capital structure model (PROF, SIZE, TANG, AGE, and GROWTH) and the pecking order models (CAPEX, DIV, WC, CASH, and CF).
Figure A1. Evolution Over Time of Sector Leverage Ratios
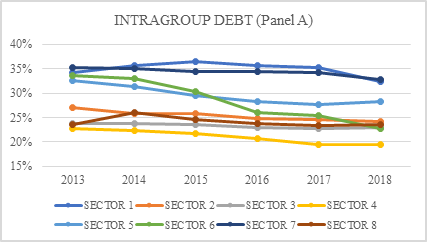
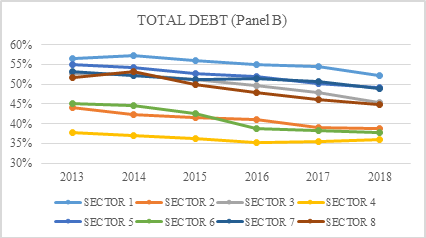
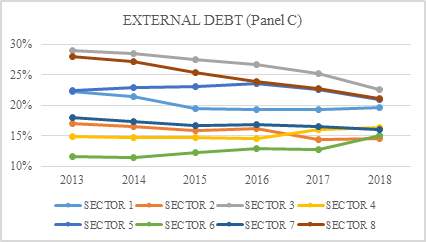
SECTOR 1 Agriculture, forestry, fishing, mining, and energy; SECTOR 2 Manufacturing; SECTOR 3 Construction and real estate activities; SECTOR 4 Wholesale and retail trade; SECTOR 5 Transportation and storage; SECTOR 6 Information and communication; SECTOR 7 Professional, scientific, health, administrative and support service activities; SECTOR 8 Others.