Survey-based Evidence on Positive Synergies between Adaptive Culture and a Balanced Scorecard
ABSTRACT
Prior management accounting research has addressed how organizational culture may substitute or complement the use of decision-making and control of management accounting systems (MASs). However, this paper argues that not all organizational cultures and MASs are equal. Their compatibility determines whether their usage together creates any positive or negative synergies. This paper follows a 2017 survey-based methodology with 102 managers of different nationalities. Collected responses indicate the role that culture plays in their usage of the balanced scorecard (BSC) and their consciousness concerning Key Performance Indicators (KPIs). Remarkably, our survey of managers reveals that adaptive cultures create positive synergies with the BSC and, consequently, positive judgments on the KPI scale.
Keywords: Management accounting systems; Organizational culture; Adaptive culture; KPI; BSC.
JEL classification: M41; M14; L1.
Pruebas basadas en encuestas sobre las sinergias positivas entre la cultura adaptativa y el cuadro de mando integral
RESUMEN
Las investigaciones anteriores sobre contabilidad de gestión han abordado cómo la cultura organizativa puede sustituir o complementar el uso de la toma de decisiones y el control de los sistemas de contabilidad de gestión (SCG). Sin embargo, este artículo sostiene que no todas las culturas organizativas y los SCG son iguales. Su compatibilidad determina si su uso conjunto crea sinergias positivas o negativas. Este trabajo sigue una metodología basada en una encuesta realizada en 2017 a 102 directivos de diferentes nacionalidades. Las respuestas recogidas indican el papel que desempeña la cultura en el uso del cuadro de mando integral (CMI) y su conciencia sobre los indicadores clave de rendimiento (ICR). De forma notable, nuestra encuesta a los directivos revela que las culturas adaptativas crean sinergias positivas con el CMI y, en consecuencia, juicios positivos en la escala de los ICR.
Palabras clave: Management accounting systems; Organizational culture; Adaptive culture; KPI; BSC.
Códigos JEL: M41; M14; L1.
1. Introduction
It is well known that the balanced scorecard (BSC) was initially developed as a performance measurement framework that added non-financial measures to, until then, solely used financial measures (Kaplan, 2012). This type of management accounting system (MAS) gave managers a wider and more balanced view of the company’s performance, guiding future actions in organizations worldwide (Farooq & Hussain, 2011; Kaplan & Norton, 1992; Malgwi & Dahiru, 2014). As the BSC evolved, using the four positions of the financial, customer, internal process, and learning and growth perspectives, company strategies developed into clear objectives, measures, targets, and initiatives (e.g., Kaplan & Norton, 2000, 2001a, 2001b, 2004). Nowadays, the BSC is widely used for strategic design and its execution by a variety of for-profit and non-for-profit organizations sited in different continents (e.g., Rautiainen et al., 2017; Urquía-Grande et al., 2021).
Prior accounting research reported disagreements and conflicts with regard to the effectiveness of these usages of BSC (e.g., Ittner et al., 2003; Malina & Selto, 2001; Wong-On-Wing et al., 2007). Some voices oppose the “tyranny” of BSC and its negative effects, e.g., on innovation, and state that the BSC is a “myth,” “rhetoric from a management guru,” or no more than a hierarchical top-down model (Nørreklit, 2000; Voelpel et al., 2006). Defenders of the BSC argue that firms’ experiences are proof that the BSC does not hamper innovation (Kaplan & Norton, 2006), and that its incorporation of some bureaucratic principles is their way of counterbalancing common negative perceptions regarding bureaucracy (Costa et al., 2019).
The match between the dominant culture (informal system) and the BSC (formal system) is one possible explanation for these discrepancies. The effectiveness of the different MASs varies with the involvement, consistency, adaptability, and mission that define what organizational culture is (Deem et al., 2010), and the BSC is no exception (Gupta & Salter, 2018). Clearly, the BSC is a tool that firms design under the auspices of the cultural values within their mission, vision, and strategy. Additionally, this type of MAS is able to change and contribute to creating a new corporate culture (Gibbons & Kaplan, 2015).
When firms design their BSC to lead a dynamic pathway of change driven by the expected relationships between the strategic objectives of the four perspectives, the BSC encapsulates the values they hold in common with what organizational literature defines as an adaptive culture. Adaptive cultures focus on the stakeholders, customers, and employees that let an organization successfully cope with necessary organizational change (e.g., Kotter & Heskett, 1992; Costanza et al., 2016), which corresponds to the BSC design (e.g., in its perspectives). For this reason, we research whether adaptive cultures positively influence the effective usage of BSCs for decision-making and decision control, and enhance the BSC consciousness.
The use of the BSC is based on agreements among managers on its formal measures and it is expected to be used in informal management (Gibbons & Kaplan, 2015). Therefore, a managerial consciousness is a prerequisite for the successful use of the BSC. This consciousness ensures that managers are not only passive recipients of the BSC but that they are also able to communicate and transmit this meaningful information (Sebastián, 2016).
We survey the role that organizational culture plays in the application of the BSC and the consciousness among managers concerning KPI. Then, this survey provides evidence of the reaction of managers to the cultural-accounting dimensions of BSC. Results confirm that adaptive cultures enhance the use of BSC for decision-making purposes. This specific type of culture leads managers to be more conscious of the KPIs, and this consciousness encourages them to use these KPIs in their decision-making. However, other more competitive cultures that reward personnel for heavily outperforming each other inhibit the use of KPIs for control purposes.
Our paper is structured as follows: in the next section, the theoretical background is presented. Then, we study whether the compatibility between cultures and BSC encourages the uses of BSC for decision management and decisions, with the adaptive cultures being the most compatible, and that both decisional uses enhance KPI consciousness. This is followed by the conducted survey to test these causal research questions, presenting the findings and main conclusions. Finally, this paper outlines limitations of the study and directions for future research.
2. Theoretical Background and Formulating Research Questions
2.1. MAS, BSC, and organizational culture
MASs are used in organizations for the purposes of decision-making and control. This does not mean that all MASs are equally helpful in both dimensions, e.g., traditional budgeting lacks relevance and timeliness for decision-making while facilitating performance evaluation (Zimmerman, 2011). Initially, the BSC was designed by Kaplan & Norton (1992) as a management control system (MCS). The BSC is helpful for control purposes as it provides a performance measurement system that combines financial and non-financial measures with short-term and long-term projections in a holistic approach to performance evaluation (e.g., Dossi & Patelli, 2010; Kaplan & Norton, 2004; Wong-On-Wing et al., 2007).
Over time, the role of the BSC has progressed to support decision-making. The BSC lets organizations translate strategy and mission statements into helpful information for supporting goal setting, compensation decisions, resource allocation, planning and budgeting, communication of strategic feedback and learning (e.g., Kaplan., 2006a, 2006b; Malmi, 2001; Tsang et al., 1999). Specifically, the BSC helps managers to analyze problems, check thinking against data, make rational decisions, and make sense of data (Wiersma, 2009). In summary, the BSC is a helpful tool to monitor current and future performance, to assist in translating an organization’s vision into a set of performance measures supported by specific targets, and to facilitate the identification of success drivers while highlighting the planning dimension of the BSC (Vieira et al., 2017). The intensity of both uses (in decision-making and in control) across organizations vary widely, e.g., in some, the BSC facilitates the agreement of upper and lower-level management on targets, while in others it only provides information for managers responsible for financial targets (Malmi, 2001).
Culture is a socially driven control (or an informal control, in the words of Pitkänen & Lukka, 2011), which is slow to change, and that forms part of the MCS package, coexisting with accounting tools like the BSC in contemporary organizations. Culture consists of a set of values, beliefs, and social norms that the managers of an organization share and that influences organizational behaviors (Malmi & Brown, 2008; Schein, 1988), organizations tend to recruit individuals that match the corporate culture, also socializing these individuals into the culture as an effective tool for forming psychological capital (Krajcsák, 2018; Malmi & Brown, 2008). Furthermore, the company culture affects the worker at every level, from the daily interaction with other employees to the understanding of the correct way to solve problems and get things done (Armstrong, 2006; Park et al., 2004). The culture of a company steers away from acting in the interests of the company while motivating personnel and offering guidance (Doran & Ryan, 2017). In summary, the culture is part of the socially driven (or informal) management decision systems (MDS) package, and does not solely belong to the MCS package.
Despite the significant amount of research examining the relationship between culture and the MAS, most of these investigation efforts have focused on national culture, which makes further attempts to measure cultural values and assumptions at organizational and individual levels still necessary (e.g., Otley, 2016; Malmi et al., 2020). Literature on these two levels addresses that organizational culture is sometimes framed as a complement, and other times as a substitute of the MAS in its function of supporting decision-making and control (e.g., Chenhall, 2003; Gupta & Salter, 2018; Mikes, 2009).
If the isolated effects of culture and of MAS on organizational performance are indeterminate – as it is not clear whether they have positive, negative or no effect on the performance of companies operating in different sectors and countries (Han, 2012; Malmi et al., 2020; Pérez Granero et al., 2017; Yesil & Kaya, 2013)1 – its joint effect is even more uncertain. Organizational culture has an influence—sometimes positive, other times negative—over the way in which individuals interpret the information provided by the MAS. Managers and other employees can judge the same MAS that provides information for decision management and decision control as a threat, an opportunity, neither or both, under the lens of the culture (e.g., Yates & Oliveira, 2016).
2.2. Trade-offs between different types of organizational culture and BSC
Prior studies have distinguished different culture types. Clan culture results in committed, participative, collaborative, and high-morale employees (Cameron and Quinn, 1999; Tseng, 2010). Adhocracy culture focuses on values such as dynamism, innovation, creativity, or adaptability (Cameron and Quinn, 1999; Tseng, 2010). Market culture concentrates on competition being results-oriented (Yesil & Kaya, 2013). Hierarchal culture emphasizes structure and seeks stability, resulting in formalized processes and procedures, predictability, and efficiency (Yesil & Kaya, 2013). In terms of the locus of control, clan and hierarchical cultures have an internal locus while adhocracy and market cultures have an external locus (Krajcsák, 2018).
The BSC incorporates those different cultures as intangible assets in its learning and growth perspective for the purpose of reinforcing changes in an organizational climate that facilitates strategy implementation (Kaplan & Norton, 2004). This is not an easy task: competing cultures coexist in the same organization and each one of them is influenced by myriad factors (e.g., by rival institutional logics; Rautiainen et al., 2017). However, organizations recruit, train, expose, and promote their members in the context of their dominant culture (e.g., Kotter & Heskett, 1992; Kristof-Brown et al., 2005), and while dimensions of certain dominant cultures, like performance orientation, future orientation, and power distance, are positively related to the BSC use (Gupta & Salter, 2018), others like collectivism or uncertainty avoidance discourages this use. It suggests that the type of dominant organizational culture is a significant driver of BSC usage.
Furthermore, senior managers design missions, visions, or strategic objectives, and communicate them to employees, through the strategic map of the BSC. They also set and communicate targets for the key performance indicators (KPI) associated with each strategic objective. Therefore, they intentionally create belief systems based on the dominant culture so as to transmit to mid-level managers and other employees the correct paths to decision-making and the basis of its evaluation (e.g., Malmi & Brown, 2008; Mohamed, 2003). In summary, the BSC anticipates, disseminates, reports, provides feedback, and motivates toward an intended culture. Here, the relevant issue is whether this intended culture is truly compatible with the BSC.2 In summary, this leads us to propose that:
Research Question 1a: If the dominant culture is compatible with the BSC, there is a positive effect of culture on the uses of BSC for decision management and decision control.
Corporate culture consists of “values,” “beliefs,” and “norms” that influence behaviors in organizations (Flamholtz & Randle, 2012). If those “values,” “beliefs,” and “norms” are long-standing, relatively stable, and with slow changes, the result is a strong and static culture (Costanza et al., 2016; Kotter & Heskett, 1992; Verdu-Jover et al., 2018). An adaptive culture, in contrast, is characterized by “a pattern of shared beliefs, values, and behaviors that indicate the organization is aware of and concerned about environmental changes and is oriented toward agile and flexible action to address such changes” (Costanza et al., 2016, p. 364). This adaptability is a cultural trait that contributes to explaining organizational survival and success because it facilitates changes and flexibility in response to environmental pressure (e.g., Costanza et al., 2016; Henri, 2006; Zheng et al., 2010).
Non-stable cultures emphasize control beliefs and the other levels of control identified by Simons (2000) (see also Heinicke et al., 2016). Distinctly, more adaptive cultures encourage managers to initiate changes to satisfy stockholders, customers, processes, and employees (Costanza et al., 2016; Kotter & Heskett, 1992), which are three of four perspectives that managers must balance in the BSC (Kaplan, 2006a; Kaplan & Norton, 2001). Furthermore, the Internet and other information and communication technologies have introduced a dynamic change in the ways in which organizations respond to interactions with stakeholders, develop products and services, deal with their business transactions or organize their work with employees (Alsharari et al., 2015). The BSC captures adaptability because innovation is framed as a critical internal process with a continuous development of new products, services, and business relationships, and the learning and growth perspective capture intangibles related to informational capital (Kaplan & Norton, 2004, 2006).
In addition, the BSC makes adapting strategy a continual process (Kaplan, 2006a; Kaplan & Norton, 2001). We cannot forget that the BSC lets organizations “learn and adapt their strategies to changing knowledge and economic conditions, and be responsive to new ideas emerging from within the organization” (Kaplan & Norton, 2006, 423).
In current organizations change is more necessary than ever to avoid becoming inert, low performers, and obsolete organizations, and to allow them to survive and prosper (Carter et al., 2013). This emphasis on change is caused by several factors. Value systems are a mechanism of organizational change (Marginson, 2009), and the BSC is not only a vehicle for transmitting these values across organizations in settings of change but these core values and strategic orientation are also what allow the BSC to achieve its aimed decisional and organizational control effect (Kaplan & Norton, 2004). Although this prior literature supports the rationale that adapting culture is very aligned with the BSC, it does not mean that adapting the effectiveness of the BSC organizations is simple, notably, for non-for-profit organizations, or for those organizations that operate in countries that are confronting political instability, corruption, growing reporting needs, inflation, or financial shortfalls (Urquía-Grande et al, 2021). In summary, when the organizational culture is adaptive, the use of the BSC is more adequate for making decisions and controlling them.
Then, we propose:
Research Question 1b: Adaptive cultures have a positive effect on the use of BSC for decision management and control.
2.3. BSC consciousness
The BSC aims to empower middle and lower levels of the organization, encouraging them to find new and different ways to achieve the targeted performance (Kaplan, 2012). The organizational challenge is that managers should not underuse or even ignore the BSC measures designed for each unit (Lipe & Salterio, 2000). Therefore, the psychology of managers who are recipients of the BSC matters.
Prior literature has examined the mental processes related to the managerial usage of BSC by testing its consequences, e.g., when BSC provides a superior financial performance (Davis & Albright, 2004; Hall, 2016), and its antecedents, e.g., whether the need to justify performance evaluations, or an assurance of quality by a third party influences the use of BSCs (Libby et al., 2004). Specifically, this literature addressed the importance of KPI consciousness. This consciousness means that managers are more than KPI recipients because they assume a more active role. Then, consciousness matters because the effective use of the BSC is based on agreements over its formal measures and how they are expected to be used in informal management (Gibbons & Kaplan, 2015).
Consciousness is also a topic that has been examined by earlier literature on MASs, whereas the topic of cost-consciousness is framed as an antecedent of positive and negative results on the effective use of cost systems for decisional and control purposes (Velasquez et al., 2015). Among other positive results, cost-consciousness results in the better use of cost information for pricing purposes, creating a basis for evaluating efficiency in profit centers, quicker response to market needs, or improved monitoring (Abernethy & Vagnoni, 2004; Shields & Young, 1994). Cost-consciousness helps managers to overcome the great difficulty of establishing empirical relations of organizational variables, such as formal and informal structures or innovation with performance. In summary when managers use cost systems for decision-making and decision control they learn from this on-the-job experience and are more conscious of costs (e.g., Abernethy & Vagnoni, 2004; Da Silva et al., 2020; Shields & Young, 1994; Velasquez et al., 2015).
If consciousness is the result of a cognitive process of information treatment that results in meaningful information (Sebastián, 2016) cost-consciousness is the extent to which managers are concerned about the cost consequences of their decision-making (Abernethy & Vagnoni, 2004). In a similar manner, we define BSC consciousness as the manager’s feelings, perceptions, thinking, and memories with regard to the BSCs that will play an important role in their involved managerial judgments.3
We argue that this BSC consciousness is a necessary antecedent of the BSC effectiveness for dealing with organizational change. The BSC is designed to help managers deal with changing customer tastes, innovation, and global markets (Kaplan, 2006a). The use of the BSC by middle and lower levels for decisional and control purposes under the auspices of adpatives cultures should result in higher BSC consciousness. These cultures enhance managerial values such as adaptability and change while hired employees align their behaviors with these values. We do not expect all cultures to have the same effect on consciousness. Similarly, Shields & Young (1994) find that certain cultures that do not emphasize the economic dimension hinder cost-consciousness. We find no proof that those cultures that hinder adpatibility have a negative effect on KPI consciousness.
In summary, we aim to investigate:
Research Question 2: The use of BSC for decision management and decision control in adaptive cultures has a stronger positive effect on BSC consciousness.
3.1. Data collection
In 2017, we surveyed 102 managers. All of them were BSC users and we questioned them about this usage. Through the Google Forms platform, we elaborated the survey, which was then shared on social media platforms. First, we randomly selected the Facebook and LinkedIn accounts of those in managerial positions. To reach a wider number of potential respondents, the survey was also shared on the ex-alumni University Carlos III de Madrid’s wall. Around 20% of respondents came from the latter group and 80% from the former. Although the number of respondents is small, their responses are enough for theory-testing research and useful in the study of the multiple facets of relationships between culture and the BSC, as indicated for survey-based management accounting research by Van der Stede et al. (2006).4
The majority of respondents were female, 54.9%, while 45.1% were male (Table 1). As for nationalities, 39.2% of the respondents were Estonian, 34.3% Spanish, and 6.9% American (from US, Brazil, and Ecuador). The other nationalities were the following: British, Latvian, Italian, French, Danish, Indian, Irish, Japanese, Lithuanian, Serbian, and Swiss.5 Most of the surveyed managers were under 29 years old (Table 2), had spent less than five years in their current position, but their on-the-job experience was up to five years on average (Table 1). All these managers believed that their knowledge of BSCs allowed them to reply to the questionnaire, including those 50 managers who had less than one year in the current position.6 They typically worked in a company with 100 or more employees and more than €1 million in sales, covering positions in different departments of their firms. All of them manifested in an open-question the type of KPIs to which they had access.
Table 1. Demographic of surveyed managers
| Nationalities | Participants | Years in the current position | number | Size of firms | number |
|---|---|---|---|---|---|
| Estonian | 40 | Less than 1 year | 50 | Less than 10 employees | 12 |
| Spanish | 35 | From 1 to 5 years | 36 | From 10 to 100 employees | 29 |
| US | 4 | From 9 to 10 years | 5 | From 100 to 500 employees | 18 |
| British | 4 | More than 10 years | 11 | From 500 to 2,500 employees | 13 |
| Latvian | 4 | On-the-job experience | number | More than 2,500 employees | 30 |
| Italian | 3 | Less than 1 year | 8 | Sales | number |
| Brazilian | 2 | From 1 to 5 years | 48 | Less than 1 million € | 20 |
| French | 2 | From 9 to 10 years | 24 | From 1 to 5 million € | 26 |
| Danish | 1 | More than 10 years | 22 | From 10 to 50 million € | 14 |
| Ecuadorian | 1 | Departments | number | More than 50 million € | 42 |
| Indian | 1 | Marketing | 34 | Gender | number |
| Irish | 1 | Finance & Accounting | 32 | Female | 56 |
| Japanese | 1 | Logistic & Production | 20 | Male | 46 |
| Lithuanian | 1 | Human Resources & IT | 12 | ||
| Serbian | 1 | President and vice president | 4 | ||
| Swiss | 1 |
Table 2. Summary of statistics
| Variable | Obs | Mean | Std. Dev. | Min | Max |
|---|---|---|---|---|---|
| Age | 102 | 28.74 | 8.87 | 21 | 67 |
| Estonian or Spanish | 75 | 0.53 | 0.50 | 0 | 1 |
| Less than 5 years in the current position | 102 | 0.84 | 0.37 | 0 | 1 |
| Less than 5 years on-the-job experience | 102 | 0.55 | 0.50 | 0 | 1 |
| Questions: | |||||
| 102 | 5.54 | 1.29 | 2 | 7 |
| 102 | 5.23 | 1.58 | 1 | 7 |
| 102 | 5.43 | 1.50 | 1 | 7 |
| 102 | 4.89 | 1.71 | 1 | 7 |
| 102 | 5.32 | 1.48 | 2 | 7 |
| 102 | 3.44 | 1.75 | 1 | 7 |
| 102 | 4.18 | 1.71 | 1 | 7 |
| 102 | 4.54 | 1.70 | 1 | 7 |
| 102 | 4.26 | 1.84 | 1 | 7 |
| 102 | 4.51 | 1.68 | 1 | 7 |
| 102 | 3.95 | 1.78 | 1 | 7 |
| 102 | 4.28 | 1.75 | 1 | 7 |
| 102 | 4.82 | 1.79 | 1 | 7 |
| 102 | 4.19 | 1.80 | 1 | 7 |
| 102 | 3.92 | 1.66 | 1 | 7 |
| 102 | 3.86 | 1.78 | 1 | 7 |
| 102 | 4.28 | 2.05 | 1 | 7 |
| 102 | 4.32 | 1.99 | 1 | 7 |
| 102 | 3.93 | 1.85 | 1 | 7 |
| 102 | 3.98 | 1.68 | 1 | 7 |
| 102 | 4.30 | 1.92 | 1 | 7 |
| 102 | 3.94 | 1.91 | 1 | 7 |
| 102 | 4.84 | 1.81 | 1 | 7 |
3.2. Methodology
The questionnaire, which is the instrument of our survey methodology, is displayed in the .7 Questions represent the conceptual terms that constitute the culture, BSCs, and KPIs (i.e., this research’s latent constructs). These questions aimed to assess the managers’ perceptions or beliefs in latent constructs on a 7-point Likert scale (e.g., Cox et al, 2003; Gago & Purdy, 2015).
Based on prior literature (e.g., Cooke & Rousseau, 1989; Collins, 2001; Denison, 1990; Roi, 2006) we asked questions with regard to adaptive cultures (questions 1 to 5) and non-adaptive cultures (6 to 8). Adaptive cultures are present in managers that have a clear sense of mission, work in companies that invest in improving their knowledge and skills, empowering them to work across internal boundaries and to collaborate with other departments. They also encourage them to take risks and apply innovative ideas, while applying a clear and consistent set of values that govern the way they do business. By contrast, in non-adaptive cultures, surveyed managers feel that they must avoid making mistakes, tend to avoid challenging each other, and work hard to keep relationships pleasant despite the effects on growth, while they are rewarded for heavily outperforming each other.
Our questions for decision management (questions 9 to 12), and decision control (13 to 16), were inspired by prior literature evaluating the decisional and control effectiveness of other MASs, specifically, of the budget (Swieringa & Moncur, 1972; Abernethy & Vagnoni, 2004; and Da Silva et al., 2020). Thus, we asked surveyed managers whether reports on the investigation of KPI variance, remarkably when they were negative, had consequences for individual or work team activities. In the case of decision control, we asked them about the importance of meeting KPI targets for performance evaluation and corrective actions when there were negative results.
Concerning BSC consciousness, we also used as a point of departure the instrument initially developed by Shields & Young (1994) for measuring consciousness about accounting information, specifically regarding costs, and revised it based on our BSC literature review. Accordingly, we asked managers whether they were aware of the KPI target levels and variance report, and were able to communicate this information. Specifically, we developed questions 17 to 23 to analyze how consciousness affected activities at the workplace and how these activities were influenced by its consciousness, while item 33 captured the general KPI consciousness.8
As our target sample was BSC users, we estimated that answering our survey was not a complex task and we predicted 20 minutes to fill out the questionnaire. However, in practice, respondents needed 20 to 45 minutes. The summary statistics for these questions are displayed in Table 2. Noticeably, all the means are up to 3.
4. Findings and discussion
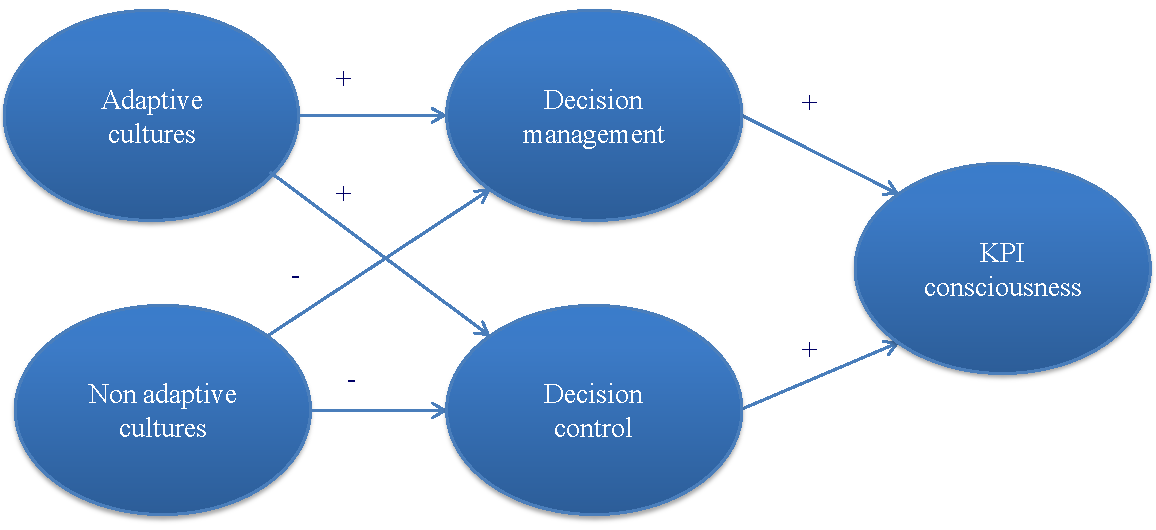
We test our causal research questions using structural equation modeling (SEM) with the partial least squares (PLS) technique that maximizes the amount of variance estimated. Thus, we analyze and interpret the PLS model sequentially in two models. The first one, the measurement model, collects the relationship between the observed variables (responses to the questionnaire) and the corresponding latent constructs (adaptive cultures, non-adaptive cultures, decision management, decision control, KPI consciousness) that can be built with them. Remarkably, at this stage we assess the reliability and validity of the measurement model. The second model, the structural model, identifies the possible relations among the latent constructs, i.e., enabled us to test the research questions (Bisbe et al., 2007; Figure 1).
Figure 1. Framed relations in BSC settings
Our findings support the reliability and validity of the measurement models that we propose. Thus, the Cronbach’s alphas of all the constructs, except for non-adaptive cultures, are well above the 0.70 level recommended by Nunnally (1978) (Table 3, Panel A). This leads one to believe that, with the exception of the non-adaptive cultures construct, the answers to the questions are internally consistent when explaining their corresponding constructs. This affirmation is supported by the fact that non-adaptive culture is the only construct that does not exceed the required 0.50 level for the average variance extracted (AVE). This construct also has an extremely low composite reliability, while all the other constructs have an internal consistency above 0.84.
Table 3. Quality criteria overview and PLS outer loadings
| Panel A: Quality criteria overview | ||||||
|---|---|---|---|---|---|---|
| Construct | AVE | Composite Reliability | R2 | Cronbach's Alpha | Communality | Redundancy |
| Adaptive culture | 0.6229 | 0.8912 | 0 | 0.8500 | 0.6229 | 0 |
| Non-adaptive culture | 0.3305 | 0.1460 | 0 | 0.3304 | 0.3305 | 0 |
| Decision management | 0.6987 | 0.9026 | 0.1713 | 0.8560 | 0.6987 | 0.1197 |
| Decision control | 0.5824 | 0.8468 | 0.1590 | 0.7570 | 0.5824 | 0.0635 |
| KPI consciousness | 0.5199 | 0.8816 | 0.6233 | 0.8546 | 0.5199 | 0.2200 |
| Non-adaptive culture (1) | 0.6663 | 0.7996 | 0 | 0.5003 | 0.6663 | 0 |
| Non-adaptive culture (2) | 1 | 1 | 0 | 1 | 1 | 0 |
| Panel B: PLS outer loadings | |||||
|---|---|---|---|---|---|
| Survey- question’s reply | Adaptive culture | Non-adaptive culture | Decision management | Decision control | KPI consciousness |
| Employees have a clear sense of mission that gives them direction and purpose for their work | 0.8941 | 0 | 0 | 0 | 0 |
| Company invests in improving the knowledge and skills of employees. | 0.7216 | 0 | 0 | 0 | 0 |
| Employees are empowered to work across internal boundaries and collaborate with other departments | 0.7421 | 0 | 0 | 0 | 0 |
| Employees are encouraged to take risks and apply innovative ideas | 0.7193 | 0 | 0 | 0 | 0 |
| The company applies a clear and consistent set of values to govern the way to do business | 0.8522 | 0 | 0 | 0 | 0 |
| People feel they must avoid making mistakes | 0 | -0.1607 | 0 | 0 | 0 |
| People tend to avoid challenging each other and work hard to keep relationships pleasant despite it affecting growth | 0 | -0.2126 | 0 | 0 | 0 |
| People are rewarded for heavily out-performing each other | 0 | 0.9594 | 0 | 0 | 0 |
| I investigate the matters that cause the negative variation in my KPI’s target level | 0 | 0 | 0.8193 | 0 | 0 |
| I change my activities when there is a negative variation in my target KPI | 0 | 0 | 0.8577 | 0 | 0 |
| I trace the cause of the negative variation in the target KPI to the groups or individuals within the workplace | 0 | 0 | 0.8479 | 0 | 0 |
| The target KPI enables me to be a better employee at my workplace | 0 | 0 | 0.8178 | 0 | 0 |
| Meeting the target KPI of my workplace is important for the persons who are responsible | 0 | 0 | 0 | 0.6359 | 0 |
| I am evaluated on the variations in the target KPI | 0 | 0 | 0 | 0.7927 | 0 |
| I am held personally accountable for the negative variations in the target KPI | 0 | 0 | 0 | 0.7927 | 0 |
| I am required to report actions taken to correct the negative variations in the target KPI | 0 | 0 | 0 | 0.8177 | 0 |
| In general, I know what the target level of my KPI is | 0 | 0 | 0 | 0 | 0.8355 |
| I have good knowledge of my target KPI variations | 0 | 0 | 0 | 0 | 0.8415 |
| I make sure that those who work at my workplace know the target level of the KPI | 0 | 0 | 0 | 0 | 0.7805 |
| I am very confident of my ability to manage variations in the target KPI at my workplace | 0 | 0 | 0 | 0 | 0.6433 |
| I put a lot of effort into meeting the target KPI | 0 | 0 | 0 | 0 | 0.6755 |
| When I make decisions, I focus heavily on how it affects my target KPI | 0 | 0 | 0 | 0 | 0.6408 |
| I am very conscious of how the actions in my workplace influence overall targets and objectives of the company | 0 | 0 | 0 | 0 | 0.5857 |
We assess the reliability of individual questions by examining the outer loadings (or simple correlations) between them and their respective constructs (Table 3, Panel B). The majority of these outer loadings are over the significance threshold of 0.70. The exceptions were questions 13, 20, 21, 22, and 23, all with outer loadings up to 0.58, which are acceptable values for exploratory research, like this research (Chapman & Kihn, 2009; Hulland, 1999; Gago & Purdy, 2015). However, we also found further evidence of the problems with the non-adaptive culture construct in the contradictory signs amid outer loadings among features of avoidance (Question 6), perfectionism (Question 7) and competitiveness (Question 8). It motivated us to consider two subconstructs: non-adaptive cultures 1 and non-adaptive cultures 2 (competitive).
Once we confirmed the reliability and validity of the measurement model for building up the constructs, we focused on the relationships among them. We find support for our research questions in these examinations of the correlation between latent constructs (Table 4). Specifically, correlations between adaptive cultures and decision management, adaptive cultures and decision control, and decision control and KPI consciousness are positive and highly significant (0.4139, 0.3397, and 0.471, in that order). We also find significant relations between KPI consciousness and decision management, and KPI consciousness and decision control (0.731 and 0.7344, respectively).9 R2 values assess the goodness-of-fit of the model displayed in Table 3, Panel A. The proportion of the variances in decision management and decision control that are predictable from latent constructs related to culture is satisfactory (R2=0.1713; R2=0.1590, respectively). While the mean R2 for KPI consciousness is very high: 0.62.
Table 4. Constructs correlations
| Adaptive culture | Non-adaptive cultures (1) | Non-adaptive cultures (2) | Decision management | Decision control | KPI consciousness | |
|---|---|---|---|---|---|---|
| Adaptive culture | 1 | |||||
| Non-adaptive cultures (1) | 0.2777 | 1 | ||||
| Non-adaptive cultures (2) | 0.0532 | 0.0568 | 1 | |||
| Decision management | 0.4139 | 0.0481 | -0.0052 | 1 | ||
| Decision control | 0.3397 | 0.0413 | -0.2118 | 0.7227 | 1 | |
| KPI consciousness | 0.4710 | 0.1014 | -0.1188 | 0.7310 | 0.7344 | 1 |
Regarding the significance of the coefficients for path coefficients between latent constructs to test our research questions (Chapman & Kihn, 2009; Gago & Purdy, 2015), we find support for them (Table 5, Panel A).
First, adaptive cultures exert a high and significant positive effect on decision management (0.43; p-value < 0.01), and on decision control (0.36; p-value < 0.01). Non-adaptive cultures 2 negatively affect only decision control (-0.23, < 0.05), while they have no significant effect on decision management. This competitive culture seems to be incompatible with the use of the BSC for decision control. Both findings support research question1a, which claims that some cultures are more compatible with the usages of BSC for decision management (adaptive cultures) and decision control (adaptive cultures) than others (non-adaptive cultures 1 and non-adaptive cultures 2), which supports research question 1b regarding adaptive cultures positively enhancing the usage of BSC. They are also the only ones that exert a high and significant positive effect on KPI consciousness (0.34; < 0.01).
Table 5. Bootstrapping total effects
| Paths | Original Sample (O) | Sample Mean (M) | Standard Deviation (STDEV) | Standard Error (STERR) | T Statistics (|O/STERR|) |
|---|---|---|---|---|---|
| Panel A: PLS for all items | |||||
| Adaptive culture ->Decision management | 0.4351*** | 0.4403*** | 0.0890 | 0.0890 | 4.8890 |
| Adaptive culture -> Decision control | 0.3650*** | 0.3697*** | 0.0980 | 0.0980 | 3.7232 |
| Adaptive culture -> KPI consciousness | 0.3398*** | 0.3470*** | 0.0786 | 0.0786 | 4.3260 |
| Non-adaptive cultures (1) -> Decision management | -0.0714 | -0.0573 | 0.1157 | 0.1157 | 0.6169 |
| Non-adaptive cultures (1) -> Decision control | 0.0471 | -0.0337 | 0.1110 | 0.1110 | 0.4241 |
| Non-adaptive cultures (1) -> KPI consciousness | -0.0502 | -0.0370 | 0.0880 | 0.0880 | 0.5708 |
| Non-adaptive cultures (2) -> Decision management | -0.0243 | -0.0288 | 0.0958 | 0.0958 | 0.2542 |
| Non-adaptive cultures (2) -> Decision control | -0.2286** | -0.2338** | 0.0977 | 0.0977 | 2.3399 |
| Non-adaptive cultures (2) -> KPI consciousness | -0.1088 | -0.1131 | 0.0775 | 0.0775 | 1.4037 |
| Decision management-> KPI consciousness | 0.4191*** | 0.4266*** | 0.0920 | 0.0920 | 4.5563 |
| Decision control -> KPI consciousness | 0.4315*** | 0.4289*** | 0.0976 | 0.0976 | 4.4233 |
| Panel B: PLS for items with outer loadings up to 0.70 | |||||
| Adaptive culture -> Decision management | 0.4283*** | 0.4342*** | 0.1025 | 0.1025 | 4.1798 |
| Adaptive culture -> Decision control | 0.3122*** | 0.3313*** | 0.0992 | 0.0992 | 3.1464 |
| Adaptive culture -> KPI consciousness | 0.3345*** | 0.3459*** | 0.0853 | 0.0853 | 3.9225 |
| Non-adaptive cultures (1) -> Decision management | -0.0555 | -0.0556 | 0.1126 | 0.1126 | 0.4934 |
| Non-adaptive cultures (1) -> Decision control | 0.0068 | 0.0059 | 0.0960 | 0.0960 | 0.0710 |
| Non-adaptive cultures (1) -> KPI consciousness | -0.0255 | -0.0274 | 0.0807 | 0.0807 | 0.3156 |
| Non-adaptive cultures (2) -> Decision management | -0.0242 | -0.0370 | 0.0910 | 0.0910 | 0.2658 |
| Non-adaptive cultures (2) -> Decision control | -0.2732*** | -0.2713*** | 0.0796 | 0.0796 | 3.4325 |
| Non-adaptive cultures (1) -> KPI consciousness | -0.1158* | -0.1221* | 0.0719 | 0.0719 | 1.6098 |
| Decision management -> KPI consciousness | 0.5048*** | 0.5061*** | 0.0825 | 0.0825 | 6.1199 |
| Decision control -> KPI consciousness | 0.379*** | 0.3778*** | 0.0882 | 0.0882 | 4.2983 |
| Panel C: PLS without non-Adaptive cultures and for items with outer loadings up to 0.70 | |||||
| Adaptive culture -> Decision management | 0.414*** | 0.4325*** | 0.0860 | 0.0860 | 4.8139 |
| Adaptive culture -> Decision control | 0.3004*** | 0.3125*** | 0.1050 | 0.1050 | 2.8604 |
| Adaptive culture -> KPI consciousness | 0.3225*** | 0.3386*** | 0.0803 | 0.0803 | 4.0180 |
| Decision management -> KPI consciousness | 0.5037*** | 0.5085*** | 0.0900 | 0.0900 | 5.5951 |
| Decision control -> KPI consciousness | 0.3795*** | 0.3754*** | 0.0950 | 0.0950 | 3.9934 |
* p < 0.10 (one-tail test); ** p < 0.05; *** p < 0.01.
Our results confirm the BSC compatibility with cultures that reinforce changes (Kaplan & Norton, 2004). Dimensions of the adaptability of certain organizational cultures are positively related to the use of the BSC while others, like competition, discourage it. Remarkably, competitive cultures have a negative effect on the use of the BSC for management control. This result suggests that those companies that encourage competition between individuals or departments are not successful in their decisional purposes regarding the BSC in the control area.
Second, decision management exerts a high and significant positive influence on KPI consciousness (0.42; p-value < 0.01), and decision control on KPI consciousness (0.42; p-value < 0.01). Both findings support research question 2. The use of BSC as an MDS and MCS is a prerequisite for KPI consciousness.10 Noticeably, in the case of another MAS, the budget, only decision control was an antecedent for cost-consciousness (e.g., Abernethy & Vagnoni, 2004).
In summary, only those companies that cultivate an adaptive culture achieve a better use of their BSC for both decision management and decision control. In these organizations, middle and lower levels are more conscious of the KPIs used to achieve their strategic objectives.
5. Conclusions
In spite of the fact that there exists abundant academic literature on the BSC, and this is a popular tool in the professional fields related to strategy and accounting, there is no unanimous agreement regarding its organizational value. In fact, some academic and practitioner voices denounce the BCS as not adding too much and claim not all its consequences are positive for organizations. This controversy suggests that there is still a long way to go before we can state when, and under what conditions, the BSC really is a useful tool for planning and management control.
A point of interest is the study of those factors that facilitate the BSC in performing this double role, i.e., to be a support for decisional and control uses. Notably, further research is still necessary on those factors that promote the alignment of managers and personnel with the organizational objectives by following the indications established in their KPI targets. This is precisely the leitmotiv of our research work that focuses on the relationships between organizational culture and managers’ use of the BSC.
Taking into account that the BSC places its emphasis on balancing four perspectives that guide managers’ planning and control, its purpose is not only to meet the needs of owners or creditors, but also to respond to customers’ and suppliers’ demands, and also those of managers and other employees. This multi-stakeholder approach flourishes into a friendly culture, i.e., in a culture that supports this philosophy and associated values, in its cultural interpretation of “the correct way of doing things.” If the informal cultural system is not aligned with the formalized BSC, the personnel that operate under both umbrellas may find impediments to performing their tasks adequately.
In this survey-based research we find that those organizations that have an adaptive culture are more likely to attain a positive return from their BSC, once it is implemented, because managers find it useful for supporting their decision management and decision control. This cultural type generates synergies with the BSC and creates a sound ground for their positive valuation and intention for using the BSC in the decisional and control scopes. In contrast, those organizations with competitive cultures that reward managers, staff, and other employees for heavily outperforming each other may be sending a contradictory message to their employees when, simultaneously, their senior managers are encouraged to use the BSC for planning and control. Remarkably, we find that surveyed manager that frame their cultures as competitive, negatively value their management control under the lens of the BSC. In summary, our results highlight that the cultural fitting between the dominant organizational culture and the BSC may be a critical success factor for its use as a decisional and control tool. This has consequences for the accomplishment of strategic objectives because when surveyed managers do not use the BSC, we find that they tend to ignore the strategic guidelines on strategic objectives that their senior managers set through targets in KPIs.
Although our findings cannot be fully extrapolated due to the small size sample of our survey, it leads us to suggest some general recommendations for a smoother running of BSC in organizations. Thus, our results suggest that adaptive culures grease sliding organizational frictions. Organizations cannot take for granted that the BSC will be equally useful across cultures. In addition, CEOs and senior managers may wish to evaluate the compatibility between this competitive culture and the BSC before deciding on its implementation This recommendation is at the same time extensive to senior managers who are stating the KPI targets because, once the BSC is implemented, cultural compatibility is especially relevant for guaranteeing that managers seek the achievement of the strategic objectives.
This research presents several limitations. The sample for this study comprised 102 managers from a great variety of organizational types, who were working at various levels throughout their organizations. Owing to this sample size being small, further investigation is still needed to extrapolate their results. Subsample sizes are not enough to guarantee the confidence level but the examination of questions attending to the demographic variables suggests some topics of interest for future research. First, our respondents, including those with less than one year in the current position, consider that they possess a satisfactory knowledge of target KPI variations. However, we notice that younger managers are more likely to trace the causes of negative variations in KPI targets to others, without introducing important changes in their activity. Second, surveyed managers with wider on-the-job experience investigate fewer causes of negative variation in the KPI target level than novices. In summary, tenure and on-the-job experience may be influential elements in the cultural and the BSC penetrations.
In addition, our examination of potential departmental influences suggests that this is an issue that deserves further exploration. Different departments may react differently to cultural and BSC influences. For instance, the 32 interviewed managers from the finance and accounting areas feel that they are less empowered to work across internal boundaries and collaborate with other departments, whilst they are less likely to avoid challenging each other and work hard to keep relationships pleasant despite the effect on organizational growth. Surprisingly, surveyed financial and accounting managers only offer minor changes when there is a negative variation in the targeted KPI and, although they do not tend to trace the cause of the negative variation in this target to the groups or individuals within the workplace, they observe that meeting the target KPI is not very important for the people for whom they are responsible and that they are not often evaluated on the variations in the target KPI. One can say that “The shoemaker always wears the worst shoes.”
Another issue that we suggest for further examination is the eventual influence of national cultures versus an international culture in response to KPIs. CEOs, managers, and other personnel may be influenced by this factor. In our sample, national culture does not create any difference with the sole exception of meeting the target KPI, which may be more important for Estonian managers than for Spanish ones. This suggests that future research would do well to study whether the increasing globalization in the business world is promoting international or transnational cultures, remarkably, in multinational companies.
Finally, we suggest examining the relationships between organizational culture, the BSC, and gender as lines for future research. Our female surveyed managers feel that they need to be more careful (and avoid making mistakes) than their male counterparts. They also held that they are more personally accountable for the negative variations in the target KPIs.
Appendix - Survey Instrument
Adaptive cultures (Never= 1; Always=7)
Our company’s employees have a clear sense of mission that gives them direction and purpose for their work.
Our company invests in improving the knowledge and skills of employees.
Employees in our company are empowered to work across internal boundaries and collaborate with other departments.
Employees in our company are encouraged to take risks and apply innovative ideas.
We apply a clear and consistent set of values to govern the way we do business.
Non-adaptive cultures (Never= 1; Always=7)
People at our workplace feel they must avoid making mistakes.
People at our workplace tend to avoid challenging each other and work hard to keep relationships pleasant despite it affecting growth.
People at our workplace are rewarded for heavily outperforming each other.
Decision management (To a great extent= 1; To a little extent=7)
To what extent do you investigate the matters that cause the negative variation in your KPI’s target level?
To what extent do you change your activities when there is a negative variation in your target KPI?
To what extent do you trace the cause of the negative variation in the target KPI to the groups or individuals within the workplace?
To what extent does the target KPI enable you to be a better employee at your workplace?
Decision control (To a great extent= 1; To a little extent=7)
To what extent is meeting the target KPI of your workplace important for the persons who are responsible?
To what extent are you evaluated on the variations in the target KPI?
To what extent are you held personally accountable for the negative variations in the target KPI?
To what extent are you required to report actions taken to correct the negative variations in the target KPI?
BSC consciousness (Strongly agree= 1; Strongly disagree=7)
In general, I know what the target level of my KPI is.
I have good knowledge of my target KPI variations.
I make sure that those who work at my workplace know the target level of the KPI.
I am very confident of my ability to manage variations in the target KPI at my workplace.
I put a lot of effort into meeting the target KPI.
When I make decisions, I focus heavily on how it affects my target KPI.
I am very conscious of how the actions in my workplace influence overall targets and objectives of the company.
- Abernethy, M. A., & Vagnoni, E. (2004). Power, organization design and managerial behavior. *Accounting, Organizations and Society*, 29 (3-4), 207-225. https://doi.org/10.1016/S0361-3682(03)00049-7
- Alsharari, N., Dixon, R., & Youssef, M. (2015). Management accounting change: Critical review and a new contextual framework. *Journal of Accounting & Organizational Change*, 11 (4), 476-502. https://doi.org/10.1108/JAOC-05-2014-0030
- Armstrong, M. (2006). Human Resource Management Practice. London: Kogan Page limited.
- Başar, E., & Düzgün, A. (2016). Links of consciousness, perception, and memory by means of delta oscillations of brain. *Frontiers in Psychology*, 7 (article 217). https://doi.org/10.3389/fpsyg.2016.00275
- Bisbe, J., Batista-Foguet, J.M., & Chenhall, R. (2007). Defining management accounting constructs: A methodological note on the risks of conceptual misspecification. *Accounting, Organizations and Society*, 32(7-8), 789-820. https://doi.org/10.1016/j.aos.2006.09.010
- Bove, L., Pervan, S., Beatty, S., & Shiu, E. (2009). Service worker role in encouraging customer organizational citizenship behaviors. *Journal of Business Research*, 62 (7), 698-705. https://doi.org/10.1016/j.jbusres.2008.07.003
- Cameron, K. S., & Quinn, R. E. (1999). Diagnosing and Changing Organizational Culture: Based on the Competing Values Framework. Upper Saddle River, NJ: Prentice Hall.
- Carter, M., Armenakis, A., Feild, H., & Mossholder, K. (2013). Transformational leadership, relationship quality, and employee performance during continuous incremental organizational change. *Journal of Organizational Behavior*, 34 (7), 942-958. https://doi.org/10.1002/job.1824
- Chapman, C.S., & Kihn, L.A. (2009). Information system integration, enabling control and performance. *Accounting Organizations and Society*, 34, 151-169. https://doi.org/10.1016/j.aos.2008.07.003
- Chenhall, R. (2003). Management control systems design within its organizational context: findings from contingency-based research and directions. *Accounting Organizations and Society*, 28 (2-3), 127-168. https://doi.org/10.1016/S0361-3682(01)00027-7
- Collins, J. C. (2001). Good to Great: Why Some Companies Make the Leap\... and Others Don\'t. London: Random House.
- Cooke, R. A., & Rousseau, D. M. (1989). Organizational Culture Inventory. Plymouth: Human Synergistics.
- Costa-Oliveira, H., Lima-Rodrigues, L., & Craig, R. (2019). The presence of bureaucracy in the balanced scorecard. *Revista de Contabilidad*, 22(2), 218-224. https://doi.org/10.6018/rcsar.382271
- Costanza, D., Nikki, M., Severt, M., & De Costanza, R. (2016). The effect of adaptive organizational culture on long-term survival. *Journal of Business and Psychology*, 31 (3), 361-381. https://doi.org/10.1007/s10869-015-9420-y
- Cox, R., Issa, R., Ahrens, D. (2003). Management's perception of key performance indicators for construction. *Journal of Construction Engineering & Management*, 129 (2), 142-151. https://doi.org/10.1061/(ASCE)0733-9364(2003)129:2(142)
- Da Silva, A., Fernández-Feijoo, B., & Gago, S. (2020). Accounting information tools in managerial clinical service decision-making processes: Evidence from Portuguese public hospitals. *International Public Management Journal*, 23 (4), 535-563. https://doi.org/10.1080/10967494.2018.1495136
- Davis, S., & Albright, T. (2004). An investigation of the effect of balanced scorecard implementation on financial performance. *Management Accounting Research*, 15 (2), 135-153. https://doi.org/10.1016/j.mar.2003.11.001
- Deem, J.W., Barnes, B., Segal, S., & Preziosi, R. (2010). The relationship of organizational culture to balanced scorecard effectiveness, *SAM Advanced Management Journal*, 75 (4), 31-39.
- Denison, D. R. (1990). Corporate Culture and Organizational Effectiveness. New York: Willey.
- Dent, J. (1990). Strategy, organization and control: Some possibilities for accounting research. *Accounting, Organizations and Society*, 15 (1/2), 3-26. https://doi.org/10.1016/0361-3682(90)90010-R
- Doran, J., & Ryan, G. (2017). The role of stimulating employees\' creativity and idea generation in encouraging innovation behaviour in Irish firms. *Irish Journal of Management*, 36 (1), 32-48. https://doi.org/10.1515/ijm-2017-0005
- Dossi, A., & Patelli, L. (2010). You learn from what you measure: Financial and non-financial performance Measures in multinational companies. *Long Range Planning*, 43(4), 498-526. https://doi.org/10.1016/j.lrp.2010.01.002
- Erciyes, E. (2018). The fusion of national culture and organizational culture in international settings. *METU Studies in Development*, 45 (April), 1-23. Available at https://hdl.handle.net/11511/93222
- Farooq, A., & Hussain, Z. (2011). Balanced scorecard perspective on change and performance: A study of selected Indian companies. *Procedia - Social and Behavioral Sciences*, 24 (C), 754-68. https://doi.org/10.1016/j.sbspro.2011.09.043
- Flamholtz, E. (2001). Corporate culture and the bottom line. *European Management Journal*, 19 (3), 268-275. https://doi.org/10.1016/S0263-2373(01)00023-8
- Flamholtz, E., & Randle, Y. (2012). Corporate culture, business models, competitive advantage, strategic assets and the bottom line. *Journal of Human Resource Costing & Accounting*, 16 (2), 76-94. https://doi.org/10.1108/14013381211284227
- Gago, S., & Purdy, D. E. (2015). The effects of budgetary knowledge and extrinsic motivation on the importance that managers attribute to their budgets. *Spanish Journal of Finance and Accounting*, 44 (1), 47-71. https://doi.org/10.1080/02102412.2014.987446
- Gibbons, R., & Kaplan, R. S. (2015). Formal measures in informal management: Can a balanced scorecard change a culture? *The American Economic Review*, 105(5), 447-451. https://doi.org/10.1257/aer.p20151073
- Gupta, G., & Salter, S. (2018). The balanced scorecard beyond adoption. *Journal of International Accounting Research*, 17 (3), 115-134. https://doi.org/10.2308/jiar-52093
- Hall, M. (2016). Realising the richness of psychology theory in contingency-based management accounting research. *Management Accounting Research*, 31, 63-74. https://doi.org/10.1016/j.mar.2015.11.002
- Han, H. (2012). The relationship among corporate culture, strategic orientation, and financial performance. *Cornell Hospitality Quarterly*, 53 (3), 207-219. https://doi.org/10.1177/1938965512443505
- Heinicke, A., Guenther, T., & Widener, S. (2016). An examination of the relationship between the extent of a flexible culture and the levers of control system: The key role of beliefs control. *Management Accounting Research*, 33, 25-41. https://doi.org/10.1016/j.mar.2016.03.005
- Henri, J. (2006). Organizational culture and performance measurement systems. *Accounting, Organizations and Society*, 31 (1), 77-103. https://doi.org/10.1016/j.aos.2004.10.003
- Hulland, J. (1999). Use of partial least squares (PLS) in strategic management research: a review of four recent studies. *Strategic Management Journal,* 20, 195-204. https://doi.org/10.1002/(SICI)1097-0266(199902)20:2\<195::AID-SMJ13\>3.0.CO;2-7
- Ittner, C., Larcker, D., & Meyer, M. (2003). Subjectivity and the weighting of performance measures: Evidence from a balanced scorecard. *The Accounting Review*, 78 (3), 725-58. https://doi.org/10.2308/accr.2003.78.3.725
- Kaplan, R. S. (2006a). The Competitive advantage of management accounting. *Journal of Management Accounting Research*, 18(1), 127-135. https://doi.org/10.2308/JMAR.2006.18.1.127
- Kaplan, R. S. (2006b). How to implement a new strategy without disrupting your organization. *Strategic Direction*, 22(8), 100-109. https://doi.org/10.1108/sd.2006.05622had.002
- Kaplan, R. S. (2012). The balanced scorecard: comments on balanced scorecard commentaries. *Journal of Accounting & Organizational Change*, 8(4), 539-545. https://doi.org/10.1108/18325911211273527
- Kaplan, R. S., & Norton, D. P. (1992). The balanced scorecard: Measures that drive performance. *Harvard Business Review*, January-February, 71-79. Available at https://hbr.org/1992/01/the-balanced-scorecard-measures-that-drive-performance-2
- Kaplan, R. S, & Norton, D. P. (2000) Having trouble with your strategy? Then map it. *Harvard Business Review* 78, no. 5 (September-October 2000): 167-176. Available at https://hbr.org/2000/09/having-trouble-with-your-strategy-then-map-it
- Kaplan, R. S, & Norton, D. P. (2001,a). The strategy-focused organization. *Strategy & Leadership*, 29 (3), 41-42. https://doi.org/10.1007/BF03396637
- Kaplan, R. S., & Norton, D. P. (2001,b). Transforming the balanced scorecard from performance measurement to strategic management: Part II. *Accounting Horizons*, 15(2), 147-160. http://dx.doi.org/10.2308/acch.2001.15.1.87
- Kaplan, R. S., & Norton, D. P (2004). The strategy map: guide to aligning intangible assets. *Strategy & Leadership*, 32(5), 10-17. http://dx.doi.org/10.1108/10878570410699825
- Kaplan, R.S, & Norton, D.P. (2006). Response to S. Voelpel et al., \"The tyranny of the balanced scorecard in the innovation economy,\" Journal of Intellectual Capital, Vol. 7 No. 1, 2006, pp. 43-60. *Journal of Intellectual Capital*, 7(3), 421-428. https://doi.org/10.1108/14691930610681492
- Kotter, J. P., & Heskett, J. L. (1992). Corporate Culture and Performance. New York: Maxwell Macmillan International.
- Krajcsák, Z. (2018). Successes of quality management systems through self-evaluation and commitment in different organizational cultures. *Management Decision*, 56(7), 1,467-1,484. https://doi.org/10.1108/MD-09-2017-0870
- Kristof-Brown, A., Zimmerman, R. D., & John, E. C. (2005). Consequences of individuals\' fit at work: A meta-analysis of person-job, person-organization, person-group, and person-supervisor fit. *Personnel Psychology*, 58 (2), 281-342. https://doi.org/10.1111/j.1744-6570.2005.00672.x
- Levy, M., & Powell, P. (2000). Information systems strategy for small and medium sized enterprises: An organisational perspective. *Journal of Strategic Information Systems*, 9 (1), 63-84. https://doi.org/10.1016/S0963-8687(00)00028-7
- Libby, T., Salterio, A., & Webb, A. (2004). The balanced scorecard: The effects of assurance and process accountability on managerial judgment. *The Accounting Review*, 79 (4), 1,075-1,094 https://doi.org/10.2308/accr.2004.79.4.1075
- Lipe, M., & Salterio, S. (2000). The balanced scorecard: Judgmental effects of common and unique performance measures. *The Accounting Review*, 75 (3), 283-298. https://doi.org/10.2308/accr.2000.75.3.283
- Malmi, T. (2001). Balanced scorecards in Finnish companies: A research note. *Management Accounting Research*, Vol 12 (2), 207-220. https://doi.org/10.1006/mare.2000.0154
- Malmi, T., & Brown, D. A. (2008). Power, organization design and managerial behavior. *Management Accounting Research*, 29 (4), 287-300. https://doi.org/10.1016/j.mar.2008.09.003
- Malmi, T., Bedford, D., Brühl, R., Dergård, J., Hoozée, S., Janschek, O., Willert, J., Ax, C., Bednarek, P., Gosselin, M., Hanzlick, M., Israelsen, P., Johanson, D., Johanson, T., Madsen, D. Ø., Rohde, C., Sandelin, M., Strömsten, T., & Toldbod, T. (2020). Culture and management control interdependence: An analysis of control choices that complement the delegation of authority in Western cultural regions. *Accounting, Organizations and Society*, 86. https://doi.org/10.1016/j.aos.2020.101116
- Malgwi, A., & Dahiru, H. (2014). Balanced scorecard financial measurement of organizational performance: A review. *IOSR Journal of Economics and Finance (IOSR-JEF)*, 4 (6), 1-10. https://doi.org/10.9790/5933-0460110
- Malina, M., & Selto, F. (2001). Communicating and controlling strategy: An empirical study of the effectiveness of the balanced scorecard. *Journal of Management Accounting Research*, 13, 47-90. https://doi.org/10.2308/jmar.2001.13.1.47
- Marginson, D. (2009). Value systems as a mechanism for organizational change. *Journal of Accounting & Organizational Change*, 5 (1), 7-34. https://doi.org/10.1108/18325910910932197
- Mikes, A. (2009). Risk management and calculative cultures. *Management Accounting Research*, 20 (1), 18-40. https://doi.org/10.1016/j.mar.2008.10.005
- Mohamed, S. (2003). Adaptation of the balanced scorecard to measure organizational safety culture. *Journal of Construction Research*, 4(1), 45-57. https://doi.org/10.1142/S1609945103000285
- Nørreklit, H. (2000), The balance on the balanced scorecard - a critical analysis of some of its assumptions. *Management Accounting Research*, 11(1), 65-88. https://doi.org/10.1006/mare.1999.0121
- Nunnally, J. C. (1978). Psychometric Theory. New York: McGraw Hill.
- Otley, D. (2016). The contingency theory of management accounting and control: 1980-2014. *Management Accounting Research*, 31, 45-62. https://doi.org/10.1016/j.mar.2016.02.001
- Ouchi, W. (1979). A conceptual framework for the design of organizational control mechanisms. *Management Science*, 25 (9), 833-848. https://doi.org/10.1007/978-1-4899-7138-8\_4
- Park, H., Ribière, V., & Schulte Jr, W. D. (2004). Critical attributes of organizational culture that promote knowledge management technology implementation success. *Journal of Knowledge Management*, 8 (3), 106-117. https://doi.org/10.1108/13673270410541079.
- Pérez Granero, L., Guillén, M., & Banón-Gomis, A. (2017). Influencia de los factores de contingencia en el desarrollo del cuadro de mando integral y su asociación con un rendimiento mejor. El caso de las empresas españolas. *Revista de Contabilidad - Spanish Accounting Review* 20, 82-94. https://doi.org/10.1016/j.rcsar.2016.07.002
- Pérez-López, M.C., Gómez-Miranda, M. E., Argente-Linares, E., & López-Sánchez, L. (2018). The internationalisation of Spanish family firms through business groups: Factors affecting the profitability, and the moderating effect of the family nature of the Spanish business. *Revista de Contabilidad - Spanish Accounting Review*, 21 (1), 82-90. https://doi.org/10.1016/j.rcsar.2017.09.002
- Pitkänen, H., & Lukka, K. (2011). Three dimensions of formal and informal feedback in management accounting. *Management Accounting Research*, 22 (2), 125-137. https://doi.org/10.1016/j.mar.2010.10.004
- Rautiainen, A., Urquía-Grande, E., & Muñoz-Colomina, C. (2017). Institutional logics in police performance indicator development: A comparative case study of Spain and Finland, *European Accounting Review*, 26 (2), 165-191. https://doi.org/10.1080/09638180.2015.1120412
- Roi, R. C. (2006). Leadership, Corporate Culture and Financial Performance. San Francisco: The Faculty of the School of Education.
- Schein, E. (1988). La Cultura Empresarial y el Liderazgo. Una Visión dinámica. Barcelona: Plaza & Janes Editores S.A
- Sebastián, M. (2016). Consciousness and theory of mind: a common theory? *Theoria*, 31(1), 73-89. https://doi.org/10.1387/theoria.14091
- Shields, M. D., & Young, S. M. (1994). Managing innovation costs: A study of cost conscious behavior by R&D professionals. *Journal of Management Accounting Research*, 6 (Fall), 175-196. https://doi.org/10.1007/978-3-8350-5471-4\_38
- Simons, R., (2000). Performance Measurement and Control Systems for Implementing Strategy. Upper Saddle River (NJ): Prentice Hall.
- Stede, W A., Van der, Chow, C. W, & Lin, T. W. (2006). Strategy, choice of performance measures, and performance*. Behavioral Research in Accounting*, 18(1), 185-205. https://doi.org/10.2308/bria.2006.18.1.185
- Swieringa, R. J., & Moncur, R. H. (1972). The relationship between managers' budget related behavior and selected attitude, position, size and performance measures. *Journal of Accounting Review*, 10 (Supplement), pp. 194-209. https://doi.org/10.2307/2489874
- Tsang, A., Jardine, A., & Kolodny, H. (1999). Measuring maintenance performance: a holistic approach. International. *Journal of Operations & Production Management*, 19 (7), 691-715. https://doi.org/10.1108/01443579910271674
- Tseng, S. (2010). The correlation between organizational culture and knowledge conversion on corporate performance. *Journal of Knowledge Management*, 14 (2), 269-284. https://doi.org/10.1108/13673271011032409
- Urquía-Grande, E.; Lorain, M.A., Rautiainen, A., & Cano-Montero, E. (2021). Balance with logic-measuring the performance and sustainable development efforts of an NPO in rural Ethiopia. *Evaluation and Program Planning*, 87, 101944. https://doi.org/10.1016/j.evalprogplan.2021.101944
- Velasquez, S., Suomala, P., & Järvenpää, M. (2015). Cost consciousness: Conceptual development from a management accounting perspective. *Qualitative Research in Accounting & Management*, 12 (1), 55-86. https://doi.org/10.1108/QRAM-07-2013-0029
- Verdu-Jover, A., Alos-Simo, L., & Gomez-Gras. J. (2018). Adaptive culture and product/service innovation outcomes. *European Management Journal*, 36 (3), 330-340. https://doi.org/10.1016/j.emj.2017.07.004
- Vieira, R., O'Dwyer, B., & Schneider, R. (2017). Aligning strategy and performance management system: the case of wind-farm industry. *Organization and Environment*, 30 (1), 3-26. https://doi.org/10.1177/1086026615623058
- Voelpel, S., Leibold, M., Eckhoff, R. & Davenport, T. (2006). The tyranny of the balanced scorecard in the innovation economy. *Journal of Intellectual Capital*, 7(1), 43-58. https://doi.org/10.1108/14691930610639769
- Wiersma, E. (2009). For which purposes do managers use balanced scorecards?: An empirical study. *Management Accounting Research*, 20 (4), 239-251. https://doi.org/10.1016/j.mar.2009.06.001
- Wong-On-Wing, B., Guo, L., Li, W., & Yang, D. (2007). Reducing conflict in balanced scorecard evaluations. *Accounting, Organizations and Society*, 32 (4), 363-377. https://doi.org/10.1016/j.aos.2006.05.001
- Yates, J., & De Oliveira, S. (2016). Culture and decision making. *Organizational Behavior and Human Decision Processes*, 136), 106-118. https://doi.org/10.1016/j.obhdp.2016.05.003
- Yesil, S., & Kaya, A. (2013). The effect of organizational culture on firm financial performance: Evidence from a developing country. *Procedia - Social and Behavioral Sciences*, 81 (C). pp. 428-437. https://doi.org/10.1016/j.sbspro.2013.06.455
- Zheng, W., Yang, B., & Mclean, G. (2010). Linking organizational culture, structure, strategy, and organizational effectiveness: Mediating role of knowledge management. *Journal of Business Research*, 63 (7), 763-771. https://doi.org/10.1016/j.jbusres.2009.06.005
- Zimmerman, J. L. (2011). Accounting for Decision Making and Control. New York: McGraw-Hill Irwin.
Prior literature regards culture as an important part of organizational effectiveness and success but their findings are inconclusive (Flamholtz, 2001; Han, 2012; Kristof-Brown et al., 2005; Yesil & Kaya, 2013). For instance, Pérez-López et al. (2018) also indicate that some of the features that characterize an organizational culture, and depend on the degree of decentralization in decision-making, influence profitability in small firms.↩
Incompatibility with the dominant culture may be a partial explanation for the reported disagreements and conflicts when using the BSC to evaluate performance (e.g., Ittner et al., 2003; Malina & Selto, 2001; Wong-On-Wing et al., 2007). They may also explain the difficulties in strategic learning due to focusing on performance (Wong-On-Wing et al., 2007) or negative reactions from subjects regarding its control (Levy & Powell, 2000). Another possible explanation for these conflicts may be that the dominant culture is compatible with the BSC but clashes with rival subcultures in the organization (Dent, 1990) or with rival clans (Ouchi, 1979). In addition, the uses of the BSC are influenced not only by the way in which the organization intends to apply the BSC but also by the opinions of other users, which lead to varying degrees of pressure to use the scorecard (Wiersma, 2009).↩
We derive this definition from the psychological (Başar & Düzgün, 2016; Velasquez et al., 2015).↩
These authors address that the median sample size in management accounting studies is 125.↩
Prior literature states that local nationalities are susceptible to the influence of organizational culture and the BSC usages (e.g. Rautiainen et al., 2017). This suggests that, for instance, Estonian and Spaniard managers might respond differently our survey. However, we note that managers only respond differently to the question about meeting KPI targets. This lack of differentiation in responses may be due to the fact that subsample sizes of Estonian and Spanish are too small, or also because the increasing globalization in the business world is promoting a cultural homogenization, or, what authors like Erciyes (2018) define as international cultures.↩
The perceptions of KPIs vary with the number of years of experience. Thus, experienced managers consider a wider number of KPIs as they are not solely focused on those KPIs that directly influence their work (as happens with novices), developing a more corporate-level approach (Cox et al., 2003). In this survey we focus on KPI consciousness instead of BSC consciousness considering this issue.↩
When management accounting researchers seek to test theory and try to obtain from respondents as much information as possible it is common to increase questionnaire’s length (Van der Stede et al., 2006).↩
Following the recommendation of Abernethy & Vagnoni (2004), we changed the scale between questions 17 to 19 and 20 to 23 to avoid acquiescence error. This means that the first three questions of these constructs have the highest possible degree of agreement to a statement on the left side of the scale, whereas the last four have it on the right side.↩
We also assess discriminant validity (Bove et al., 2009).↩
As additional checks, Table 5, Panel B displays the results of the PLS only with those responses with outer loadings up to 0.70 and in Table 5, Panel C with only the construct for adaptive cultures and responses with outer loadings up to 0.70. Both sets of results confirm the validity of our research proposals 1a, 1b, and 2.↩
We acknowledge financial contribution from the The Community of Madrid, and the European Social Fund (S2015/HUM-34).
The authors declare no conflict of interests.