Foreign versus local control of Spanish private subsidiaries and modified audit opinions
ABSTRACT
This paper studies the relation between foreign control and the likelihood of receiving modified audit opinions (MAOs) by private subsidiaries. To further analyze this relation, we partition MAOs based on their underlying reason: GAAP violations; opacity; and uncertainties, including going concern (GCUs) and other (non-GCUs). We observe a significantly greater incidence of MAOs in subsidiaries owned by foreign groups than in those with a local parent company. This result is mainly driven by opacity related MAOs. The evidence of a higher incidence of GAAP violation and non-GCU related MAOs in foreign owned subsidiaries is inconclusive; and MAOs related to GCUs are significantly less frequent in subsidiaries of foreign groups. In contrast to the results found in the public setting, our findings suggest that foreign control in the private setting is associated with more opaque companies. This study contributes to a better understanding of the effects of foreign direct investment (FDI) in the host-country, at the company level.
Keywords: Foreign control; Private subsidiaries; Modified audit opinion (MAO); Reasons for MAOs.
JEL classification: F23; M41; M48.
Control extranjero versus local de subsidiarias privadas españolas y opiniones de auditoria modificadas
RESUMEN
En este trabajo se estudia la relación entre el control extranjero y la probabilidad de recibir opiniones de auditoria modificadas (OAMs) en una muestra de subsidiarias españolas no cotizadas. Además, para analizar con mayor detalle esta relación, clasificamos las OAMs en cuatro tipos, en función de la razón que subyace a la modificación: violación de principios y normas contables; opacidad; incertidumbres por gestión continuada (GCUs); y otras incertidumbres (non-GCUs). Se observa una incidencia significativamente mayor de OAMs en subsidiarias de grupos extranjeros que en las de grupos locales. Este resultado se deriva fundamentalmente de las modificaciones de opinión relacionadas con la falta de transparencia (opacidad). La evidencia de una mayor incidencia de modificaciones por violación de principios contables e incertidumbres distintas de la gestión continuada en subsidiarias con control extranjero es poco concluyente; y las modificaciones por gestión continuada son significativamente menos frecuentes en las subsidiarias de grupos extranjeros. A diferencia de los resultados en el contexto de la empresa cotizada, nuestros resultados sugieren que el control extranjero en la empresa no cotizada está asociado a empresas más opacas. Este trabajo contribuye a una mayor comprensión de los efectos de la inversión directa extranjera (FDI) en las empresas del país receptor.
Palabras clave: Control extranjero; Filiales privadas; Opinión de auditoría modificada (OAM); Motivos de las OAM.
Códigos JEL: F23; M41; M48.
1. Introduction
Foreign Direct Investment (FDI) has become an increasingly important factor for economic growth (e.g.: Alfaro et al., 2004; Xu, 2000). Accordingly, there is great interest in studying its determinants and economic effects. This paper relates to the latter. In particular, we look at the association of foreign control and the quality of the company’s financial reporting.
Financial reporting is not only shaped by the accounting standards applied, which FDI cannot affect, but also by several institutional, economic, political and cultural features that go beyond regulation (Ball, 2006). Indeed, MNCs generally impose their own company policies, internal reporting systems and principles of information disclosure on acquired enterprises (OECD, 2002, p. 18). This way, FDI might influence financial reporting of local companies.
How FDI may affect the quality of the local firms’ financial reporting is not clear a priori. FDI diffuses specific assets of multinational corporations (MNCs) such as corporate governance mechanisms (Kimura & Kiyota, 2007). The improvement of the corporate governance mechanisms has been analyzed as one potential benefit of FDI for the host country companies (e.g.: Carati & Alireza, 2000; Child et al., 2000; Meyer & Sinani, 2009). In this regard, given that financial reporting control and monitoring is one important output of corporate governance (Cohen et al., 2004, p. 87), improvements in the quality of financial reporting could be also expected from FDI.
However, the scarce literature on financial reporting in MNCs provides evidence that the parent companies use their foreign subsidiaries to manipulate earnings. So far, the scarce studies analyzing financial reporting quality at the subsidiary level suggest that the quality of accounting information in foreign owned subsidiaries is poorer than in their locally owned counterparts. Beuselinck et al. (2019) find that the MNCs’ income increasing incentives drive the accrual manipulation practices at the subsidiary level; and Gill-de-Albornoz and Rusanescu (2018) show that the magnitude of discretionary accruals (DAC) is significantly higher in Spanish private companies that are subsidiaries of foreign groups than in those owned by local groups. This paper builds on this research, by looking at the subsidiaries reporting quality from the auditor’s perspective.1 In particular, we investigate the association between foreign (versus local) control and the auditor's opinion.
Financial reporting quality is a multidimensional construct (Dechow et al., 2010). The auditor’s opinion allows considering dimensions different from that investigated in prior studies, namely earnings management done through accruals manipulation. Unlike accruals-based measures of earnings quality, which literature suggests that mainly reflect earnings management practices that are allowed by accounting regulation (DeFond & Zhang, 2014), the auditor issues a modified audit opinion (MAO) when they detect more extreme departures from GAAP (Chen et al., 2016). Moreover, MAOs could also be issued for reasons that relate to other dimensions of reporting quality, different from earnings management, like limitations of scope or omitted information. Additionally, some MAOs are issued for reasons not necessarily related to the quality of the company’s financial reporting, like uncertainties. We examine different dimensions of financial reporting by classifying MAOs according to their underlying reason.
Firstly, we address the research question of whether the type of controlling shareholder, local or foreign, relates to the probability of receiving MAOs. Prior research provides two arguments that lead to predict a higher incidence of MAOs in foreign- than in locally-owned subsidiaries. The first argument relies on the idea that MAOs are a signal of poor financial reporting quality, because, as argued in prior studies (Chen et al., 2016; Choi & Jeter, 1992; Karjalainen, 2011), ‘unclean’ audit opinions are issued when the auditor finds evidence that the financial statements do not fully comply with GAAP. Since both MAOs and DAC indicate poor reporting quality, some studies suggest that higher DAC should be associated with a higher probability of receiving MAOs (e.g.: Bartov et al., 2001). If this is the case, given the documented higher magnitude of DAC in subsidiaries of foreign groups, foreign shareholding is expected to be positively related to the probability of receiving MAOs. The second argument is based on the evidence that the debt contracting related incentives to avoid the negative consequences of MAOs are lower for subsidiaries of foreign groups, because of their lower dependence on external financing (Desai et al., 2008; Nguyen & Rugman, 2015).
Next, we extend the analysis by considering the underlying reasons of MAOs, which are classified into three categories: (1) infringements of accounting standards (thereafter, GAAP violations); (2) lack of transparency (thereafter, opacity); and (3) uncertainties, including going concerns (GCUs) and other uncertainties (non-GCUs). This classification of MAOs leads to rethink the arguments used to support the expected association between foreign control and the likelihood of receiving a modified report. On the one hand, because, as noted above, not all the types of MAOs indicate accruals earnings management. If any, only GAAP violations might relate to accruals-based earnings management. And, on the other hand, because the company cannot similarly avoid all the types of MAOs. A priori, as a result of the firm-auditor negotiations the firm could take actions to avoid MAOs related to reasons (1) and (2), but this is not the case of uncertainty related MAOs, which derive from circumstances that the company cannot control in the negotiation process with the auditor. Additionally, companies might prefer avoiding one type of MAOs over others because they may not be equally costly to avoid and/or their consequences might not be perceived as similar (Chen et al., 2016).
For uncertainty related MAOs, the predictions are based on the different incidence of the circumstances that lead to these modifications in foreign- and locally-owned companies. Foreign group subsidiaries are expected to receive less GCU related MAOs because of their lower bankruptcy risk associated with a greater reliance on intra-group loans (Gopalan et al., 2007). In turn, non-GCU related MAOs are expected to be more frequent in subsidiaries with foreign control because most of them refer to tax inspections, which have been related to aggressive financial reporting (Frank et al., 2009).
The tests carried out are based on a unique sample of 2,081 private Spanish subsidiaries over the period 1997-2013. This allows holding constant the regulatory environment and the accounting and auditing standards of the host-country, ensuring that our inferences are not explained by cross-country differences in institutional environments or financial reporting and auditing regulation and practices. Spain ranks among the countries that receive the most FDI in the world. Between 2011 and 2012, the worldwide flow of FDI saw an 18% decrease, while Spain sustained a growth of almost 3.5% and received nearly $28 billion in 2012. This ranked Spain in 14th place on the world's list of FDI received, and 4th in the European Union (ICEX, 2014). In 2017, Spain was still the 14th country in the world and the 7th in the European Union (EU) as per FDI inflows (Central Intelligence Agency (CIA), 2019). In addition, private companies predominate in most economies (Berzins et al., 2008) and they are the main recipients of FDI (European Central Bank (ECB), 2013, p. 66). Despite this, the private setting has been little investigated, mainly because of the shortage of data (Hope & Vyas, 2017). Similar to other European countries, the Spanish setting has the advantage of data availability because private companies are required to file their financial statements with a public registry and external audits are mandatory for large enough companies. Moreover, Spain is one of the few countries where the audit report of the external auditor is readily available for a large number of private companies and for a long period of time.
The results show that, after controlling for other company and auditor characteristics, the presence of a foreign (vs. a local) controlling shareholder is associated with a higher incidence of MAOs. A company controlled by a group whose parent company is located abroad has a probability of receiving MAOs between 60 and 80 percent higher than a similar company controlled by a local group. Additionally, we find that the association differs depending on the underlying reason for modification. In particular, the opacity related MAOs (i.e. for omitted information and/or scope limitations) are between 141 and 232 percent more likely to be received by foreign than local group subsidiaries. In contrast, the probability of having a GAAP violation related MAO is only marginally higher in foreign than in local group subsidiaries, and this result is not confirmed by additional tests. This finding contrasts with Gill-de-Albornoz and Rusanescu (2018), who show that earnings management, as measured by DAC, is more prevalent in foreign-owned private Spanish subsidiaries. Jointly, such research and ours suggest that GAAP violations reported by auditors and DAC capture different dimensions of financial reporting quality (e.g.: DeFond & Zhang, 2014; Healy, 1985). Finally, as regards the uncertainty related MAOs, which do not proxy for reporting quality, we find a lower (higher) incidence of GCU (non-GCU) related MAOs if the parent company is foreign. This also confirms our expectations.
The findings are robust to alternative estimation procedures; in different subsamples, after imposing several restrictions; and to the inclusion of a large number of covariates. To alleviate endogeneity concerns, an additional analysis in changes, focused on a sample of takeovers, confirms that subsidiaries of local groups become more opaque after being acquired by a foreign group.
This research makes several contributions to the literature. First, it adds to the literature concerned with the determinants of reporting quality in the scarcely explored setting of private companies (Ball & Shivakumar, 2005; Burgstahler et al., 2006; Hope et al., 2013, 2011). Second, it extends the scant research on financial reporting quality in multinational groups. By looking at financial reporting quality from the auditor’s perspective, we examine dimensions of financial reporting quality different from accrual-based earnings management, which is the main focus of prior research on this topic (e.g., Beuselinck et al., 2019). At the same time, this paper contributes to the literature that connects MAOs with financial reporting quality (e.g.: Bradshaw et al., 2001; Butler et al., 2004). Third, looking at the specific reasons giving rise to MAOs allows adding to the research on corporate transparency (Bhattacharya et al., 2003; Bushman et al., 2004). Results indicate that the higher incidence of modified reports in companies owned by foreign groups is driven by their lack of transparency. Therefore, in privately held companies foreign investors are not associated with increased corporate transparency as documented in public companies (e.g.: Jiang & Kim, 2004; Kang & Stulz, 1997). Overall, this study contributes to a better understanding of the effects of FDI in the host-country at the company level. As far as accounting quality is concerned, foreign control in the private setting seems to foster opacity.
2. Institutional background: Audit regulation in Spain
2.1. Historical review
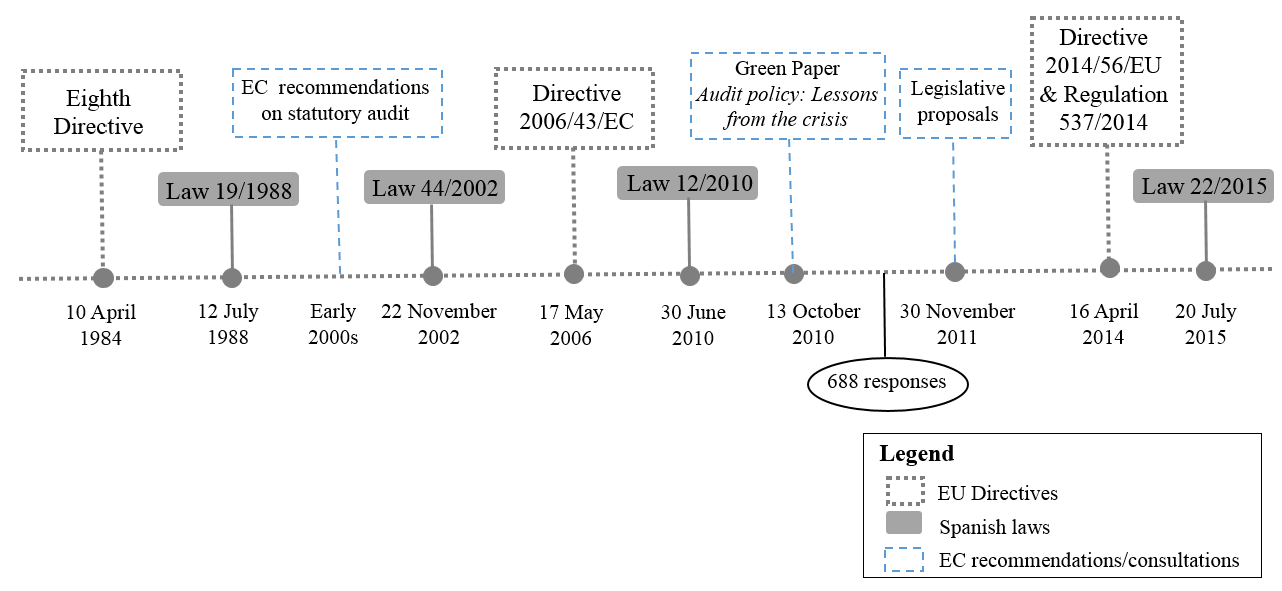
As illustrated in Figure 1, the Spanish audit regulation runs parallel to that of the EU. The first milestone is represented by the Eighth Directive, implemented in the Law 19/1988, which made audits compulsory for medium and large companies. The financial scandals in the late 1990s and early 2000s raised concerns about auditor independence and audit quality and prompted regulatory authorities to introduce substantial changes in the audit regulation. The European Commission (EC) issued several recommendations, which Spain incorporated in the Law 44/2002. A few years later, the EU amended the Eighth Directive with the enactment of the Directive 2006/43/EC. Spain adapted to the 2006 Directive by promulgating the Law 12/2010. At the same time, in the aftermath of the financial crisis, the EU started a new reform of its audit market (EC, 2010). The outcomes of this process were the Directive 2014/56/EU and the Regulation 537/2014. The last amendment of the Spanish audit regulation is the Law 22/2015, which incorporates the provisions of this reform. This last reform does not affect the analyses carried out in this paper, since the sample period ends in 2013.
Figure 1. Historical view of audit regulation in the EU and Spain
Therefore, although national auditing standards are set up at the country level, within the EU, auditing rules are generally in line with the International Standards on Auditing (ISAs) (Fédération des Experts Comptables Européens (FEE), 1998) and the content and structure of the audit reports are also similar (Fédération des Experts Comptables Européens (FEE), 2000).
2.2. The auditor’s opinion
The auditor issues: (1) a qualified opinion when they find any aspect which does not comply with GAAP; (2) an adverse opinion, when they consider that the financial statements are materially misstated or false and, taken as a whole, not in line with GAAP; (3) a disclaimer of opinion, when they are unable to perform their work and cannot issue an opinion on the financial statements; and (4) a clean opinion, otherwise.
We define MAO as any opinion that is not clean (i.e. qualified, adverse, or disclaimer of opinion). According to the 1991 Technical Auditing Standards (TAS) (ICAC, 1991), the main reasons for issuing a modified audit report are: misstatements, which relate to infringements of accounting principles or recognition and measurement rules (i.e. GAAP violations) or to the omission of information; scope limitations, which indicate that the auditor was prevented from obtaining sufficient audit evidence; uncertainties (including GCUs), which refer to circumstances where the auditor is unable to form an opinion on the outcome of future events; and lack of uniformity, which indicates that the financial statements are not comparable over time.2
The 1991 TAS established that the reasons for modification must be explained in the basis for modification paragraph/s, except for the lack of uniformity that was mentioned in the opinion paragraph. The TAS were modified in 2010, and two main changes were introduced: the lack of uniformity disappeared as a reason for modification; and significant uncertainties are no longer reasons for modification, but they should be mentioned in an emphasis-of-matter paragraph.3
3. Related literature and hypotheses development
3.1. Foreign ownership and MAOs
Literature provides two main arguments that lead to predict a higher probability of receiving a modified audit report in private foreign-owned subsidiaries than in their locally-owned counterparts. The first argument rests on the idea that MAOs are prima-facie evidence of poor financial reporting quality. Since auditing is expected to limit earnings management, some studies have investigated the link between earnings management proxies and the likelihood of receiving MAOs (e.g.: Francis & Krishnan, 1999; Bartov et al., 2001; Bradshaw et al., 2001; Butler et al., 2004; Tsipouridou & Spathis, 2014). Additionally, research concerned with reporting quality in multinational groups (Beuselinck et al., 2019; Gill-de-Albornoz & Rusanescu, 2018) shows that foreign controlling shareholders are associated with higher accruals manipulation. Therefore, to the extent that MAOs capture earnings management, a higher frequency of MAOs should be observed in foreign group subsidiaries.
The second argument builds on the fact that receiving modified audit reports has negative consequences, which have been extensively reported in listed firms (Chen et al., 2000; Guiral-Contreras et al., 2007), but also concern private companies, mainly as regards the terms of debt contracting (Dedman et al., 2014; Karjalainen, 2011). The literature also suggests that there are settings where the consequences of MAOs are less severe, or where avoiding MAOs could be costlier than receiving them (Chen et al., 2001; Chen et al., 2016). Particularly, the companies’ incentives to avoid MAOs are contingent upon their dependence on external financing, since MAOs’ negative consequences are limited when companies are able to get funds from sources other than the market or banks (Chen et al., 2016). Subsidiaries are an example where bank monitoring might become of second order importance because they might be funded with intra-group loans (Dewaelheyns & Van Hulle, 2010). This is especially the case of subsidiaries owned by foreign groups, which are documented to be more financially dependent on the parent and other related parties than subsidiaries of local groups (Desai et al., 2008; Nguyen & Rugman, 2015).4 Since local group subsidiaries rely more on bank loans, they should be more prone to accepting the auditor’s modifications and recommendations in order to avoid receiving MAOs. In contrast, companies under foreign control might care less about having MAOs given their lower dependence on bank financing.
In sum, either because MAOs reflect earnings management practices or because of the lower incentives of foreign group subsidiaries to avoid them, the prediction is that MAOs are more frequent in foreign-owned subsidiaries. Thus, the hypothesis to test is the following:
H1: Subsidiaries of foreign groups are more likely to receive MAOs than subsidiaries of local groups.
3.2. Foreign ownership and the reasons for MAOs
Considering the underlying reasons for modification, MAOs are classified into: (1) GAAP violations; (2) lack of transparency (or opacity), which are due to the omission of information or scope limitations; and (3) uncertainties, either for going concern or other issues, like tax inspections. Therefore, the hypothesis stated in the previous section can be disaggregated into four. However, recent research shows that both the economic effects and the determinants of MAOs vary with the type of MAO (e.g., Chen et al., 2016). Therefore, the arguments posed to justify the prediction of a higher incidence of MAOs if the controlling shareholding is foreign should be put into context when considering each reason for modification.
The findings of prior research indicating that foreign group subsidiaries manipulate earnings more than locally-owned subsidiaries (Gill de Albornoz & Rusanescu, 2018) would be consistent with a higher frequency of MAOs that indicate earnings management in foreign owned subsidiaries. If any, these are the GAAP violation related MAOs. However, it is entirely possible that even this type of MAOs does not capture the same dimension of reporting quality as DAC. This would be the case if, as pointed out by DeFond and Zhang (2014), DAC mainly capture ‘within GAAP’ earnings manipulation, which auditors do not have to report. Thus, on condition that they signal accrual manipulation, the prediction is that foreign-owned subsidiaries are more prone to receiving GAAP violation related MAOs.
The argument based on the lower incentives of foreign-owned subsidiaries to avoid MAOs is only valid for the modifications that companies can potentially avoid as a consequence of the negotiation process with the auditor. This is the case of GAAP violation and opacity related MAOs. The company could have made the adjustments or provided the information required by the auditor in order to avoid these MAOs (McCracken et al., 2008). Thus, the lower incentives of foreign group subsidiaries to avoid MAOs lead to predict a higher frequency of GAAP violation and opacity related MAOs in these firms.
According to the discussion above, our hypotheses regarding reasons (1) and (2) are stated as follows:
H1a: Subsidiaries of foreign groups are more likely to receive GAAP violation related MAOs than subsidiaries of local groups.
H1b: Subsidiaries of foreign groups are more likely to receive opacity related MAOs than subsidiaries of local groups.
As opposed to GAAP violation or opacity related MAOs, and assuming that auditor independence is orthogonal to the type of MAO, it is unlikely that the auditor-client negotiation process could change the circumstances that give rise to uncertainty related MAOs, since they are beyond the company’s control. Thus, in this case, the predictions should be based on the different incidence of the circumstances that lead to these modifications in foreign- and locally-owned companies. Regarding GCU related MAOs, our prediction derives from the fact that foreign group subsidiaries rely more on intra-group loans and less on bank financing than locally-owned subsidiaries (Desai et al., 2008; Nguyen & Rugman, 2015) and the dependence on intra-group financing relates to lower bankruptcy probability (Gopalan et al., 2007). Therefore, subsidiaries of foreign groups are expected to receive less GCUs than their locally-owned counterparts. We state the following hypothesis:
H1c: Subsidiaries of foreign groups are less likely to receive GCU related MAOs than subsidiaries of local groups.
Finally, non-GCU related MAOs highlight events whose future outcome cannot be predicted and might impact on the realization of assets, or the sufficiency of provisions for liabilities. Although this type of MAOs does not indicate poor reporting quality, it signals that assets might be overvalued and/or liabilities undervalued. Specifically, most of non-GCUs in our sample refer to ongoing tax inspections. Since their aftermath cannot be foreseen, companies generally do not recognize any provisions until the end of the tax investigation, which in many cases extend over multiple years. Therefore, it is likely that companies with non-GCUs related to tax inspections should report higher liabilities and lower earnings because they might be engaging in aggressive tax reporting. Prior research shows that aggressive tax reporting is positively linked to aggressive financial reporting (Frank et al., 2009), and the latter has been associated with foreign controlling shareholding (Beuselinck et al., 2019; Gill-de-Albornoz & Rusanescu, 2018). This leads to predict a higher frequency of non-GCU related MAOs in subsidiaries of foreign groups. Therefore, the last hypothesis states as follows:
H1d: Subsidiaries of foreign groups are more likely to receive non-GCU related MAOs than subsidiaries of local groups.
4. Sample
The sample consists of observations belonging to 2,081 non-financial private Spanish subsidiaries with mandatory audits during the period 1997-2013. A subsidiary is defined as a company controlled by another company (the parent company) that holds, directly or indirectly, at least 50.01 percent of the voting rights.
The main source of data is the SABI database.5 The sample selection process started with the identification of all the non-financial private subsidiaries that presented full financial statements in 2011,6 and thus audit their accounts mandatorily. We do not consider voluntary audits since the incentives of avoiding MAOs in this case would be different.7
SABI provides only the most recent information available on the firms' ownership structure. At the time of the sample selection, 2011 was the year with available information. We manually gathered and completed, backward and forward, the information on each subsidiary’s controlling shareholder/s. In particular, we used FACTIVA8 and checked both the group’s and the subsidiary’s corporate websites to identify any control change within the period 1997-2013. We assume that a company belongs to a specific group from the date when that group's parent company became its controlling shareholder and until: (1) the date when a new group gained control; (2) the date when it became a stand-alone company (i.e. not a subsidiary); or (3) 2013, if no subsequent takeover was identified.
We discarded the observations where control is exerted by financial and institutional investors because these entities do not consolidate their invested companies’ accounts. Each controlling group was classified as local or foreign according to the country of origin of the parent company. We also hand-collected information on the listing status of the parent companies during the entire sample period. The auditing and financial data to conduct the empirical tests were obtained from SABI.
The sample selection process is synthesized in Table 1. The initial unbalanced panel consists of 24,073 observations with the name of the auditor and the type of audit opinion.9 In 792 observations the text of the basis for modification paragraphs was missing or incomplete. Also, 3,423 observations were lost because of missing financial data, resulting in a final sample of 19,858 firm-year observations. In 4,431 of these observations the audit opinion is qualified, in 43 adverse, and 36 observations have a disclaimer of opinion. Additionally, as explained in section 2.2., after 2010, the clean reports containing emphasis-of-matter paragraphs related to uncertainties would have been modified reports according to the 1991 TAS. Thus, for the sake of consistency over the entire sample period, we identified the clean reports issued from 2010 onwards with emphasis-of-matter paragraphs mentioning uncertainties and considered them as modified reports (441 observations). This definition of MAO is consistent with previous research, which also refers to clean reports with emphasis-of-matter paragraphs (e.g.: Chan et al., 2006; Chen et al., 2000; Ratzinger-Sakel, 2013). In sum, 4,951 (25 percent) of the final sample observations have MAOs.
SABI codifies the type of opinion but does not provide the opinion paragraph, so the type of MAOs issued because of lack of uniformity before 2010 could not be included in the sample. Nonetheless, the lack of uniformity reason for modification disappeared after 2010.10
Table 1. Sample selection process
| N | |
|---|---|
| Obs. with available auditing data | 24,073 |
| Less: Obs. with MAOs and unavailable or incomplete text of the basis for modification paragraph/s | (792) |
| Less: Obs. without all the required financial information | (3,423) |
| Final sample: | 19,858 |
| 14,907 |
| 4,951 |
| 4,431 |
| 441 |
| 43 |
| 36 |
We read the basis for modification paragraph/s of each modified report to identify the reason/s for modification, and classify them into one of the three categories described in section 2.2. The descriptive statistics are shown in Table 2, which presents the number of modified reports containing at least one reason for modification of the corresponding type, as well as the percentage over the number of reports in the sample containing MAOs (N = 4,951). For the sake of clarity, it should be noticed that some reports contain more than one reason for modification, so that the numbers in Table 2 are not disaggregated totals. In particular, we identified 3,975 reports with one reason for modification; 848 with two; 109 with three; 16 with four; and two and one reports with five and six alluded reasons respectively. Therefore, we identified a total of 6,078 individual reasons for modification in the 4,951 modified reports.
Table 2. Reasons for issuing MAOs
| Reasons for modification | No. of reports | % of total modified reports |
|---|---|---|
| A. Misstatements | 2,807 | 56.7% |
| A.1. GAAP violations | 1,314 | 26.5% |
| A.2. Omitted information | 1,594 | 32.2% |
| B. Scope limitations | 1,384 | 28.0% |
| C. Uncertainties | 1,268 | 25.6% |
| C.1. Going concern (GCUs) | 497 | 10.0% |
| C.2. Other (non-GCUs) | 796 | 16.1% |
| Opacity (omitted information and/or scope limitations) | 2,855 | 57.7% |
This table presents the number of modified reports containing at least one reason for modification of the corresponding type, as well as the percentage that these observations represent over the total MAOs sample (N = 4,951). Notice that some reports contain several reasons for modification, and this is why the numbers in the table are not disaggregated totals.
Nearly 57 percent of the modified reports contain at least one misstatement, being omissions of information (found in 32.2 percent of the reports) more frequent than GAAP violations (found in 26.5 percent of the reports). Scope limitations are mentioned in 1,384 reports (28 percent). Finally, 1,268 reports (25.6 percent) mention at least one uncertainty, where going concern modifications are found in 497 reports, and 796 reports inform about other uncertainties. Overall, the in-depth content analysis of the modified reports reveals that the majority of the MAOs reported in the sample have to do with the company’s opacity, since almost 58 percent of the modified audit reports inform about omission of information and/or scope limitations.
5. Empirical model
To test the hypotheses, we estimate the baseline model specified in expression (1). All the variable definitions are in the Appendix.
\[\begin{equation} \label{eq1} \small \begin{split} Pr (OP_{i,t} = 1) =& \ \alpha + \beta_{1} OP_{i,t-1} + \beta_{2} ForeignControl_{i,t} + \beta_{3} Size_{i,t} \\ & + \beta_{4} Leverage_{i,t} + \beta_{5} Roa_{i,t} + \beta_{6} Loss_{i,t} \\ & + \beta_{7} Liquidity_{i,t} + \beta_{8} Big_{i,t} + \beta_{9} AuditorTenure_{i,t} \\ & + \beta_{10} ForeignOperations_{i,t} + \beta_{11} Age_{i,t}\\ & + \beta_{12} CapitalIntensity_{i,t} + \beta_{13} ListedParent_{i,t} \\ & + \sum \textit{Period Effects}_{i,t} + \sum \textit{Industry Effects}_{i,t} + \varepsilon_{i,t} \end{split} \ \ \ \ (1) \end{equation}\]
where subscripts i and t represent company and year respectively; OP stands for one of the following: MAO, which equals 1 if the company receives a modified opinion, independent of the underlying reason/s, 0 if the opinion is clean; GAAP, equaling 1 if the modified report mentions at least one GAAP violation, 0 if the opinion is clean; Opacity, which is set to 1 if the MAO makes reference to at least one omitted information and/or scope limitation, 0 if the opinion is clean;11 GCU, that equals 1 if the MAO mentions an uncertainty for going concern, 0 if the opinion is clean; or NonGCU, which equals 1 if the MAO reports at least one uncertainty related to reasons other than going concern, 0 if the opinion is clean.
Our main experimental variable is ForeignControl, a dummy equaling 1 if the parent company is foreign, and 0 if it is local. A positive and significant coefficient for this variable would indicate a higher incidence of modified opinions in foreign-owned subsidiaries.
The model includes the following set of controls, derived from prior research:12
We control for the documented persistence of the auditor’s opinion with the previous year’s audit opinion (OPt-1) (Monroe & Teh, 1993; Mutchler, 1985).
Firm size is controlled with the logarithm of sales (Size). Some studies suggest a negative relation between firm size and the likelihood of receiving MAOs (Carey & Simnett, 2006), while others find the opposite (Reynolds & Francis, 2001).
Financial risk is controlled with leverage, defined as total debt over total assets (Leverage), which prior studies have found to be positively associated with the audit modification rates (Beatty & Weber, 2003; Mutchler et al., 1997).
Another determinant of the probability of receiving MAOs is firm performance, which is controlled for with the return on assets ratio, defined as net income over total assets (Roa) and an indicator variable for companies reporting losses (Loss). Literature suggests that the probability of receiving MAOs increases as profitability declines (e.g.: Nelson et al., 1988).
The liquidity ratio, calculated as current assets over current liabilities (Liquidity), proxies for the company’s financial health, which reduces the probability of receiving MAOs (Kida, 1980; Mutchler, 1985).
Auditor quality, proxied with the dummy variable equaling 1 if the audit firm is one of the big international firms, and 0 otherwise (Big). Larger auditors have greater competence and incentives to detect and reveal misstatements (DeAngelo, 1981; Kim et al., 2003).
AuditorTenure controls for the number of years the subsidiary has been audited by its current audit firm, since there is evidence that the length of the auditor-client relation influences the likelihood of MAOs (Chen et al., 2016).
Several proxies of firm complexity, which likely increases misreporting (Ireland, 2003), and therefore the probability of receiving MAOs: an indicator variable that equals 1 if the company has foreign operations, 0 otherwise (ForeignOperations); the number of years since the subsidiary was established (Age); and the ratio of PP&E to total assets (CapitalIntensity).
The listing status of the parent company is also included, as a dummy equaling 1 if the parent company is listed, and 0 otherwise (ListedParent). Because of the market pressures, listed parent companies might have greater incentives to avoid modified audit reports, even at the subsidiary level. However, there is also evidence that listed parent companies allocate earnings manipulation in their private subsidiaries to overcome the restrictions imposed by capital markets (Bonacchi et al., 2017).
To control for the effect of the audit regulation on the propensity of auditors to issue MAOs we include two dummies, representing the three regulatory periods delimited by the Laws 44/2002 and 12/2010. Period2 and Period3 are equal to 1 for the periods 2002 to 2009 and 2010 to 2013 respectively, and 0 otherwise. Thus, the reference is the earliest period in our sample (1997-2001).
Finally, the model includes industry fixed effects, which are based on the SIC classification.
We winsorize all the continuous variables at the 1 and 99 percent levels to alleviate problems derived from the presence of outliers.13
6. Results
6.1. Univariate tests and correlations
Descriptive statistics of research variables are reported in Table 3, where we split the sample based on the type of parent company, local or foreign.14 We test the null hypothesis that the two subsamples have identical means, distributions, or proportions with a t-test, a Kruskal-Wallis test, and a proportions test respectively. Table 4 presents the Pearson pair wise correlations between the research variables.
Table 3. Descriptive statistics and univariate tests
| Local control | Foreign control | Means diff. | Kruskal Wallis | Proportions diff. | |||||||
|---|---|---|---|---|---|---|---|---|---|---|---|
| Variable | N | Mean | Median | Sth. Dev. | N | Mean | Median | Sth. Dev. | |||
| MAO | 9,177 | 0.182 | 0.000 | 0.386 | 10,681 | 0.307 | 0.000 | 0.461 | -20.40*** | ||
| GAAP | 7,621 | 0.059 | 0.000 | 0.235 | 7,401 | 0.073 | 0.000 | 0.260 | -3.47*** | ||
| Opacity | 7,706 | 0.069 | 0.000 | 0.254 | 8,666 | 0.194 | 0.000 | 0.395 | -23.23*** | ||
| GCU | 7,340 | 0.031 | 0.000 | 0.173 | 6,946 | 0.024 | 0.000 | 0.153 | 2.57** | ||
| NonGCU | 7,315 | 0.024 | 0.000 | 0.152 | 7,248 | 0.055 | 0.000 | 0.229 | -9.86*** | ||
| Sales (million €)* | 9,177 | 217.937 | 60.822 | 541.482 | 10,681 | 268.241 | 104.511 | 536.173 | -6.56*** | 803.30*** | |
| Size | 9,177 | 11.181 | 11.016 | 1.341 | 10,681 | 11.639 | 11.557 | 1.237 | -25.04*** | 803.30*** | |
| Leverage | 9,177 | 0.650 | 0.673 | 0.240 | 10,681 | 0.646 | 0.660 | 0.265 | 1.19 | 6.39** | |
| Roa | 9,177 | 0.037 | 0.032 | 0.091 | 10,681 | 0.034 | 0.033 | 0.109 | 2.70*** | 0.04 | |
| Loss | 9,177 | 0.202 | 0.000 | 0.401 | 10,681 | 0.253 | 0.000 | 0.435 | -8.52*** | ||
| Liquidity | 9,177 | 1.434 | 1.156 | 1.385 | 10,681 | 1.515 | 1.202 | 1.389 | -4.12*** | 49.30*** | |
| Big | 9,177 | 0.795 | 1.000 | 0.404 | 10,681 | 0.911 | 1.000 | 0.285 | -23.26*** | ||
| AuditorTenure | 9,177 | 6.198 | 5.000 | 4.124 | 10,681 | 6.506 | 6.000 | 4.303 | -5.12*** | 20.97*** | |
| ForeignOperations | 9,177 | 0.601 | 1.000 | 0.490 | 10,681 | 0.765 | 1.000 | 0.424 | -24.90*** | ||
| Age | 9,177 | 24.108 | 21.000 | 15.936 | 10,681 | 27.822 | 22.000 | 19.946 | -14.34*** | 88.35*** | |
| CapitalIntensity | 9,177 | 0.229 | 0.146 | 0.237 | 10,681 | 0.212 | 0.152 | 0.208 | 5.18*** | 0.02 | |
| ListedParent | 9,177 | 0.475 | 0.000 | 0.499 | 10,681 | 0.758 | 1.000 | 0.428 | -41.21*** | ||
This table presents the descriptive statistics of the research variables for the two subsamples of subsidiaries (with local or foreign control), as well as the tests that compare each characteristic between the two subsamples. In the last three columns we report respectively the t-statistics, χ2-statistics, and z-statistics of the tests where the null is that the two groups have identical means, distributions, or proportions. Statistical significance is indicated by *** for p < 0.01, ** for p < 0.05, and * for p < 0.1. Variable definitions are in the Appendix.
*Since Size is measured as the logarithm of sales revenue (Sales), we include the statistics of Sales to easy the interpretation of the results.
Table 4. Correlations
| (1) MAO | (2) GAAP | (3) Opacity | (4) GCU | (5) NonGCU | |||||||||
|---|---|---|---|---|---|---|---|---|---|---|---|---|---|
| (6) | ForeignControl | 0.14*** | 0.03*** | 0.18*** | -0.02** | 0.08*** | |||||||
| (7) | Size | -0.01* | -0.004 | 0.02*** | -0.07*** | -0.002 | |||||||
| (8) | Leverage | 0.04*** | -0.02*** | -0.005 | 0.17*** | 0.03*** | |||||||
| (9) | Roa | -0.16*** | -0.07*** | -0.09*** | -0.24*** | -0.06*** | |||||||
| (10) | Loss | 0.16*** | 0.07*** | 0.10*** | 0.21*** | 0.05*** | |||||||
| (11) | Liquidity | 0.02** | 0.02*** | 0.02** | -0.04*** | 0.02* | |||||||
| (12) | Big | 0.06*** | 0.02*** | 0.07*** | 0.02** | -0.001 | |||||||
| (13) | TenureAuditor | 0.08*** | 0.003 | 0.13*** | 0.03*** | 0.01 | |||||||
| (14) | ForeignOperations | 0.04*** | 0.02* | 0.06*** | -0.03*** | 0.02** | |||||||
| (15) | Age | 0.07*** | 0.05*** | 0.07*** | -0.001 | 0.03*** | |||||||
| (16) | CapitalIntensity | -0.03*** | 0.03*** | -0.05*** | 0.02* | -0.03*** | |||||||
| (17) | ListedParent | -0.03*** | -0.03*** | -0.01 | -0.03*** | -0.01 | |||||||
| (6) | (7) | (8) | (9) | (10) | (11) | (12) | (13) | (14) | (15) | (16) | (17) | ||
| (6) | ForeignControl | 1 | |||||||||||
| (7) | Size | 0.17*** | 1 | ||||||||||
| (8) | Leverage | -0.01 | 0.04*** | 1 | |||||||||
| (9) | Roa | -0.02*** | 0.08*** | -0.38*** | 1 | ||||||||
| (10) | Loss | 0.06*** | -0.08*** | 0.27*** | -0.63*** | 1 | |||||||
| (11) | Liquidity | 0.03*** | -0.13*** | -0.43*** | 0.12*** | -0.08*** | 1 | ||||||
| (12) | Big | 0.17*** | 0.14*** | 0.0001 | 0.004 | 0.03*** | 0.002 | 1 | |||||
| (13) | TenureAuditor | 0.04*** | 0.14*** | -0.06*** | -0.01 | 0.02** | 0.04*** | 0.02** | 1 | ||||
| (14) | ForeignOperations | 0.18*** | 0.20*** | -0.05*** | 0.03*** | -0.03*** | 0.02*** | -0.01 | 0.03*** | 1 | |||
| (15) | Age | 0.10*** | 0.17*** | -0.14*** | 0.04*** | -0.03*** | 0.07*** | -0.004 | 0.23*** | 0.16*** | 1 | ||
| (16) | CapitalIntensity | -0.04*** | 0.01 | -0.10*** | -0.06*** | 0.05*** | -0.15*** | 0.03*** | -0.03*** | -0.08*** | -0.06*** | 1 | |
| (17) | ListedParent | 0.29*** | 0.13*** | 0.01 | 0.04*** | 0.003 | 0.02** | 0.27*** | 0.03*** | 0.02*** | 0.06*** | -0.02*** | 1 |
This table reports Pearson pair wise correlations between the research variables. Variable definitions are in the Appendix. Statistical significance is indicated by *** for p < 0.01, ** for p < 0.05, and * for p < 0.1.
We observe a significantly higher proportion of modified reports in foreign than in local group subsidiaries (mean MAO of 0.307 vs. 0.182). The proportion of GAAP violation, opacity, and non-GCU related MAOs is also significantly higher among foreign-owned subsidiaries, the largest being the difference in the opacity related MAOs. Moreover, the correlation coefficient between ForeignControl and Opacity is higher than those between ForeignControl and GAAP or NonGCU, although they all are positive and statistically significant at the 1 percent level. As for the GCU related MAOs, the univariate results indicate that they are significantly more frequent in local than in foreign group subsidiaries, as expected.
Although the results at the univariate level reveal differences in the frequency of MAOs between foreign and local group subsidiaries, which are consistent with the hypotheses, there are also significant differences between the two groups in terms of firm-specific characteristics that are deemed to affect the probability of receiving MAOs. Companies under foreign control are, on average, larger (Size) and older (Age) than subsidiaries of local groups, and have a higher liquidity ratio (Liquidity) and longer relations with their audit firm (AuditorTenure). Moreover, subsidiaries of foreign groups are significantly more likely to hire international auditors (Big), to report a loss (Loss), to engage in foreign operations (ForeignOperations), and to be part of a group whose parent company is listed (ListedParent). Thus, controlling for these factors is necessary to get valid conclusions regarding the relation of interest, so that we next turn to the results of the regression analysis.
6.2. Regression analysis
Panels A to E of Table 5 present the results of the estimation of model (1) where the dependent variable is MAO, GAAP, Opacity, GCU, and NonGCU respectively. The four columns reported in each panel show the results employing alternative estimation procedures. Specifically, we use logistic regression (columns (1) to (3)) and a dynamic random logit model corrected for sample selection (Rabe-Hesketh & Skrondal, 2013). In column (1) we use the entire sample, whereas in columns (2) and (3) we use a propensity score matched (PSM) sample and a coarsened exact matched (CEM) sample respectively.15
To obtain the PSM sample, we generate propensity scores by running a logistic regression for each year and industry combination where ForeignControl is the dependent variable and the controls used in our baseline empirical model are the independent variables. Next, we match without replacement a foreign group subsidiary with a local group subsidiary operating in the same industry during the same year, setting a caliper distance of 5 percent.16 When employing the CEM procedure (Blackwell et al., 2009), we match foreign group subsidiaries with local group subsidiaries from the same industry and year by size, leverage, and return on assets. The CEM approach determines the matching as follows: first, it defines several cut points for the variables used for matching based on which it obtains different strata; then, it classifies the observations into strata and matches the treated (i.e. foreign group subsidiaries) and control (i.e. local group subsidiaries) observations that are within the same stratum. In order to use the maximum information available, we do not impose a matching restriction regarding the number of treated and control observations within each stratum, meaning that some strata may have a different number of treated and control observations.17
Since our logit model is dynamic (i.e. it includes the lag of the dependent), fixed effects approaches have many limitations (Wooldridge, 2005). One estimation technique that properly handles these problems is the constrained version of the Wooldridge's (2005) approach proposed by Rabe-Hesketh and Skrondal (2013). Results using this technique are reported in column (4). This approach deals with the unobserved firm heterogeneity problem and implies the random effects estimation of an extended version of model (1), including as additional regressors: the dependent and explanatory variables measured at the initial period; and the mean of each explanatory variable. To solve the problem of missing data, we follow the recommendations of Skrondal and Rabe-Hesketh (2014). Specifically, we require sequences of at least two consecutive non-missing observations and allow the initial values of the dependent and explanatory variables to change between sequences. In addition, we calculate the mean of the explanatory variables only with the observations that are valid for the estimation. Given that the main experimental variable, ForeignControl, is time invariant for many companies in the sample, this random effects estimation is carried out in the subsample of observations belonging to companies which are always controlled by either a local or a foreign parent company. This is why the sample used in this estimation is reduced (N = 15,914).
In all the estimations we correct standard errors by clustering on both company and year following Cameron et al. (2011).
Table 5. Foreign control and MAOs. Regression analysis
| Panel A: Foreign control and MAOs (Dependent: MAO) | ||||
|---|---|---|---|---|
| Variables | (1) | (2) | (3) | (4) |
| Constant | -2.924*** | -3.154*** | -3.213*** | -3.805*** |
| [-10.82] | [-6.87] | [-5.17] | [-8.32] | |
| MAOt-1 | 3.644*** | 3.680*** | 3.693*** | 2.667*** |
| [34.70] | [32.33] | [27.37] | [39.69] | |
| ForeignControl | 0.472*** | 0.510*** | 0.488*** | 0.589*** |
| [5.83] | [5.60] | [4.97] | [6.93] | |
| Size | -0.056** | -0.055 | -0.034 | -0.198*** |
| [-2.21] | [-1.30] | [-0.57] | [-3.05] | |
| Leverage | 0.053 | 0.226 | -0.186 | -0.041 |
| [0.30] | [1.39] | [-0.68] | [-0.17] | |
| Roa | -1.757*** | -1.617*** | -2.571*** | -2.266*** |
| [-3.78] | [-2.95] | [-3.30] | [-4.64] | |
| Loss | 0.284*** | 0.326*** | 0.222* | 0.200** |
| [3.16] | [3.74] | [1.79] | [2.02] | |
| Liquidity | 0.000 | 0.007 | -0.031 | -0.002 |
| [0.01] | [0.25] | [-1.09] | [-0.05] | |
| Big | 0.364*** | 0.361*** | 0.379*** | 0.199 |
| [5.06] | [2.95] | [2.85] | [1.09] | |
| AuditorTenure | 0.014 | 0.019 | 0.013 | 0.023* |
| [1.41] | [1.55] | [0.90] | [1.78] | |
| ForeignOperations | -0.058 | -0.028 | 0.002 | -0.067 |
| [-0.91] | [-0.42] | [0.02] | [-0.76] | |
| Age | 0.004*** | 0.006*** | 0.004* | 0.060*** |
| [2.76] | [3.52] | [1.93] | [3.29] | |
| CapitalIntensity | -0.243 | -0.414 | -0.249 | -0.786* |
| [-1.31] | [-1.43] | [-0.78] | [-1.90] | |
| ListedParent | -0.299*** | -0.256*** | -0.182 | -0.592*** |
| [-3.93] | [-2.72] | [-1.51] | [-2.86] | |
| Period2 | 0.200 | 0.162 | 0.280 | 0.073 |
| [1.59] | [0.86] | [1.53] | [0.68] | |
| Period3 | 0.518*** | 0.459*** | 0.378** | 0.228 |
| [2.95] | [2.71] | [2.00] | [1.41] | |
| Industry effects | Yes | Yes | Yes | Yes |
| Additional control variables | No | No | No | Yes |
| No. observations | 19,858 | 9,876 | 7,669 | 15,914 |
| Pseudo R2 | 0.434 | 0.442 | 0.431 | 0.336 |
| Wald χ2 | 6,295.10*** | 3,019.90*** | 2,464.47*** | 4,779.11*** |
Table 5. Foreign control and MAOs. Regression analysis. (Cont’d)
| Panel B: Foreign control and GAAP violation related MAOs (Dependent: GAAP) | ||||
|---|---|---|---|---|
| Variables | (1) | (2) | (3) | (4) |
| Constant | -3.719*** | -3.366*** | -4.435*** | -4.268*** |
| [-5.23] | [-4.41] | [-2.90] | [-5.00] | |
| GAAPt-1 | 5.009*** | 5.017*** | 4.954*** | 3.485*** |
| [25.85] | [21.25] | [17.63] | [20.43] | |
| ForeignControl | 0.133 | 0.045 | -0.030 | 0.281* |
| [1.26] | [0.42] | [-0.21] | [1.79] | |
| Size | -0.029 | -0.052 | 0.017 | -0.266* |
| [-0.54] | [-0.75] | [0.14] | [-1.88] | |
| Leverage | -0.429* | -0.351 | -0.422 | -1.038* |
| [-1.84] | [-1.44] | [-0.81] | [-1.88] | |
| Roa | -1.957*** | -2.136* | -7.315*** | -1.688 |
| [-2.65] | [-1.65] | [-4.50] | [-1.49] | |
| Loss | 0.227 | 0.102 | -0.022 | 0.221 |
| [1.51] | [0.60] | [-0.10] | [1.04] | |
| Liquidity | -0.023 | 0.014 | 0.021 | -0.001 |
| [-0.54] | [0.53] | [0.35] | [-0.01] | |
| Big | 0.220** | -0.003 | 0.445*** | 0.130 |
| [2.26] | [-0.03] | [2.58] | [0.36] | |
| AuditorTenure | -0.008 | 0.004 | -0.007 | -0.005 |
| [-0.43] | [0.19] | [-0.28] | [-0.19] | |
| ForeignOperations | -0.073 | -0.007 | 0.046 | 0.056 |
| [-0.81] | [-0.08] | [0.24] | [0.33] | |
| Age | 0.006** | 0.008** | 0.011*** | 0.037 |
| [2.53] | [2.07] | [2.64] | [0.91] | |
| CapitalIntensity | 0.035 | -0.246 | -0.040 | -0.773 |
| [0.14] | [-0.76] | [-0.10] | [-0.91] | |
| ListedParent | -0.323** | -0.345* | -0.178 | -0.479 |
| [-2.42] | [-1.80] | [-0.73] | [-1.13] | |
| Period2 | 0.163 | 0.230 | 0.423 | 0.119 |
| [0.95] | [1.18] | [1.59] | [0.59] | |
| Period3 | 0.127 | -0.047 | 0.031 | 0.137 |
| [1.16] | [-0.27] | [0.13] | [0.44] | |
| Industry effects | Yes | Yes | Yes | Yes |
| Additional control variables | No | No | No | Yes |
| No. observations | 15,022 | 7,674 | 5,885 | 11,862 |
| Pseudo R2 | 0.505 | 0.511 | 0.491 | 0.351 |
| Wald χ2 | 2,630.38*** | 1,341.10*** | 1,043.26*** | 1,428.09*** |
Table 5. Foreign control and MAOs. Regression analysis. (Cont’d)
| Panel C: Foreign control and opacity related MAOs (Dependent: Opacity) | ||||
|---|---|---|---|---|
| Variables | (1) | (2) | (3) | (4) |
| Constant | -4.257*** | -4.610*** | -4.582*** | -5.690*** |
| [-11.06] | [-7.44] | [-6.62] | [-7.63] | |
| Opacityt-1 | 4.603*** | 4.722*** | 4.576*** | 2.978*** |
| [20.19] | [20.91] | [21.17] | [24.56] | |
| ForeignControl | 0.881*** | 1.027*** | 0.950*** | 1.199*** |
| [8.78] | [8.87] | [8.49] | [8.04] | |
| Size | -0.018 | -0.040 | 0.002 | -0.087 |
| [-0.52] | [-0.83] | [0.03] | [-0.79] | |
| Leverage | -0.245 | -0.095 | -0.598* | -0.060 |
| [-1.57] | [-0.35] | [-1.75] | [-0.14] | |
| Roa | -0.927 | -0.212 | -2.219 | -0.756 |
| [-1.51] | [-0.20] | [-1.46] | [-0.91] | |
| Loss | 0.313** | 0.458** | 0.212 | 0.343** |
| [2.36] | [2.48] | [0.91] | [2.15] | |
| Liquidity | -0.018 | -0.022 | -0.083 | -0.057 |
| [-0.60] | [-0.53] | [-1.38] | [-0.94] | |
| Big | 0.462*** | 0.625*** | 0.613** | 0.383 |
| [3.36] | [3.12] | [2.51] | [1.22] | |
| AuditorTenure | 0.019** | 0.028** | 0.021 | 0.021 |
| [2.05] | [2.01] | [1.23] | [0.99] | |
| ForeignOperations | -0.059 | 0.084 | -0.073 | -0.183 |
| [-0.59] | [0.74] | [-0.41] | [-1.26] | |
| Age | 0.001 | 0.003 | -0.001 | 0.051* |
| [0.34] | [1.00] | [-0.44] | [1.89] | |
| CapitalIntensity | -0.481** | -0.817** | -0.415 | -0.935 |
| [-2.49] | [-2.39] | [-1.13] | [-1.31] | |
| ListedParent | -0.384*** | -0.347** | -0.284** | -0.240 |
| [-4.60] | [-2.09] | [-2.11] | [-0.68] | |
| Period2 | 0.369* | 0.331 | 0.513 | 0.445*** |
| [1.70] | [1.08] | [1.30] | [2.66] | |
| Period3 | 0.529*** | 0.442** | 0.516 | 0.460* |
| [3.25] | [2.04] | [1.57] | [1.86] | |
| Industry effects | Yes | Yes | Yes | Yes |
| Additional control variables | No | No | No | Yes |
| No. observations | 16,372 | 8,213 | 6,408 | 13,111 |
| Pseudo R2 | 0.537 | 0.562 | 0.537 | 0.421 |
| Wald χ2 | 4,052.69*** | 1,874.95*** | 1,608.52*** | 3,354.89*** |
Table 5. Foreign control and MAOs. Regression analysis. (Cont’d)
| Panel D: Foreign control and GCU related MAOs (Dependent: GCU) | ||||
|---|---|---|---|---|
| Variables | (1) | (2) | (3) | (4) |
| Constant | -4.878*** | -4.274*** | -5.445*** | -7.853*** |
| [-6.19] | [-5.52] | [-4.05] | [-4.99] | |
| GCUt-1 | 3.913*** | 4.228*** | 4.109*** | 2.086*** |
| [12.44] | [11.30] | [11.29] | [6.38] | |
| ForeignControl | -0.351* | -0.475* | -0.698** | -0.613** |
| [-1.79] | [-1.72] | [-2.03] | [-2.15] | |
| Size | -0.208** | -0.251*** | -0.183 | -0.262 |
| [-2.41] | [-3.37] | [-1.38] | [-1.31] | |
| Leverage | 1.884*** | 1.831*** | 2.041*** | 3.198*** |
| [6.81] | [4.94] | [3.79] | [4.55] | |
| Roa | -3.942*** | -3.723*** | 0.572 | -5.278*** |
| [-7.23] | [-4.93] | [0.16] | [-4.34] | |
| Loss | 0.876*** | 0.975*** | 1.109** | 0.761*** |
| [3.44] | [4.48] | [2.06] | [2.59] | |
| Liquidity | -0.048 | -0.122*** | -0.730* | 0.016 |
| [-0.75] | [-3.65] | [-1.71] | [0.14] | |
| Big | 0.336 | -0.090 | -0.153 | -0.917 |
| [1.26] | [-0.44] | [-0.46] | [-1.39] | |
| AuditorTenure | -0.010 | 0.018 | -0.029* | 0.009 |
| [-0.41] | [0.56] | [-1.76] | [0.21] | |
| ForeignOperations | 0.004 | -0.368** | 0.420 | -0.169 |
| [0.03] | [-2.24] | [1.61] | [-0.59] | |
| Age | 0.002 | 0.002 | 0.005 | 0.403*** |
| [0.33] | [0.19] | [0.94] | [5.05] | |
| CapitalIntensity | 0.222 | 0.394 | 0.407 | -0.472 |
| [0.73] | [0.71] | [0.60] | [-0.36] | |
| ListedParent | -0.092 | 0.113 | 0.265 | 0.014 |
| [-0.35] | [0.63] | [1.19] | [0.02] | |
| Period2 | -0.010 | -0.180 | 0.035 | -0.765 |
| [-0.03] | [-0.37] | [0.06] | [-1.41] | |
| Period3 | 1.977*** | 2.149*** | 2.159*** | 2.110*** |
| [3.98] | [4.60] | [4.18] | [3.43] | |
| Industry effects | Yes | Yes | Yes | Yes |
| Additional control variables | No | No | No | Yes |
| No. observations | 14,286 | 7,289 | 5,503 | 11,221 |
| Pseudo R2 | 0.469 | 0.501 | 0.402 | 0.439 |
| Wald χ2 | 832.58*** | 428.57*** | 258.04*** | 1,002.18*** |
Table 5. Foreign control and MAOs. Regression analysis. (Cont’d)
| Panel E: Foreign control and non-GCU related MAOs (Dependent: NonGCU) | ||||
|---|---|---|---|---|
| Variables | (1) | (2) | (3) | (4) |
| Constant | -4.621*** | -5.431*** | -4.094*** | -5.809*** |
| [-7.49] | [-5.21] | [-4.95] | [-5.50] | |
| NonGCUt-1 | 4.835*** | 4.810*** | 4.946*** | 3.768*** |
| [22.93] | [14.78] | [21.01] | [17.62] | |
| ForeignControl | 0.804*** | 0.880*** | 0.758*** | 0.773*** |
| [5.72] | [3.62] | [3.63] | [3.78] | |
| Size | -0.000 | 0.038 | -0.012 | 0.017 |
| [-0.01] | [0.52] | [-0.12] | [0.10] | |
| Leverage | 0.282 | 0.708 | 0.160 | -1.156* |
| [0.72] | [1.37] | [0.23] | [-1.78] | |
| Roa | -2.382** | -1.906 | -2.416 | -4.194*** |
| [-2.53] | [-1.51] | [-1.03] | [-3.49] | |
| Loss | 0.081 | 0.053 | -0.260 | -0.177 |
| [0.42] | [0.23] | [-0.90] | [-0.71] | |
| Liquidity | 0.058 | 0.152*** | 0.137*** | 0.069 |
| [1.56] | [3.61] | [3.11] | [0.90] | |
| Big | -0.036 | 0.044 | -0.226 | 0.019 |
| [-0.17] | [0.21] | [-0.71] | [0.04] | |
| AuditorTenure | 0.041*** | 0.043** | 0.041 | 0.030 |
| [3.22] | [2.49] | [1.18] | [0.79] | |
| ForeignOperations | -0.080 | -0.114 | 0.026 | 0.004 |
| [-0.71] | [-0.53] | [0.11] | [0.02] | |
| Age | 0.003 | 0.006 | 0.000 | 0.063 |
| [1.50] | [1.16] | [0.05] | [1.23] | |
| CapitalIntensity | -0.437 | -0.792 | -0.434 | -0.779 |
| [-1.17] | [-1.43] | [-1.05] | [-0.73] | |
| Listedarent | -0.403*** | -0.465*** | -0.258 | -1.509*** |
| [-3.14] | [-2.70] | [-1.11] | [-3.06] | |
| Period2 | -0.281 | -0.264 | -0.331 | -0.374* |
| [-1.50] | [-0.93] | [-0.98] | [-1.69] | |
| Period3 | -0.757 | -0.896* | -0.550 | -0.885** |
| [-1.50] | [-1.89] | [-0.84] | [-2.45] | |
| Industry effects | Yes | Yes | Yes | Yes |
| Additional control variables | No | No | No | Yes |
| No. observations | 14,563 | 7,376 | 5,670 | 11,511 |
| Pseudo R2 | 0.446 | 0.429 | 0.433 | 0.299 |
| Wald χ2 | 1,797.89*** | 795.93*** | 707.37*** | 903.75*** |
This table presents the results of the estimation of model (1). We use logistic regression in the entire sample (column (1)), in a PSM-matched sample (column (2)), and in a CEM-matched sample (column (3)). Column (4) shows the results of a dynamic random logit model corrected for sample selection (Rabe-Hesketh & Skrondal, 2013) which includes the additional regressors mentioned in section 6.2. (untabulated). Variable definitions are in the Appendix. We report z-statistics adjusted for clustering on both company and year. Statistical levels are indicated by *** for p < 0.01, ** for p < 0.05, and * for p < 0.1.
When MAO is the dependent variable (Table 5, Panel A), the coefficient of ForeignControl is positive and statistically significant irrespective of the estimation technique employed. This indicates that subsidiaries of foreign groups are significantly more prone to receiving MAOs, which is consistent with H1. In addition, the coefficient of ForeignControl is economically significant: the probability of receiving MAOs is between 60 percent (the odds of ForeignControl in column (1) equals 1.60)18 and 80 percent (the odds of ForeignControl in column (4) equals 1.80) higher for the subsidiaries of foreign groups than for those of local groups.
When using GAAP as the dependent variable (Table 5, Panel B), the coefficient of ForeignControl is only statistically significant, at the 10 percent level, in one of the estimations performed (column (4)). Thus, the evidence supporting H1a is weak. The higher magnitude of DAC in foreign group subsidiaries previously documented by Beuselinck et al. (2019) and Gill-de-Albornoz and Rusanescu (2018) does not result into significantly higher modification rates for GAAP infringements, suggesting that foreign-owned subsidiaries are better at manipulating earnings within GAAP. This also suggests that DAC and GAAP violation related MAOs capture different dimensions of accounting quality. Likely, DAC capture on average ‘within GAAP’ earnings management (DeFond & Zhang, 2014), which auditors do not have to report.
Panel C of Table 5 presents the results using Opacity as the dependent variable. The coefficient of ForeignControl is positive, and both statistically and economically significant, in all the estimations. Foreign-controlled companies are between 141 (the odds of ForeignControl in column (1) equals 2.41) and 232 percent (the odds of ForeignControl in column (4) equals 3.32) more prone to omitting information required by the standards and/or deterring the auditor from assessing the implementation of the accounting standards. Thus, foreign group subsidiaries are less transparent than locally-owned subsidiaries, supporting H1b.
Finally, regarding the uncertainty related MAOs (Table 5, Panels D and E), the results are consistent with H1c and H1d. Specifically, in Panel D, the coefficient of ForeignControl is negative and statistically significant in all the estimations, indicating that subsidiaries of foreign groups are between 30 (the odds of ForeignControl in column (1) equals 0.70) and 50 percent (the odds of ForeignControl in column (3) equals 0.50) less prone to receiving GCUs than their locally-owned counterparts. In turn, results in Panel E indicate that foreign group subsidiaries are more than twice (the odds of ForeignControl ranges from 2.13 in column (3) to 2.41 in column (2)) as likely as locally-owned companies to receive non-GCU related MAOs. Most uncertainties in this category relate to tax inspections, so that the higher incidence in foreign-owned companies might be indicating a higher likelihood of these subsidiaries to being subject to a tax investigation.
With regard to the control variables, results are overall consistent with prior literature. The probability of receiving a modified report (MAO) is significantly higher when the previous year’s report is also modified, confirming the high persistence of the auditor’s opinion. This is also true when considering only the MAOs issued for a given reason (GAAP, Opacity, GCU, or NonGCU), meaning that modified reports are very likely to inform about the same underlying reasons as the year before. In contrast, it is significantly less likely to have a modified opinion, in general or for a specific reason, as the company’s profitability (Roa) increases and when the parent company is listed (ListedParent), suggesting that the negative consequences of MAOs, even at the subsidiary level, are greater for listed parent companies, so that subsidiaries of listed groups may make a bigger effort to avoid them. Except when the dependent relates to uncertainty related MAOs, the coefficient of Big is positive and statistically significant at conventional levels in most of the estimations, indicating that multinational audit firms are more prone to issue modified reports related to GAAP violations or opacity related problems.
6.3. Robustness checks
To enhance the validity of our results, we conducted a number of sensitivity tests, non-tabulated for the sake of brevity.
In a first set of tests, we estimate model (1) in alternative subsamples, after imposing several restrictions. First, we exclude financially distressed companies – with two consecutive years of net losses (Kaplan & Williams, 2013) or those that received GCU related MAOs – because these companies are documented to have lower financial reporting quality (Dechow & Dichev, 2002). Second, we restrict the sample to the subsidiaries that hire international audit firms, because high quality auditors are more likely to issue MAOs (Chen et al., 2010; DeFond et al., 2000; Reynolds & Francis, 2001). Third, we require at least 10 observations for each home country of the foreign parent companies in our sample to minimize bias. And fourth, the sample is divided into two sub-periods, before and after 2008, in order to test the sensitivity of the results to the global financial crisis that began in 2008 and the harmonization of Spanish local accounting standards with the IASB model in 2008.19 The results hold in all these alternative estimation settings.
Next, in order to alleviate the endogeneity concerns derived from potential omitted variables, we extend model (1) with several additional regressors that prior research has found to be related to the probability of receiving MAOs. In particular, results are robust to the inclusion of:
Additional measures of firm performance and growth, such as the ratio of cash flow from operations to total assets, the annual rate of sales growth, and the rolling 3-year standard deviation of cash flow from operations and sales from year t to t-2.
The probability of bankruptcy proxied by the Zmijewski’s risk score, calculated with the following formula:
Zmijewski score = - 4.336 - 4.513 * (Net Income / Total Assets) + 5.679 * (Total Liabilities / Total Assets) + 0.004 * (Current Assets / Current Liabilities).
The firm’s tax avoidance incentives (Burgstahler et al., 2006). Specifically, we use the accumulated effective tax rate (Ayers et al., 2009), calculated as the ratio of accumulated total tax expense over the 3-year period from t-2 to t and accumulated pre-tax income over the same period.
Two variables that capture earnings quality: the signed discretionary accruals estimated with the modified version of the Jones model (Dechow et al., 1995); and the frequency of small profits, proxied with a dummy variable equaling 1 if Roa is between 0 and 1 percent.
The intensity of the relationship lending, proxied by the number of banks the company works with over total assets, since there is evidence that companies with fewer lending relationships report lower quality accounting numbers (Bigus & Hillebrand, 2017).
The ratio of bank debt to total debt, to capture the effect of bank financing on the incidence of MAOs, because MAOs are relevant for debt contracting (Chen et al., 2016; Karjalainen, 2011) and bank monitoring plays a relevant role in improving financial reporting quality.
The parent company’s information asymmetries, proxied with the number of years since the parent company controls the subsidiary. As in the case of foreign analysts, the information asymmetries are greater when the parent company is foreign (Bae et al., 2008) and they are likely reduced as the parent company becomes more knowledgeable about the local accounting standards and practices.
Finally, we take into account the fact that a number of reports contain multiple reasons for modification, and attempt to isolate the effect of simultaneous reasons. To do so, we make two tests. First, we redefine the variables GAAP, Opacity, GCU, and NonGCU as follows: 1 if the company receives modifications 'only' for the corresponding reason, and 0 if the audit opinion is clean. Second, we follow Ireland (2003) and estimate a multinomial logit model where the dependent is equal to 1 if the audit report is modified only for GAAP violations, 2 if the audit report is modified only for opacity related problems, 3 if the audit report only mentions a GCU, 4 if the audit report only contains non-GCUs, and 0 otherwise; and the independent variables are identical to those from expression (1). Again, results are robust.
7. The impact of foreign takeovers
As an additional attempt to alleviate concerns about the potential endogeneity related to reverse causality, in this section we examine the effect of foreign takeovers on the likelihood of receiving MAOs. We identified 145 subsidiaries where the parent company changes from local to foreign, and 738 that are owned by local groups during the entire sample period. We estimate the model in changes specified in expression (2).
\[\begin{equation} \label{eq2} \small \begin{split} Pr (DeterOP_{i,t} =& 1) = \ \alpha + \beta_{1} YearForeignTakeover_{i,t} \\ & + \beta_{2} \Delta Size_{i,t} + \beta_{3} \Delta Leverage_{i,t} + \beta_{4} \Delta Roa_{i,t} \\ & + \beta_{5} Loss_{i,t} + \beta_{6} Loss_{i,t-1} + \beta_{7} \Delta Liquidity_{i,t} \\ & + \beta_{8} Big_{i,t} + \beta_{9} Big_{i,t-1} + \beta_{10} AuditorTenure_{i,t} \\ & + \beta_{11} ForeignOperations_{i,t} + \beta_{12} Age_{i,t} \\ & + \beta_{13} \Delta CapitalIntensity_{i,t} + \beta_{14} ListedParent_{i,t} \\ & + \beta_{15} ListedParent_{i,t-1} + \sum Period Effects_{i,t} \\ & + \sum Industry Effects_{i,t} + \varepsilon_{i,t} \end{split} \ \ \ \ (2) \end{equation}\]
where the dependent variable, DeterOP, is a dummy variable that captures the likelihood of audit opinion deterioration, and is equal to 1 if a company received a clean opinion in t-1 and an MAO in t, and 0 if the company received a clean opinion both in t-1 and t. Again, OP stands for MAO, GAAP, Opacity or NonGCU; 20 and YearForeignTakeover is a dummy equaling 1 if a foreign takeover occurs in year t, 0 if the subsidiary is owned by a local group.
Results, reported in Table 6, indicate that foreign takeovers have an immediate effect on firm opacity, since in the year when subsidiaries of local groups are acquired by a foreign group the probability to receive an opacity related MAO, having a clean report in the previous year, is five times higher than in the years when the firm remains under local control (the odds of YearForeignTakeover in the DeterOpacity model equals 5.30).
Table 6. Foreign takeovers and MAOs. Changes specification
| Variables | DeterMAO | DeterGAAP | DeterOpacity | DeterNonGCU |
|---|---|---|---|---|
| Constant | -3.284*** | -5.083*** | -4.791*** | -3.712*** |
| [-16.88] | [-9.37] | [-9.83] | [-12.70] | |
| YearForeignTakeover | 0.406 | -0.010 | 1.667** | 0.363 |
| [0.71] | [-0.01] | [2.44] | [0.38] | |
| ΔSize | -0.436*** | 0.085 | -0.712*** | -0.273 |
| [-3.33] | [0.28] | [-5.21] | [-0.88] | |
| ΔLeverage | 1.416* | -1.139 | 1.088 | -0.673 |
| [1.78] | [-0.79] | [1.05] | [-0.72] | |
| ΔRoa | -2.920*** | -1.195 | -2.943* | -1.938 |
| [-2.82] | [-0.61] | [-1.67] | [-1.15] | |
| Loss | 0.460*** | 0.324 | 0.292 | 0.316 |
| [3.10] | [1.03] | [1.06] | [0.59] | |
| Losst-1 | 0.661*** | 0.153 | 0.568* | 0.646 |
| [4.74] | [0.52] | [1.66] | [1.43] | |
| ΔLiquidity | 0.025 | -0.009 | -0.004 | 0.063 |
| [0.47] | [-0.09] | [-0.06] | [1.06] | |
| Big | 0.343 | -0.287 | 0.883* | 0.990 |
| [1.03] | [-0.36] | [1.70] | [1.20] | |
| Bigt-1 | -0.155 | 0.714 | -0.633 | -1.632* |
| [-0.42] | [0.91] | [-1.03] | [-1.95] | |
| AuditorTenure | -0.001 | -0.024 | 0.018 | 0.010 |
| [-0.03] | [-0.88] | [0.50] | [0.27] | |
| ForeignOperations | 0.040 | 0.334 | 0.053 | -0.037 |
| [0.29] | [1.48] | [0.19] | [-0.10] | |
| Age | 0.000 | 0.008 | -0.000 | -0.003 |
| [0.04] | [1.50] | [-0.03] | [-0.42] | |
| ΔCapitalIntensity | -1.757*** | -2.239* | -1.084 | -2.839*** |
| [-2.65] | [-1.82] | [-0.92] | [-2.67] | |
| ListedParent | 0.081 | -0.277 | -0.203 | 0.134 |
| [0.20] | [-0.66] | [-0.23] | [0.20] | |
| ListedParentt-1 | -0.800* | -0.598 | -1.167 | -0.722 |
| [-1.89] | [-1.24] | [-1.32] | [-1.18] | |
| Period2 | 0.017 | 0.353 | 0.569 | -1.011** |
| [0.07] | [0.93] | [1.28] | [-2.42] | |
| Period3 | 0.467* | -0.110 | 0.394 | -0.503 |
| [1.75] | [-0.25] | [0.78] | [-1.24] | |
| Industry effects | Yes | Yes | Yes | Yes |
| No. observations | 6,236 | 5,971 | 5,896 | 5,922 |
| Pseudo R2 | 0.081 | 0.050 | 0.087 | 0.055 |
| Wald χ2 | 235.43*** | 63.76*** | 114.11*** | 59.75*** |
This table presents the results of the estimation of model (2). Variable definitions are in the Appendix. We report z-statistics adjusted for clustering on both company and year. Statistical levels are indicated by *** for p < 0.01, ** for p < 0.05, and * for p < 0.1.
8. Concluding remarks
We follow recent research suggesting that the economic effects of MAOs depend on the type of modification (e.g., Chen et al., 2016), and investigate how the type of controlling shareholder, local or foreign, relates to the probability of receiving different types of modified audit reports in a large sample of private Spanish subsidiaries. This aims a better understanding of the effect of foreign control on the financial reporting quality of the host country companies.
We see that, on average, companies with foreign controlling shareholders are significantly more likely to receive MAOs. However, after disaggregating MAOs based on their underlying reasons the results are not homogeneous. Subsidiaries of foreign groups are significantly more likely to receive opacity related MAOs; but our tests do not support the prediction that the incidence of GAAP violation related MAOs is significantly higher in subsidiaries of foreign groups. Finally, subsidiaries owned by foreign groups are less likely to receive GCU related MAOs than those owned by local groups; while uncertainties other than GCUs are significantly more frequent in foreign-owned subsidiaries.
The evidence provided in this study has a number of implications for the academic research. Firstly, the findings support the notion that the dichotomous categorization of the audit opinion in modified and non-modified is too simplistic and the results of studies based on such classification should be revisited. Classifying modified reports according to their reason/s for modification may enrich the academic literature concerned with both the determinants and the economic effects of the audit opinion. Secondly, the MAOs classification used helps to better understand the association between the audit opinion and the firm’s financial reporting quality. Jointly considered, our results and the results of prior research (Gill-de-Albornoz & Rusanescu, 2018) are consistent with the thesis that MAOs do not highlight earnings management practices (Bradshaw et al., 2001; Butler et al., 2004), and support the claim that DAC likely capture ‘within GAAP’ earnings management (DeFond & Zhang, 2014, p. 287). Thirdly, taken as a whole, our results suggest that the cost-benefit relation of avoiding MAOs depends on the reasons of the modifications. For example, our evidence indicates that such cost-benefit relation differs between GAAP violations and opacity reasons. It could be the case that opacity related MAOs are costlier to avoid than GAAP violation related MAOs, and/or that avoiding MAOs for GAAP violations brings about higher benefits than avoiding opacity related MAOs. Further research is needed to disentangle the role in our results of the cost-benefit relation of avoiding MAOs.
The study also provides insights into the effects of FDI on the host-companies’ reporting quality which might be of interest to policy makers given the economic importance of foreign subsidiaries in most countries around the world (UNCTAD, 2016). In spite of the FDI’s expected benefits, our findings are consistent with the notion that foreign ownership does not enhance accounting quality in the private setting. Indeed, foreign controlling shareholders are associated with more opaque companies, which have also more ongoing tax investigations. Policymakers might consider the implementation of measures that minimize such negative effects of FDI at the firm level.
As always, the study has limitations, mainly derived from the limited access to data and time constraints. Although the results are robust in several sensitivity tests carried out, endogeneity concerns related to reverse causality and omitted variables cannot be completely ruled out.
Appendix. Variable definitions
| Variable | Definition |
|---|---|
| Age | Number of years since the subsidiary was established. |
| AuditorTenure | Number of years the subsidiary has been audited by its current audit firm. |
| Big | Dummy variable that equals 1 if the subsidiary is audited by a multinational audit firm, 0 otherwise. |
| CapitalIntensity | Ratio of PP&E to total assets. |
| DeterOP | Dummy equaling 1 if the company receives a clean opinion in t-1 and a modified one in t, 0 if the opinion is clean in t and t-1, where OP stands for MAO, GAAP, Opacity or NonGCU. |
| ForeignControl | Dummy variable that equals 1 if the parent company is foreign, 0 if it is local. |
| ForeignOperations | Dummy variable that equals to 1 if the subsidiary has foreign operations, 0 otherwise. |
| GAAP | Dummy variable that equals 1 if the MAO refers to at least one GAAP violation, 0 if the opinion is clean. |
| GCU | Dummy variable that equals 1 if the MAO mentions a going concern uncertainty, 0 if the opinion is clean. |
| Leverage | Ratio of total debt to total assets. |
| Liquidity | Ratio of current assets over current liabilities. |
| ListedParent | Dummy variable that equals 1 if the parent company is listed, 0 otherwise. |
| Loss | Dummy variable that equals 1 if the subsidiary reports losses, 0 otherwise. |
| MAO | Dummy variable that equals 1 if the subsidiary receives a modified audit opinion, 0 if the opinion is clean. |
| NonGCU | Dummy variable that equals 1 if the MAO reports at least one uncertainty related to reasons other than going concern, 0 if the opinion is clean. |
| Opacity | Dummy variable that equals 1 if the MAO makes reference to omitted information and/or at least one scope limitation, 0 if the opinion is clean. |
| OP | Stands for one of the following: MAO; GAAP; Opacity; GCU; or NonGCU. |
| Period2 | Dummy variable equaling 1 for the period 2002 to 2009, and 0 otherwise. |
| Period3 | Dummy variable equaling 1 for the period 2010 to 2013, and 0 otherwise. |
| Roa | Ratio of net income over total assets. |
| Sales | Sales revenues, in million euros. |
| Size | Natural logarithm of sales revenues. |
| YearForeignTakeover | Dummy equaling 1 if a foreign takeover occurs in the current year, 0 if the parent company is local. |
| ΔX | Annual change of the variable X. |
| Xt-1 | Lag of the variable X. |