A Data Science Approach to Cost Estimation Decision Making - Big Data and Machine Learning
ABSTRACT
Cost estimation may become increasingly difficult, slow, and resource-consuming when it cannot be performed analytically. If traditional cost estimation techniques are usable at all under those circumstances, they have important limitations. This article analyses the potential applications of data science to management accounting, through the case of a cost estimation task posted on Kaggle, a Google data science and machine learning website. When extensive data exist, machine learning techniques can overcome some of those limitations. Applying machine learning to the data reveals non-obvious patterns and relationships that can be used to predict costs of new assemblies with acceptable accuracy. This article discusses the advantages and limitations of this approach and its potential to transform cost estimation, and more widely management accounting. The multinational company Caterpillar posted a contest on Kaggle to estimate the price that a supplier would quote for manufacturing a number of industrial assemblies, given historical quotes for similar assemblies. Hitherto, this problem would have required reverse-engineering the supplier’s accounting structure to establish the cost structure of each assembly, identifying non-obvious relationships among variables. This complex and tedious task is usually performed by human experts, adding subjectivity to the process.
Keywords: Cost Estimation, Data Science, Big Data, Machine Learning.
JEL classification: M11, M15, M41.
Un enfoque de ciencia de datos para la toma de decisiones en la estimación de costes - Big Data y aprendizaje automático
RESUMEN
La estimación de costes puede resultar cada vez más difícil, lenta y consumidora de recursos cuando no puede realizarse de forma analítica. Cuando las técnicas tradicionales de estimación de costes son utilizadas en esas circunstancias se presentan importantes limitaciones. Este artículo analiza las posibles aplicaciones de la ciencia de datos a la contabilidad de gestión, a través del caso de una tarea de estimación de costes publicada en Kaggle, un sitio web de ciencia de datos y aprendizaje automático de Google. Cuando existen muchos datos, las técnicas de aprendizaje automático pueden superar algunas de esas limitaciones. La aplicación del aprendizaje automático a los datos revela patrones y relaciones no evidentes que pueden utilizarse para predecir los costes de nuevos montajes con una precisión aceptable. En nuestra investigación se analizan las ventajas y limitaciones de este enfoque y su potencial para transformar la estimación de costes y, más ampliamente, la contabilidad de gestión. La multinacional Caterpillar publicó un concurso en Kaggle para estimar el precio que un proveedor ofrecería por la fabricación de una serie de conjuntos industriales, dados los presupuestos históricos de conjuntos similares. Hasta ahora, este problema habría requerido una ingeniería inversa de la estructura contable del proveedor para establecer la estructura de costes de cada ensamblaje, identificando relaciones no obvias entre las variables. Esta compleja y tediosa tarea suele ser realizada por expertos humanos, lo que añade subjetividad al proceso.
Palabras clave: Estimación de costes, Data Science, Big Data, Machine Learning.
Códigos JEL: M11, M15, M41.
1. Introduction: Decision-making and Management Accounting Information
Artificial intelligence, data science, machine learning, and big data are on organizations’ agendas. Although these concepts are not new in disciplines such as finance (Fang & Zhang, 2016), in management accounting, they are still to be developed. Information has transformed so much that few if any management control processes remain divorced from digital technology applications, and data science should be on the agenda of management accounting researchers (Bhimani, 2020). For management accountants, the partnership with business-focused data scientists can accelerate the data-to-information conversion process, and they must fully embrace the integration of data, data science, and technology (Smith & Driscoll, 2017) while familiarizing themselves with the most modern methods of data governance, query, analytics, and visualization (Lawson, 2019). The foundational purpose of data analytics is to gather, process, and analyse data to improve the manager´s decision making (Rikhardsson & Yigitbasioglu, 2018). To be good at data analysis, the management accountant needs excellent data (Appelbaum et al., 2017) and prescriptive use of analytics to reinforce decisions made about uncertainties (Geddes, 2020). It is crucial to start knowing practical applications of data science in management accounting practices by real organizations.
In the case of cost management, inaccurate estimations risk offering goods at too high or too low a price, resulting respectively in the loss of orders or in financial loss for the provider (Hueber, Horejsi, & Schledjewski, 2016). Therefore, even if costs are traditionally estimated after the product is designed, it is advantageous to be able to estimate them in early phases, which present the most opportunities for cost reduction (Mandolini et al., 2020).
As the markets evolve towards shorter product lifespans, the design and development phases become more salient, and it becomes more important to analyse the cost of those phases accurately (Hadid, 2019). Analyses of the influence of cost are then reviewed in concepts like cost definitions as they apply to the engineering process stages: from bidding through design to manufacture, procurement, and, ultimately, operations (Curran, Raghunathan, & Price, 2004). Furthermore, the increasing demand for customized parts makes cost estimation increasingly difficult, slow, and resource consuming. That is the case, for instance, of outsourced goods, as cost estimation mainly depends on suppliers’ bids. Improvements in available information and processing would require knowledge about the supplier’s cost structure, something extremely difficult because (1) the necessary information is not generally disclosed, and (2) most suppliers rely on human know-how of their specialized staff (professionals, sellers, advisors), so that the quoting system is human dependent and hence very difficult to estimate analytically.
In this paper, we analyse the potential role of data science in cost estimation needs in the request-for-quote (RFQ) process for specific direct inputs into a finished good. With shorter life cycles and with a large number of changes in designs, the accuracy and on-time delivery of this information from suppliers is crucial to costing. Empirical support for this paper is provided by the case of a contest launched by Caterpillar on a web page (kaggle.com), where a company provides massive data and asks different groups of users to build an algorithm able to predict the prices of different parts. The 81% accuracy reached by the winning team is a great start for the development of these techniques. Furthermore, the combination of human judgment and the algorithm may exert a definite impact on cost estimation for decision making.
This paper is organized thus: we review the main characteristics of traditional human-based cost estimation with limited information, and the available studies and examples of the use of data science approaches in management accounting. We then review the case study. We conclude with an analysis of our main findings and the future implications of big data for cost estimation, decision making and management accounting research.
2. Cost Estimation –The Received Wisdom
Traditional cost estimation uses one or a combination of three methods (Hueber et al., 2016). First, Analogous cost estimation adjusts the cost of a similar product in light of the differences between it and the target product (Shen et al., 2017; Curran et al., 2004; Roy, 2003). This case-based approach is useful during the early design stage. If historical data are available, a precise estimate can be efficiently produced in a minimum of time (Esawi, 2003; Niazi, 2006). Expert is critical to identify the similarities and differences between products. The method can be further enhanced with the use of extra parameters or cost drivers, which account for how a part differs from the established baseline.
Second, Parametric cost estimation draws on ‘cost estimation relationships’ (CERs)—basic mathematical relations between production costs and cost drivers. For instance, with an established CER, it is possible to predict part costs given the part size (Esawi, 2003). These models use one or more parameters or variables, such as weight, size, and number of drawings, to establish the mathematical correlation between these parameters and the production costs. This technique requires detailed analytical information in order to establish the CERs.
Lastly, Bottom-up cost estimation tracks manufacturing elements such as material, labour, or infrastructure, to get final production cost. Under bottom-up the estimator must have deep understanding of the process, the process interactions, and the part design details (Karbhari & Jones, 2014; Roy, 2003). This method provides the advantage of a high level of detail and the causation it is able to provide (Curran et al., 2004). This approach requires detailed analytical information and important resources to manage it.
Especially in the case of technologies ‘new to the industry’, bottom-up estimation and expert judgment are the only available options, due to the lack of previous specific knowledge. However, in the case of technologies ‘new to the user,’ the other method would be possible, provided the new user can get data and/or an estimation model from the existing users (Hueber et al., 2016). In advanced industries, most of the necessary accounting information to perform an analytical estimation is not available, and human decision-making factors are present. In this case, the most basic estimation method is based on the expert judgment (knowledge and experience) of specialized agents. This technique is relevant when insufficient information is available (Duverlie & Castelain, 1999). For example, when one needs to estimate costs of outsourced goods and it is not possible to launch a bidding request to get precise answers from suppliers. However, this approach is dependent on the agent performing the judgment, and therefore hard to replicate. In sum, for cost estimation given very limited available information and considerable human decision-making factors, none of these traditional methods provides a robust analytical approach independent of human interpretations.
3. Data Science and Decision Making
Firms usually draw on formal systems, designed to capture transactions, for decision making purposes. Big data arise from wider configurations of information pools, past and present, structured and unstructured, formal and informal, social and economic (Bhimani, 2015). Data science can be defined as an interdisciplinary field using scientific schemes and algorithms to obtain judgment and insights from available data (Van der Alst, 2016).
Data science is being solidly accepted as a new paradigm in many fields of empirical science like economics, finance or operations. Hey et al (2009) claim that data science constitutes the new fourth paradigm of scientific progress, through machine learning algorithms. More applications are being continuously unfolded, as new algorithms are developed, and as computing capabilities handle larger amounts of data and complex relationships.
Concerning cost estimation, some early attempts already used machine learning (Bode, 1998; Hornik, Stinchcombe, & White, 1989; Roy, 2003), for example ‘neural networks’ (Schmidhuber, 2015). In cost estimation, neural networks are used to make a computer program learn the attributes that influence the production cost (Roy, 2003), by training the system with data from past cases. During the training, the neural network approximates the functional relationship between the attribute values and the product cost. The program can then compute the production cost under development given its attribute values. Neural networks produce better-cost predictions than conventional regression costing methods if a number of conditions are adhered to (Bode, 1998). For example, the neural network does not decrease any of the difficulties of the preliminary activities for using parametric methods, nor does it create any new ones, but it can detect hidden relationships among data. Therefore, the estimator does not need to provide or discern the assumptions of a product-to-cost relationship, which simplifies the process of developing the final equation (Hornik et al., 1989). Neural networking needs a large amount of information input, something that is rarely available in companies with a small range of products. Furthermore, the case base should be made up of products that are similar to each other and to the ones to be forecasted. This means that neural networking is not yet ready to manage uncertainty or disruption.
The equation resulting from a neural network does not appear logical even if one were to extract it by examining the weights, architecture, and nodal transfer functions that were associated with the final trained model. The artificial neural network truly becomes a ‘black box’ CER. This is problematic if customers require a detailed list of the fundamentals behind the cost estimate. The black box CER also limits the use of risk analysis tools (Roy, 2003). Recent developments in software have increased computational power and created a surge in demand for more advanced predictive solutions, and the market is responding with machine learning algorithms, like for example in speech recognition or for weather forecasting. However, these methods entail complex and opaque techniques, and their potential pitfalls (over-fitting, reduced transparency, biased results on bad sample data) arouse consequent scepticism, even though, these techniques are built on robust validation models (outcome analysis, cross-validation, and feature importance analysis) providing more confidence in the results and less worries about potential risks (Glowacki & Reichoff, 2017). Overall, big data has yet to cause changes in accounting practices and standards, it has the potential to cause a paradigm shift allowing economic activities to be traced and measured earlier and more deeply (Vasarhelyi, Kogan, & Tuttle, 2015). Examination of the relative advantages of LIFO, FIFO, or average cost, or the different definitions of fair value, will be relics of the past (Krahel & Titera, 2015). On the other hand, budgeting has branched out from traditional data sources and embraced new methods of control like ‘Beyond budgeting’ practices (Warren, Moffitt, & Byrnes, 2015) such as those available in enterprise resource planning (ERP) systems (Hansen & Van der Stede, 2004). Big data, including additional streams of data outside ERP systems (e.g., climate, satellite, census, labour, and macroeconomic data) could be used to enhance ‘beyond budgeting’ practices.
Warren et al. (2015) confirm that big data will affect the design and operation of management control systems, by identifying behaviours correlated with specific goal outcomes, which would prompt formulation of new performance measures. Data that are not related to economic transactions offer potential for developing financial intelligence and shaping cost management as well as pricing and operational control decisions (Bhimani & Willcocks, 2014). Auditors, for example, should include a broader base of data when monitoring and auditing accounting transaction information, in the spirit of big data. As noted by O'Leary (2013) this should include the integration of blogs, message boards, and other types of information into the analysis of accounting data as a part of continuously monitoring financial information. This would call for continuous financial assurance using big data from a larger context. Vasarhelyi, Kogan, & Tuttle (2015) argue that big data matters fundamentally because it changes radically what we mean by information.
The practical implications of the expansion of accounting data sets may include: (1) the ability to process and analyse detailed rather than summary transaction data; (2) the ability to integrate a variety of both internal and external data with financial data; (3) the ability to do ‘soft integration’ of environmental big data (e.g., social networks and news pieces) with accounting measurement and audit assurance processes; and (4) the ability to transform accounting, business, and audit processes based on (1), (2), and (3) (Kogan et al., 2014). These breakthroughs imply changes in the role of accountants: data scientists with an understanding of quantitative and statistical techniques can assist in shaping information provision. However, there is a need for ‘bimodal athletes’ (Court, 2012), requiring accountants to acquire a ‘sceptical’ perspective (McKinney, Yoos, & Snead, 2017). Moreover, the ability to assess big data will redefine lines of authority, influence, and organizational power in companies (Bhimani, 2015).
Although there are countless applications of data science techniques to financial accounting, the practical application of data science to management accounting is not yet mature. Some applications address overhead allocation and cost drivers. (Tang & Karim, 2017), and the estimation of real-estate market range values using combined neural network models (Yakubovskyi et al., 2017). The surge of applications of data science to management accounting will generate more data that will feed back into processes and increase the surge of new applications. In fact, and as Bhimani (2015) points out, firms manifesting network effects through big data–based decision making are likely to experience faster growth from effective strategic action, which can spur a greater rate of data production that in turn accelerates managerial action.
4. A Practical Application of Data Science to Cost Estimation: Caterpillar’s Contest at Kaggle
We analyse a real case of applying data science techniques to estimate the costs of manufacturing assemblies. This approach was tested by Caterpillar at Kaggle (www.kaggle.com), a popular Google data science and machine learning website where teams of data scientists compete to solve real cases posted by organizations and companies like the U.S. Department of Homeland Security, Google, Banco de Santander, Airbnb, Mercedes Benz, Airbus, and Caterpillar.
Caterpillar is the world’s leading manufacturer of construction and mining equipment, diesel and natural gas engines, industrial gas turbines, and diesel-electric locomotives. It has nearly 100,000 employees, and its sales turnover exceeded $53 billion in 2019. Caterpillar sells a variety of larger-than-life construction and mining equipment to companies across the globe, and that equipment relies on a complex set of tube assemblies. Caterpillar posted on Kaggle a challenge to create a model that could estimate the cost of outsourced tube assemblies, based on historical data for previous supplier quotes for similar assemblies. The three teams providing the most accurate models were rewarded with prizes adding up to $30,000, conditional on delivery of the software code for the final model used to generate the winning predictions.
4.1. The Data
The data provided by Caterpillar were publicly disclosed at https://www.kaggle.com/c/caterpillar-tube-pricing/data, in a compressed folder (data.zip) containing several files, listed in Figure 1.
Figure 1. Files provided by Caterpillar in Kaggle for information
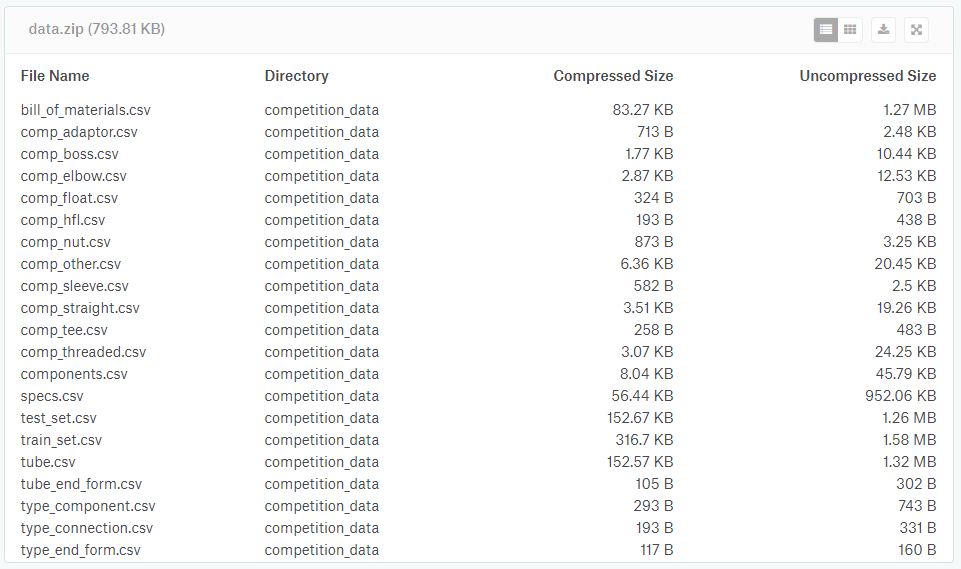
Source: https://www.kaggle.com/c/machinery-tube-pricing/data.
The data contained in each file are as follows:
The file train_set.csv consisted of 30,213 price quotes for tube assemblies, including the description and price of each assembly, to be used to train the machine learning algorithms.
The file test_set.csv consisted of 30,235 additional references without prices, intended to test the predicted prices and score the model using an error formula.
The rest of the files provided information about the features of each reference, in the form of relational tables (see the tables mapping in Figure 2).
Figure 2. Structure and dependencies of the data provided for each assembly
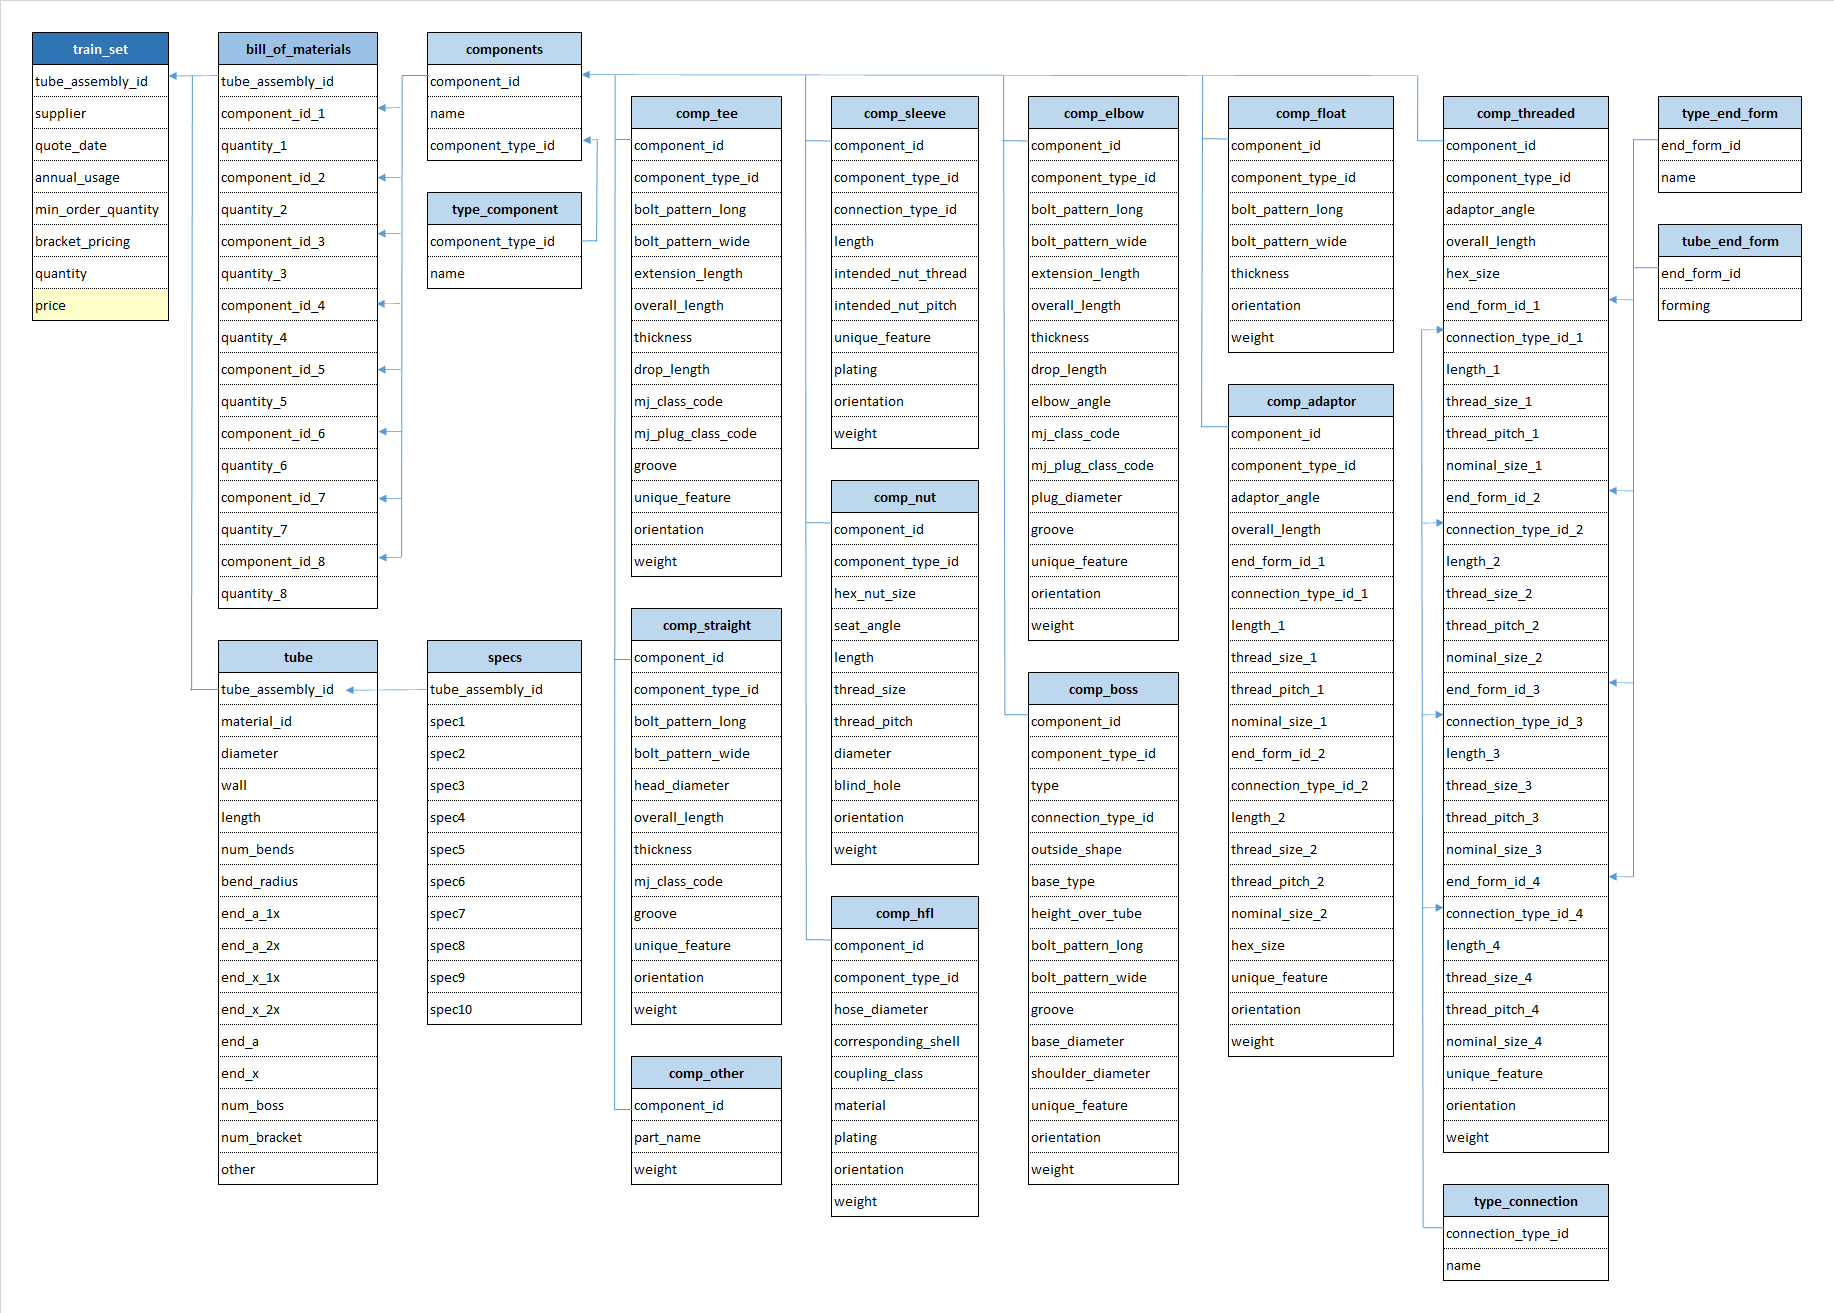
Information about the quote: supplier ID, date of the quote, annual usage amount, and minimum order quantity for ‘non-bracket pricing’ or level of quantities for ‘bracket pricing’.
Information about tubes: type of base material (among 20 different types), dimensions (diameter, wall thickness, length), other specifications (materials, processes, rust protection among 86 different types), number of bends and radius, number of ends (up to 4) and forms (among 27), number of bosses, and number of brackets.
Information about components: each assembly unit could include up to 8 different additional components of 11 different kinds. For each kind of component, additional information was provided: 14 parameters for elbows, 13 for bosses, 18 for adaptors, 12 for tees, 9 for nuts, 7 for stems and shells, 8 for sleeves, 30 for threaded components, 10 for straight components, 5 for free-floating components, and 2 for other kinds. Weight was specified for all components.
Each single reference of the 60,000 quotes (observation) could be defined in the system with no more than 125–150 features (predictors). However, as most of the assemblies were different and might not have in common the same nature of features, the aggregate of training data would result in a matrix with 30,213 rows and 1,153 columns that is with nearly 35 million elements. Such dimension would difficult the implementation of classical parametrical statistics techniques.
In addition, most standard machine learning algorithms (like Gradient Boosted or Neural Network) cannot operate with categorical variables, which are derived from observations made of qualitative data. This introduces additional complexity, as the categorical variables need to be converted to integer values if an ordinal relationship exists (for example, sizes expressed with labels of the kind ‘large,’ ‘medium,’ and ‘short’), or to new ‘dummy’ binary variables when such an ordinal relationship does not exist; for example, different patterns of a bolt. This last conversion process is called ‘hot-encoding.’ On the other hand, several rows might refer to the same assembly, and, hence, just changing the minimum amount needed to get the price (as in the first eight rows of the training data), reducing the complexity and providing valuable hints about volume discount policies.
As a consequence of the high dimensionality of the data, this is a big data case. This type of information is in most cases private and sensitive and is not often disclosed by companies, as it may confer a competitive advantage.
4.2. Cost Estimation at Caterpillar
As with snowflakes, it is difficult to find two identical tubes in Caterpillar's catalogue of machinery. Currently, Caterpillar outsources the manufacture of these tube assemblies to a variety of suppliers, each having its own pricing model. According to statistics provided in section 3.1, to fully define an assembly, 1,153 parameters must be specified and, among the 30,213 rows provided, there are no two single assemblies with roughly similar parameters (apart from those that differ only in quantity). Caterpillar, can determine the assembly cost by requesting quote from a supplier (RFQ). To request a quote, Caterpillar must provide detailed information about the features of the tube assemblies, and other purchasing volumes and conditions. Manufacturing costs largely depend on the features of tubes, which can vary across a large number of dimensions regarding the shape (diameter, wall thickness, length, number of bends, bend radius, or types of end-connections), materials, processes, or rust protection, along with those features of the components that are permanently attached to the tubes, such as bosses, brackets, adaptors, or other custom elements (Figure 3). Purchasing volumes affect manufacturing costs, through economies of scale and the industrial setup needed for the manufacturing process (batch sizes and shifts).
Figure 3. A typical tube assembly
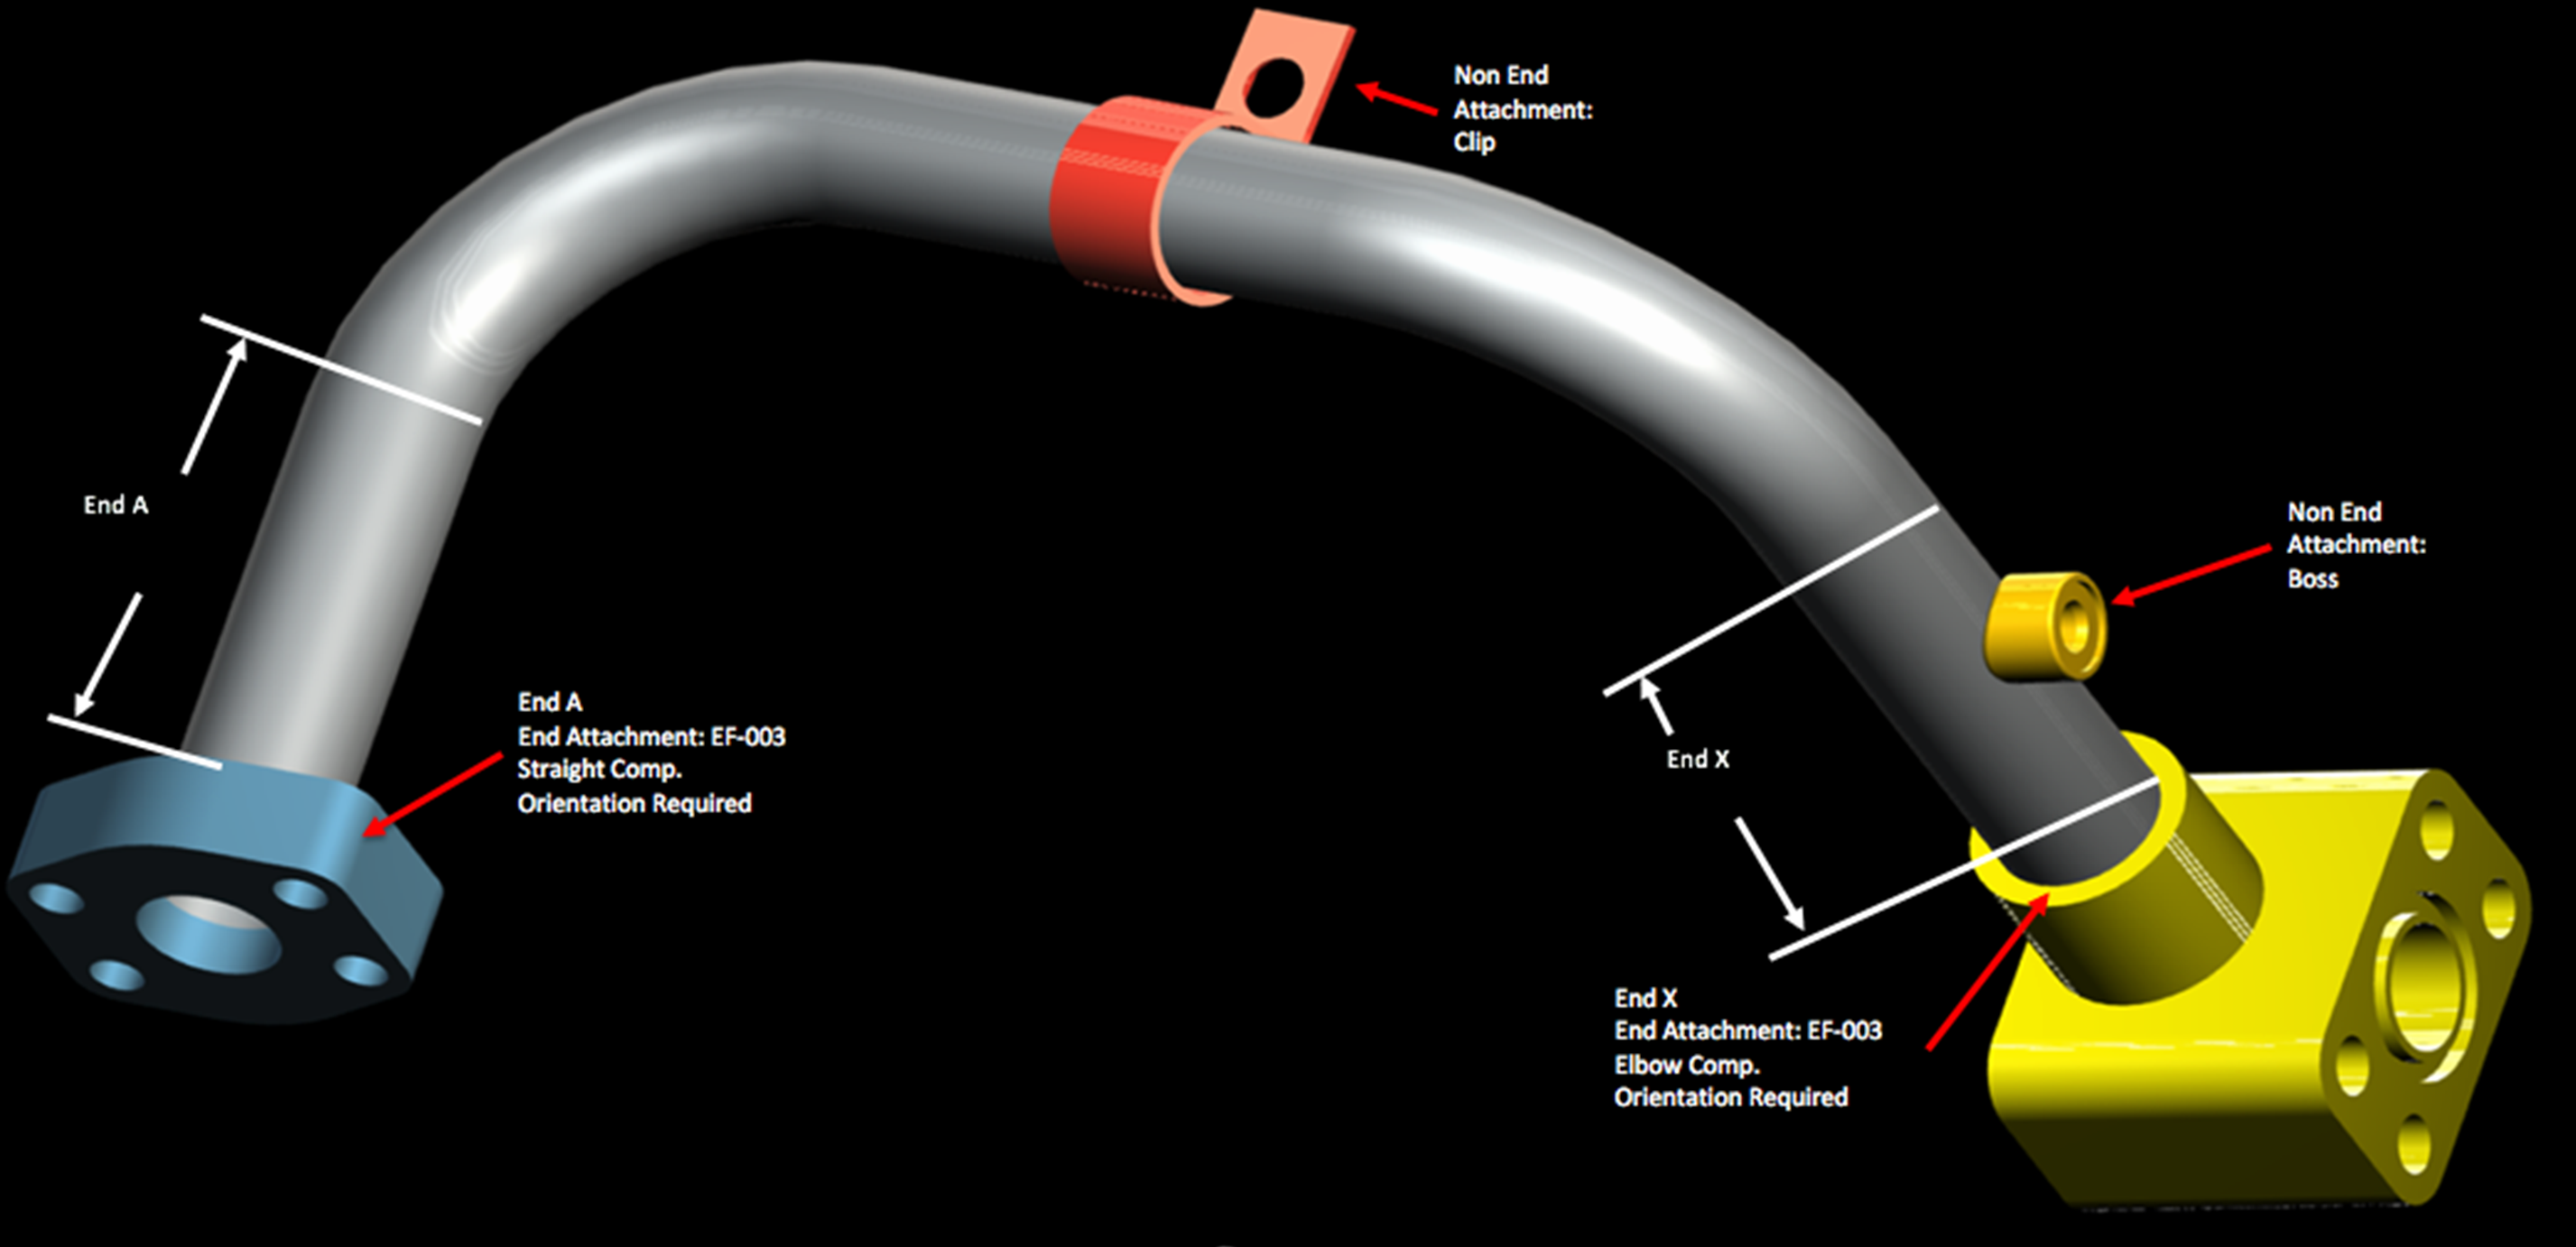
Source: https://www.kaggle.com/c/machinery-tube-pricing/overview.
Along with the supplier’s margin for all the added-value operations, and other elements affected by human factors during the quoting process, prices are affected by the application or non-application of ‘bracket pricing’ (multiple levels of quantity purchased). For example, see the head of the train_set 1.
Table 1. Head of the train_set
| tube_assembly_id | supplier | quote_date | annual_usage | min_order_quantity | bracket_pricing | quantity | cost |
|---|---|---|---|---|---|---|---|
| TA-00002 | S-0066 | 07-07-13 | 0 | 0 | Yes | 1 | 21.91 |
| TA-00002 | S-0066 | 07-07-13 | 0 | 0 | Yes | 2 | 12.34 |
| TA-00002 | S-0066 | 07-07-13 | 0 | 0 | Yes | 5 | 6.60 |
| TA-00002 | S-0066 | 07-07-13 | 0 | 0 | Yes | 10 | 4.69 |
| TA-00002 | S-0066 | 07-07-13 | 0 | 0 | Yes | 25 | 3.54 |
| TA-00002 | S-0066 | 07-07-13 | 0 | 0 | Yes | 50 | 3.22 |
| TA-00002 | S-0066 | 07-07-13 | 0 | 0 | Yes | 100 | 3.08 |
| TA-00002 | S-0066 | 07-07-13 | 0 | 0 | Yes | 250 | 3.00 |
Non-bracket pricing has, instead, a minimum order amount for which the price would apply. In addition, each quote is issued with an annual usage, an estimate of how many tube assemblies will be purchased in a given year—for example, this set of assemblies in the train_set table 2.
Table 2. Set of assemblies in the train_set
| tube_assembly_id | supplier | quote_date | annual_usage | min_order_quantity | bracket_pricing | quantity | cost |
|---|---|---|---|---|---|---|---|
| TA-00013 | S-0026 | 21-07-92 | 50 | 1 | No | 1 | 10.00 |
| TA-00021 | S-0030 | 10-02-14 | 1 | 1 | No | 1 | 3.43 |
| TA-00022 | S-0013 | 27-07-11 | 1 | 1 | No | 1 | 8.56 |
| TA-00048 | S-0026 | 01-09-09 | 180 | 20 | No | 1 | 2.94 |
In this customized industrial assembly, getting costs estimated brings about that the RFQ process is slow (days or even weeks for calls, explanations, documentation, technical and commercial interactions), it consumes resources (the time of engineers, sellers, buyers, logisticians), and it makes very difficult any modifications needed ‘on the fly’ after the quoting process has been launched. For manufacturers, this constrained process makes it hard to keep a competitive edge in a fast-changing business.
4.3. Data Science
Caterpillar has an excellent database, consisting of more than 60,000 quotes issued by numerous suppliers for thousands of different tube assemblies. However, this database is difficult to handle with classical management accounting tools. In this particular case, these data are ‘structured,’ as the information has a high degree of organization that can be classified by means of relational tables (e.g. dimensions, components, materials).
To measure the accuracy of the predicted costs (technically the ‘cost function’), Caterpillar applied the root mean squared logarithmic error (RMSLE) formula, instead of the traditional root mean squared error (RMSE). In this manner, they avoid penalizing big differences when the predicted prices and the actual prices are both big numbers—in other words, to give more importance to relative errors (percentage differences in prices) than to absolute ones (differences in prices):1
\[ \sqrt{\frac{1}{n} \sum_{i=1}^{n}(log(p_{i}+1)-log(a_{i}+1))^{2}} \]
where
- n is the number of prices to predict
- pi is the predicted price
- ai is the actual price
- log(x) is the natural logarithm
The winning team would score the lowest error through the RMSLE formula. More than 1300 teams of data scientists participated in the contest, applying different algorithms and approaches.
4.4. Selection, Training, Validation, and Stacking of Algorithms Performed by the Winning Team
Selecting the most appropriate machine learning algorithm depends on many factors: the size, quality, and nature of the data, the computational resources available, the urgency and the usage of the outputs. An expert data scientist does not know a priori which algorithm is optimal, and therefore must follow an iterative ‘trial and error’ approach to find the algorithm, or the combination of several algorithms (using ensemble or stacking techniques), that optimizes the expected result (in this case, the one that minimizes price errors according to the RMSLE function). Nevertheless, there are some clear factors in the problem that narrow the number of choices. First, as the data included output variables (price), the target algorithms must obviously belong to the family of supervised learning (a model prepared through a training process in which it is required to make predictions and is corrected when those predictions are wrong). The training process continues until the model achieves a desired level of accuracy on the training data. Second, as the outputs were numerical, the circle narrowed to regression algorithms. Finally, accuracy outperformed speed of computation, further reducing the number of choices.
Among the family of supervised learning algorithms for regression, those most popular used by participants in the contest, and those selected by the winning team, were the following:
Gradient Boosted Trees (XGBoost), which basically ‘boosts’ many weakly predictive regression trees (which are actually subsets of the problem) that output real values for splits, and whose outputs are added together into a strong one. When the subsequent models’ outputs are added, residuals in the predictions are corrected and the error formula (loss function) is optimized.
Regularized Greedy Forests, which optimizes a loss function as does Gradient Boosted Trees, but with a regularization term. In addition, it periodically readjusts the weights of each terminal node of the ensemble trees.
Neural Networks and Factorization Machines, which did not perform well alone, but were used to compose the final ‘ensemble.’
Once the most appropriate family of candidates was targeted, the analysts used data to train the algorithms (the 30,000 quotes in the ‘train’ set), checked their performance using the RMSLE formula, and kept those giving the best results, to try to improve the score by tuning up their parameters. Figure 4 shows the model validation process. The models cannot be validated using the ‘test’ data set, as those 30,000 additional references do not include prices because they are actually used to check the final performance of the predictive models and score the teams’ submissions. The validation was performed with the training data themselves. A common practice of cross-validation is to take a subset of the training data (e.g., 80% of the quotes), and use the rest (20%) to check performance. Even if the distribution performed randomly, it is possible to introduce some intelligence into the process. Whenever several references in the set referred to the same assembly, it became more convenient to base those folds on the assemblies’ IDs in order to ensure that references to the same assembly fell in the same fold. In contrast, even though the data formed a time series (as each quote was identified with a date), taking the date into account to perform the validation process did not improve the scores.
Figure 4. Model validation process
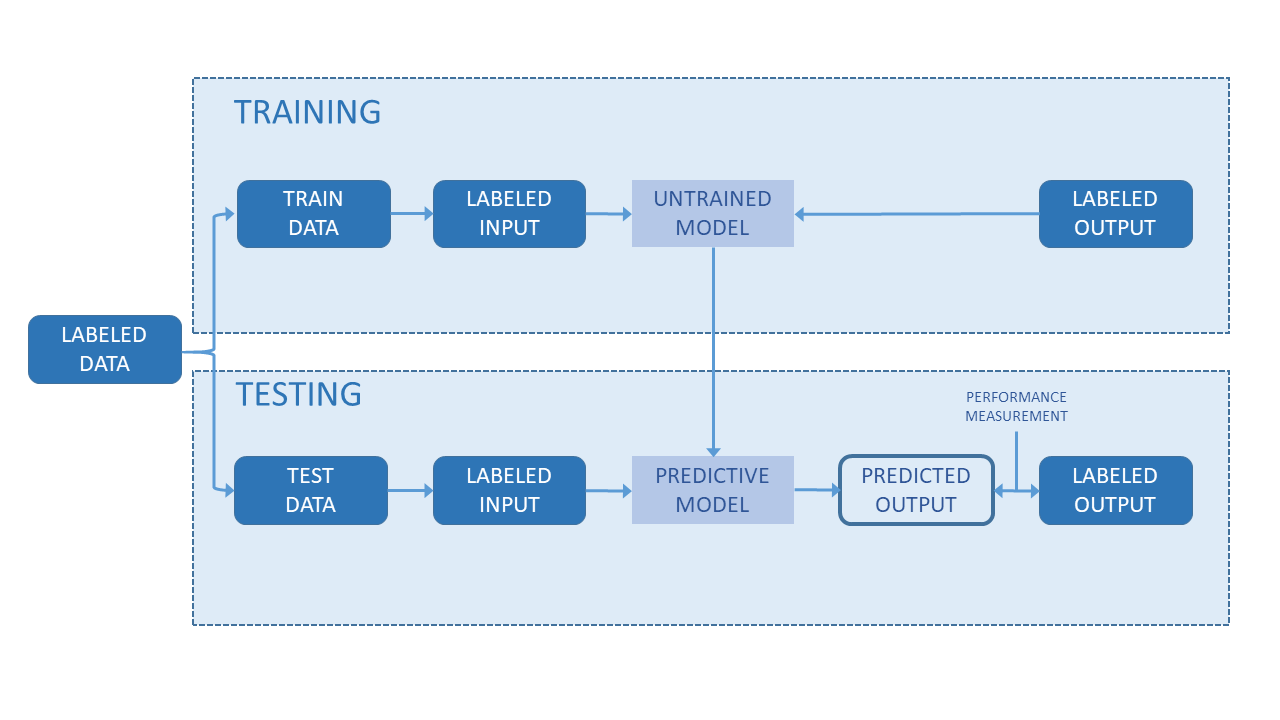
Source: Self-elaboration.
Finally, when it came to selecting the most appropriate algorithm, several algorithms yielding similarly good scores performed still better when combined (using ‘ensemble’ or ‘stacking’ techniques; see Figure 5). Moreover, while some algorithms provided weak results when applied individually, used in combination resulted satisfactory. In some cases, such combined algorithms outperformed individual ones. The winning team performed the evaluation on three levels. First level, the models were evaluated individually. Second, four models were evaluated, using the results of the first level to avoid overfitting. And finally, predictions of the second-level models were averaged to reach the final prediction.
Figure 5. Models stacking
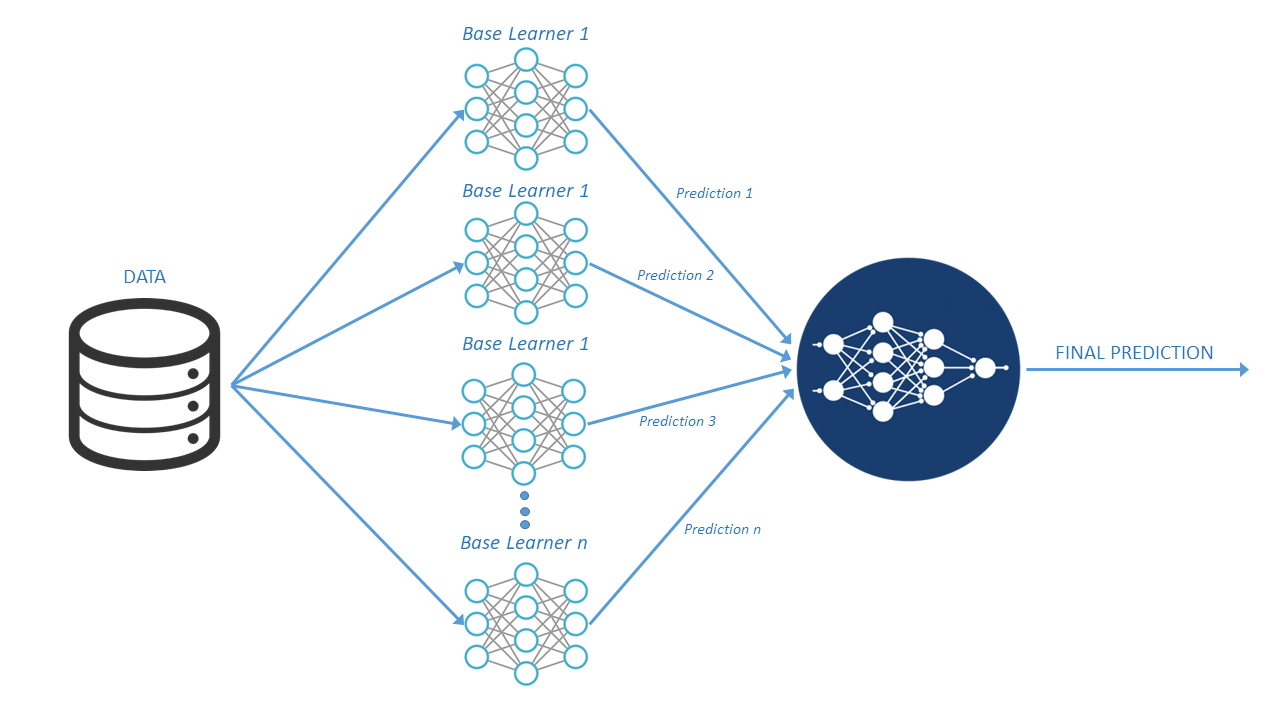
Source: Self-elaboration.
4.5. Bringing Accounting Expertise to the Predictive Model with ‘Feature Engineering’
All the listed features of a quote are not useful, but keeping them could add randomness to the results and can be a potential drawback. For example, suppliers can assign different name to the same component due to different internal nomenclature (threaded elbow):
Table 3. Example of same component with different name
| component_id | name | component_type_id |
|---|---|---|
| C-0912 | ELBOW-90 DEG | CP-015 |
| C-0974 | ELBOW-90 | CP-015 |
| C-1221 | ELBOW-90 DEGREE | CP-015 |
| C-1800 | ELBOW-90 DEG | OTHER |
Keeping this variable adds complexity to the models, increases the training time, contributes to the ‘curse of dimensionality,’ and contributes to overfitting. To avoid these issues, the analyst performs ‘feature selection’: the process of picking a subset of significant features to improve model construction. Feature selection is a delicate process, as apparently irrelevant variables may hide counter-intuitive relationships or patterns. And vice-versa: some variables, not necessarily present in this data set, could show spurious relationships in the training data but not in the test data, compromising the final performance. In addition to feature selection, analysts perform ‘Feature Engineering,’ which identifies data characteristics that could be transformed into variables to feed the model. In the case of cost estimation, this expertise is related to management accounting principles. For example, the weight of a component with low added value is usually correlated to its cost, as the cost of raw materials is a major cost driver in such components. Given the quantity and type of components used in each tube, it is possible to compute the sum of their weights, and importantly, such variable significantly correlated with the price. Furthermore, for most of the assemblies, the unitary price was strongly correlated with quantity, and this correlation can be expressed: \(price = a + \frac{b}{quantity}\), pointing to economies of scale for suppliers and related discounts.
Finally, for around 90% of the tube assemblies, the supplier proposed prices that varied with the purchased quantity: expensive tubes had lower minimum purchase quantities than cheaper tubes, due to, for example, manufacturing batch sizes and logistical issues. In this specific problem it is used feature engineering, the process that attempts to create additional relevant features from the existing raw features in the data, and to increase the predictive power of the learning algorithm. Feature engineering played a key role in developing the best performing models.
The contest rules made provisions for the role of accounting expertise and performing transformations (https://www.kaggle.com/c/caterpillar-tube-pricing/rules); the use of external data was not permitted. Introducing external data about prices and inflation rates for raw materials, energy, salaries, and exchange rates could certainly have helped algorithms to improve their estimation capabilities.
4.6. The Results
The contest lasted two months and 1,323 participating teams submitted as many as five predictions per day, which were automatically scored on the platform through the RMSLE formula to 30% of the test data. The scores were published on a ‘Public Leaderboard’ (https://www.kaggle.com/c/caterpillar-tube-pricing/leaderboard; see Figure 6). That iterative approach enabled the participants to better calibrate their algorithms.
Figure 6. First twelve teams in the Public Leaderboard at the end of the contest
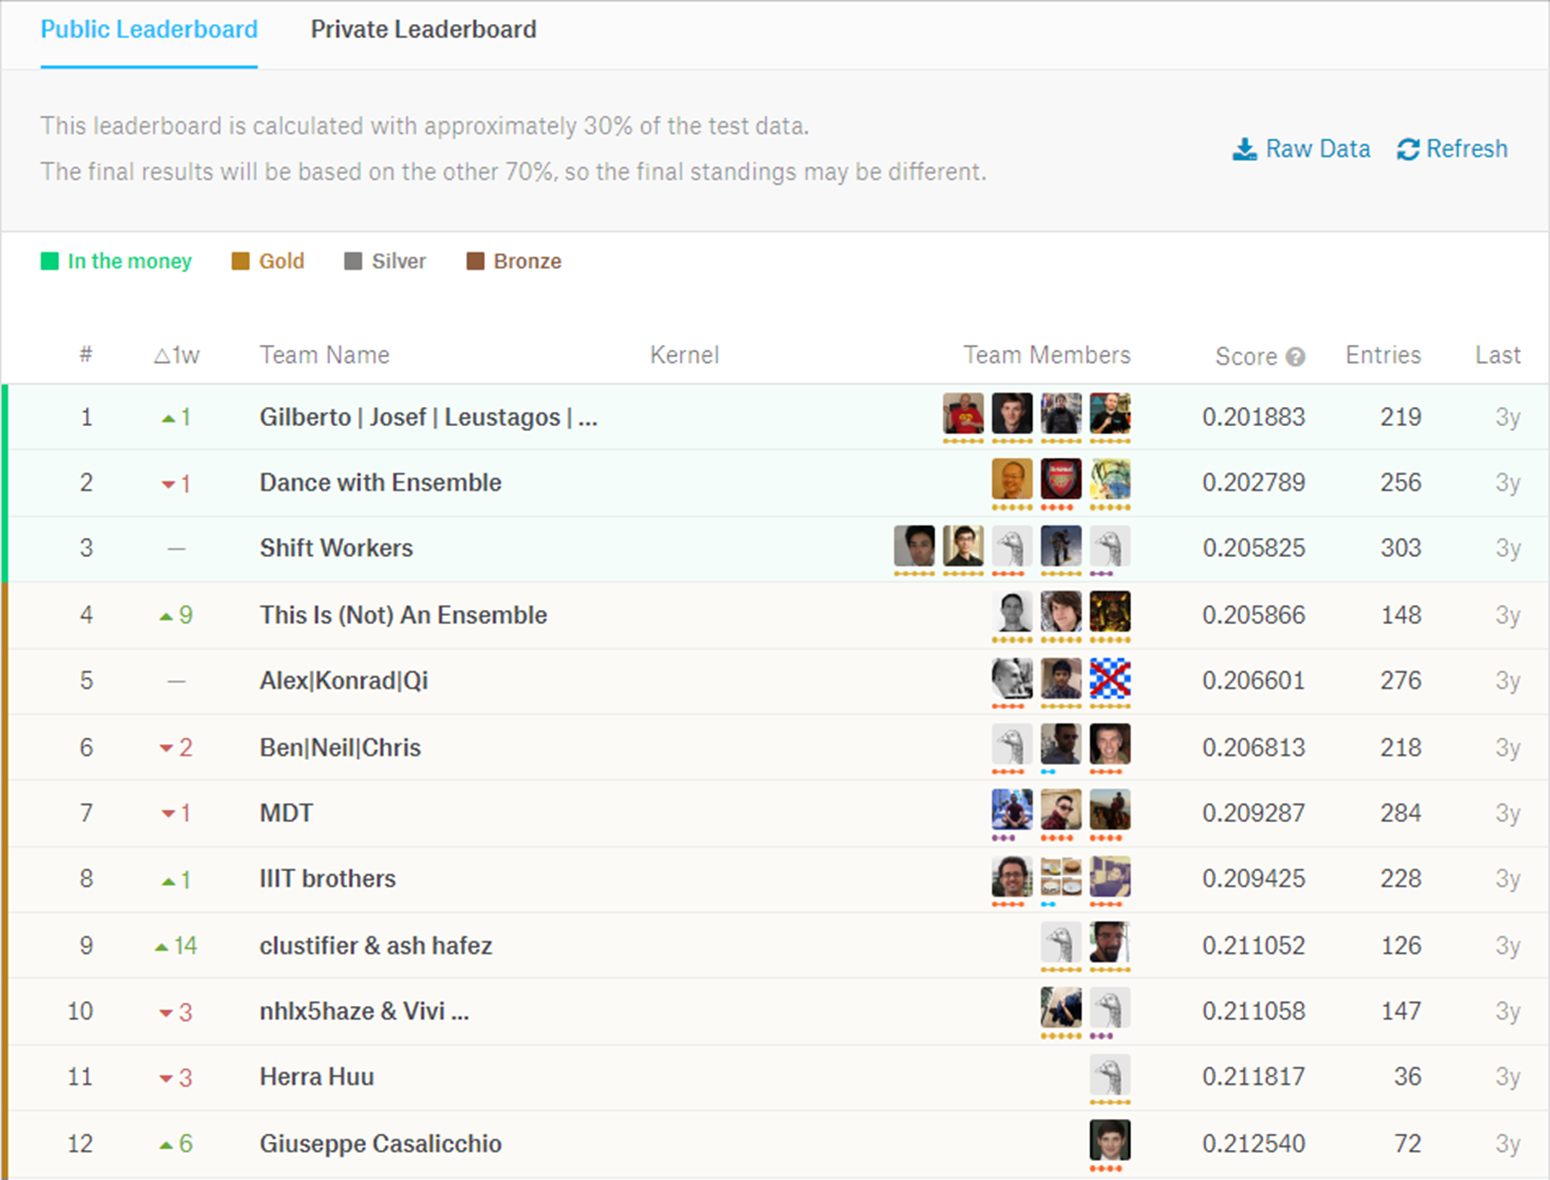
Source: https://www.kaggle.com/c/machinery-tube-pricing/leaderboard.
The final standing was reported on the ‘Private Leaderboard’ (see Figure 7).
Figure 7. First twelve teams in the Private Leaderboard at the end of the contest
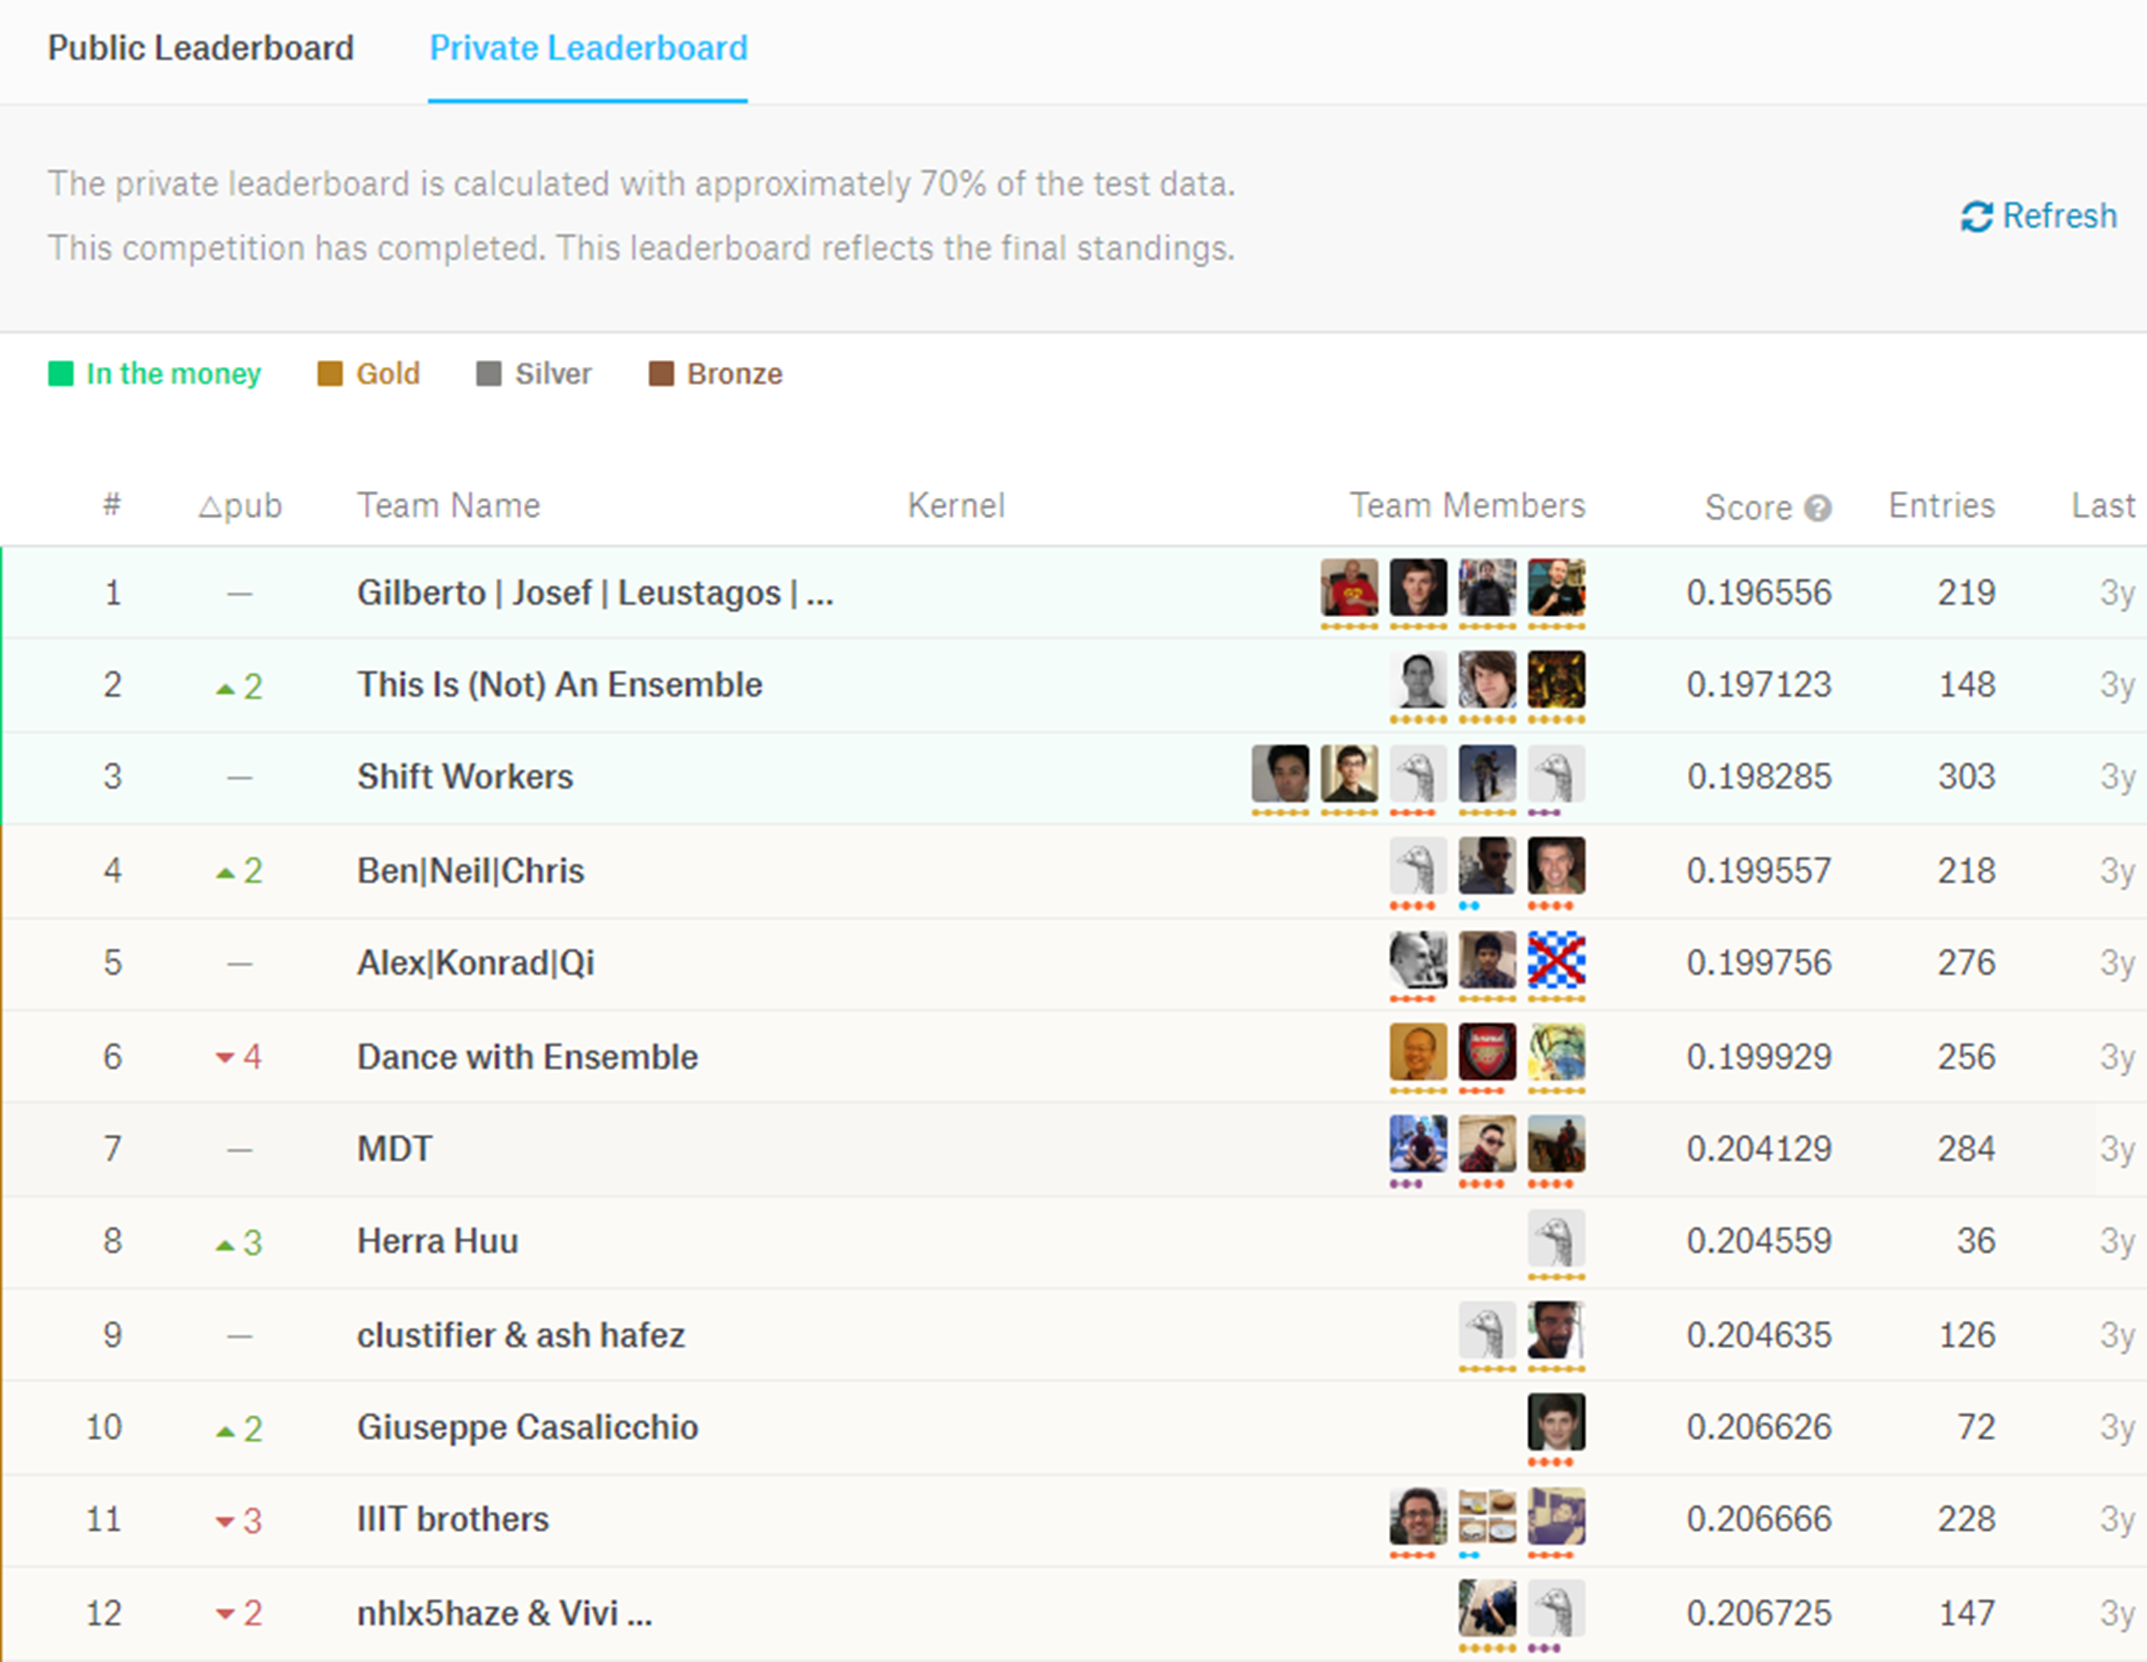
Source: https://www.kaggle.com/c/machinery-tube-pricing/leaderboard
The winning team2 surpassed with a score of 0.196556, which means that the average of the 30,000 predicted prices in the test set was within 21,7% of the average of the actual prices. As per the contest rules, the algorithms applied by the winning team were not disclosed (the source code being licensed to Caterpillar), but other participants published their codes (kernels) on the contest website (). Appendix 1 shows a code in R language, posted by a participant (), who scored 0.2748 by using a simple Random Forest machine learning algorithm3, without applying further feature engineering or ensemble techniques. In comparison, the winning team (Gradient Boosted Trees and Regularized Greedy Forests) used ‘decision trees’ algorithms, but with the additional capability of reducing bias, or ‘boosting.’ This approach provides a significantly less accurate result than the winning one, but constitutes a good illustration of how a simple machine learning algorithm is coded. Its output (assembly ID and price) can be found on the same website, and a sample of 40 results is shown in Appendix 2.
5. The Data Science Approach
5.1. Value of the Results in the Caterpillar Case
Along with the high dimensionality of the data, our focal case suggests the application of management accounting models and estimate cost rates, raw material costs, and overheads. First, the features are largely categorical—treatment of surfaces, the presence of components or customized features—and therefore require building many subsets of the problem. Those subsets would have a higher number of predictors than observations (p >> n, the ‘curse of dimensionality’). An attempt to apply classical statistical models (e.g., linear regression) would result in undetermined systems. Furthermore, the features present nonlinear dependencies: for example, manufacturing cost usually increases more than linearly the complexity of shapes and industrial operations. Modeling this behavior constitutes a complex task; if some variables affecting prices are influenced by human factors and hence difficult to model analytically (e.g., margins/discounts on volumes, features of the suppliers’ pricing models). Machine learning models precisely manage these difficulties. Now, the practical value of this approach can be questioned, given the accuracy reached by the winning team. But actually, the value provided is relative and depends on how the predictions are going to be used. In the case of a mass production phase of an industrial project, an error of 21.7% could be considered high, as that phase usually offers little room for manoeuvre to correct costs. However, the same error can be considered good enough for the design or early development phases of a large project, when real-time estimations of costs allow quick iterations during the design process, or sudden modifications at customer requests, requires agile responses to fast-changing contexts.
5.2. Data Science and Cost Estimation
This innovative approach to estimate costs has both advantages and limitations vis-à-vis traditional management accounting techniques. The prerequisite for applying this approach is the availability of large amounts of data to let machine learning algorithms capture relationships. Once the algorithms are trained, the generation of cost estimates for similar objects is extremely fast. Obviously, this represents an advantage over inquiries to suppliers, or even in-house management accounting estimations requiring databases of components, materials, processes, rates. Machine learning algorithms can capture hidden or non-obvious and nonlinear cost patterns embedded in quotes that may come from economies of scale, pricing and discount policies, and supply-chain schemes that can be hardly modelled through traditional accounting techniques. Those costs usually reflect the expertise of the agents involved in the quoting process, and are in consequence conditioned by human behaviour.
As noted above, an average deviation in cost estimates of around 20% may be acceptable or not depending on the use of the estimate. Should accurate estimations be needed, this approach would not be suitable. Nevertheless, it is very unlikely that any traditional analytical model could outperform these machine learning models using the same inputs. Only a direct request for quotation to the supplier could provide a better estimate.
As machine learning algorithms have been trained within the boundaries of the data provided, they may not perform well if an object is not similar to those in the data set. Even if the algorithms perform cost regressions, the prediction may be inaccurate or even wrong if extrapolated outside the known boundaries (larger or shorter parts, more components, significantly higher or lower weights), or if the laws governing relationships change (costs for operations increase more than linearly, because of exponential complexity). But, of course, these limitations also apply to traditional analytical models.
Also, as algorithms draw on historical data, if a new cost element is introduced into the estimation, say, a different manufacturing operation, components, the whole model should be trained again from scratch. In a traditional analytical model, a new cost element may be just added to the model if the accountant considers that its impact on the final cost is just additive. The algorithms hereby described apply what is technically called a ‘batch learning’ process that does not allow such manipulations, so the whole model must be re-trained. Another learning process, called ‘online learning,’ allows one to incrementally train the system by sequentially feeding the data instances, but it has the drawback of experiencing a continuous decline in performance and therefore is not very suitable for this kind of problem, though it works for situations where there are limitations of memory.
The limitations imposed by the boundaries of the data also entail a need for continuous updating with quotes such as updated prices of raw materials, labour costs, energy, logistics costs, and exchange rates if wishing to keep the accuracy for recent predictions. This is an intuitive as ten years old quote is not relevant for a new assembly taking into account that costs rates could have changed. Furthermore, changes also affected new manufacturing technologies or industrial schemes appearance, so the algorithms must be continuously fed to maintain their usefulness.
In addition to these practical limitations, the algorithms may arouse some scepticism. Traditionally, cost model estimation has relied on transparent techniques such as regression, averages, or other more modern statistical methods. Machine learning produces CER (cost estimation relationships) that are embedded inside ‘black boxes’. This opaqueness could arouse a backlash if decision makers request detailed lists of the assumptions in the estimation of costs.
In the end, the adoption of black-box models will ultimately be conditioned by mindset and cultural adaptations: for the same reason that accountants currently rely blindly on the reports and balance sheets generated by ERP and business intelligence platforms (SAP, Oracle, IBM), the modern accountant will also rely on the black-box models generated by machine learning platforms (e.g., IBM Watson, SAS, Domino, Microsoft Azure, Amazon AWS, Rapidminer, KNIME, H2O.ai, Dataiku).
6. Concluding Remarks and Further Research
Management accounting will change the way it is built in the next years. Data science will be modulating the way management accountants provide the information for decision-making processes. There will be a replacement and integration of simple modeling policies into models of advance statistical data allowing managers to make changes and test even small theories (Steen, 2018).
In this study we wanted to highlight the potential applications of data science to management accounting, and more particularly to cost estimation, through the analysis of a focal case in a traditional industry in order to prove that these techniques are applicable in our discipline. Data science evolves as a strategic approach in business management areas, as a lever of competitive advantage. Indeed, big data analytics represents one of the main levers of transformation in the roadmaps of chief financial officers (PwC, 2018; see Figure 8).
Figure 8. PwC Survey: Chief financial officers—Priorities in 2018
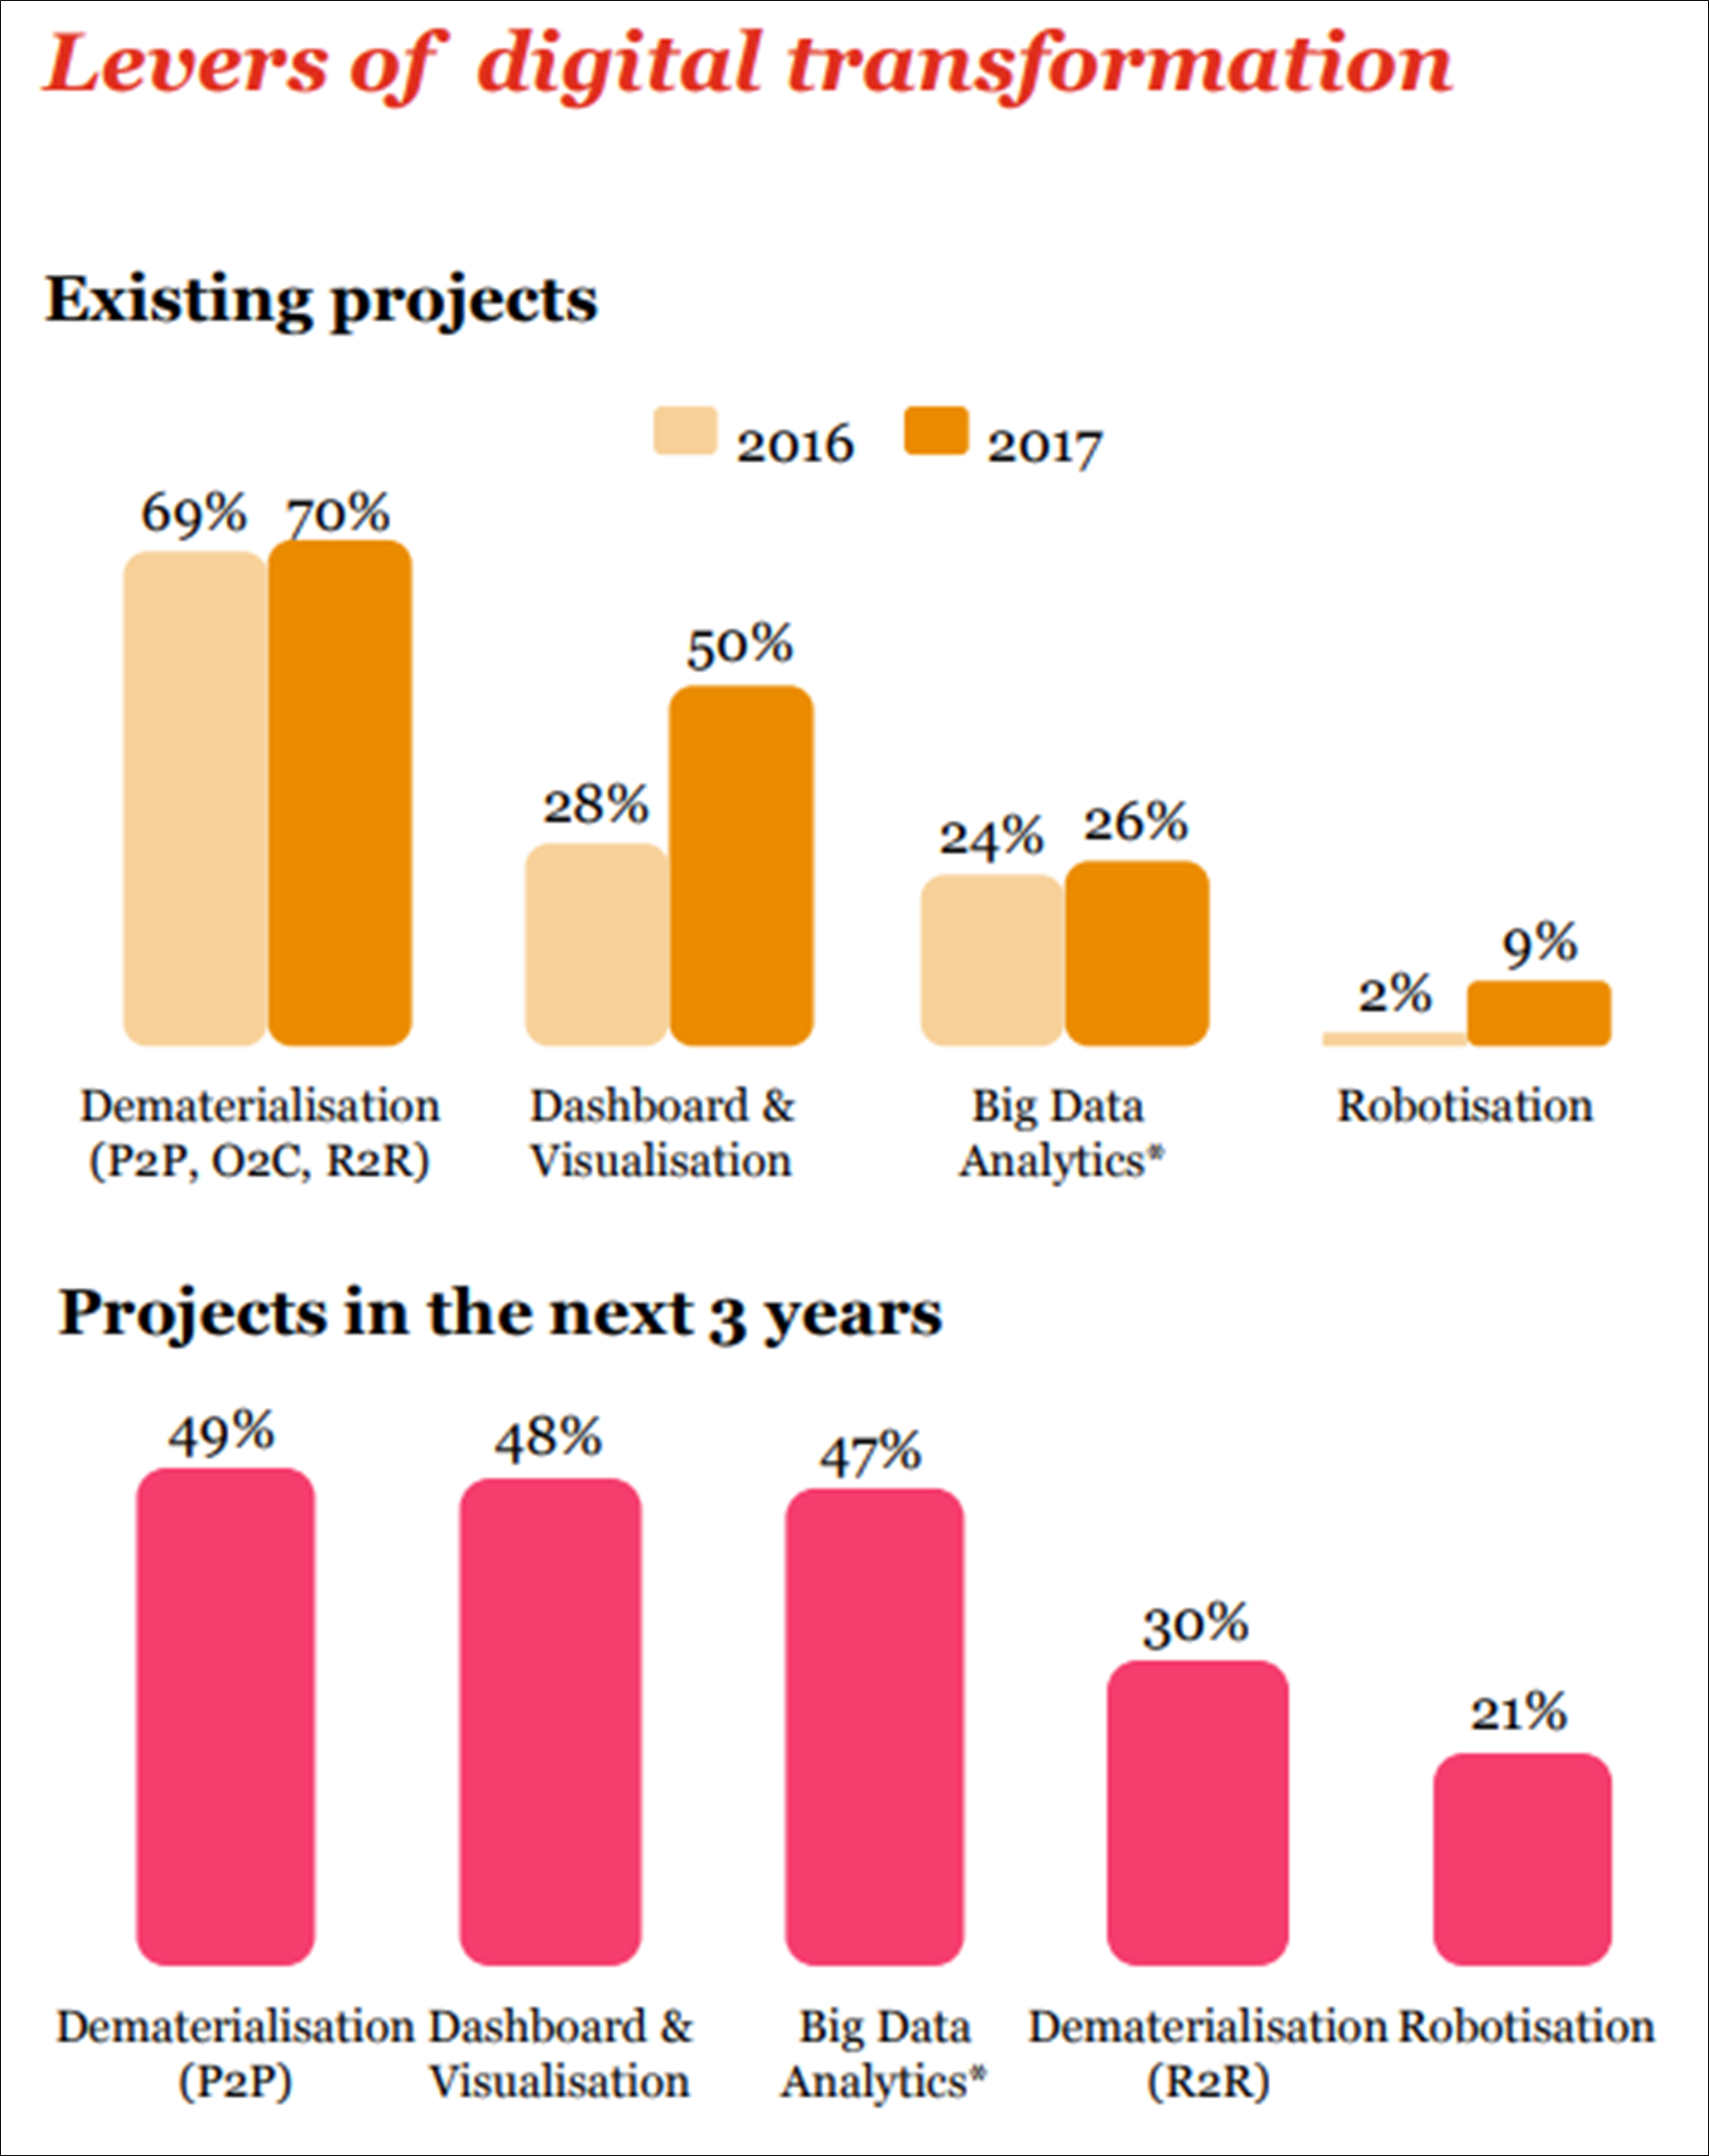
Source: PwC, 2018.
This strategic approach makes it difficult to find publications about specific applications of data science to business processes at companies, and still more difficult in the field of management accounting.
Our analysis of the Caterpillar case indicates that data science is useful when accounting relationships are not obvious, and where the accounting process is highly dependent on the human behavior of expert analysts. While the opaqueness of machine learning models could bring about some resistance, it has not impeded their acceptance in some fields of empirical science and in some social sciences like economics or finance. In those fields many applications are arising analysing the impact of financial distress or developing financial fraud modelling, quantitative modelling, and auditing (Gepp et al., 2018). Therefore, the lack of access to the way the algorithms work, the opaqueness, is not a reason to think that this system could not be assimilated by analytical accounting doctrine.
Despite all the formal, robust, and widely proven techniques of validation, which allow accountants to rely blindly on opaque machine learning models, some authors argue that accountants need to be trained in data science (McKinney et al., 2017). For example, as shown in the Caterpillar case, the accountant’s expertise can greatly improve estimation accuracy by helping the machine learning process to discern the underlying physical relationships. Therefore, the role of management accountants is evolving, and for them to use big data (Warren et al., 2015). Our focal case featured cost estimation for outsourced parts. However, data science could also be used to estimate costs for in-house processes. Nevertheless, most companies with complex industrial processes, even those with good ERP resources, must frequently perform manual or semi-automatic calculations to estimate costs because of the complexity of the processes, relying in consequence on human expertise. As shown in our focal case, machine learning algorithms may capture such expertise. Using those algorithms could help companies save important resources and gain reactivity and speed.
Using a huge amount of data to create strong benchmarks for calculation of cost and prices can benefit global companies operating with a variety of costing methods. An accounting system that can store unit cost data in different currencies on a real-time basis will allow the company to more effectively control costs and make budgets (Tang & Karim, 2017).
Further, big data could be useful for allocating indirect costs. Activity Based Costing is considered a well-regarded practice for allocation. However, identifying the ‘real’ activity cost drivers still is a problem because of errors and the omission of relevant factors. Big data can provide assistance in this task by collecting relevant information through interviews with employees and surveillance videos to better identify the activities driving the overhead. Managers can also base trend analyses on past relationships between activities and in-house costs or industry averages to predict future cost drivers (Tang & Karim, 2017).
Beyond the manufacturing context, the machine learning approach could be also applied to the services sector in the same way. If the services provided by a company are complex and difficult to allocate to individuals, the related management accounting is also complex, and the mechanisms to compute the cost of the services may likely include manual inputs provided, again, by expert agents involved in the quoting. In sum, the data science approach can be applied to management accounting contexts where (1) hidden or non-obvious relationships are present in the management accounting structure, (2) those relationships are accounted for by human expertise, and (3) there are enough data to train the algorithms. The implementation of data science by the organizations will double in the years coming. For completing this transformation in the best way, they need to have the experience of the profession and the support of the higher educational institutions.
The profession needs to adapt to the new times and work together with the data analysts in exploring the possibilities of the massive usage of information for strategic and operating decisions. We will have access in the future to an unpredictable set of qualitative information that will enhance the way managers make decisions, and still, this constitutes part of management accounting. Recently, the Institute of Management Accountants (IMA) in the United States has announced the intention to update the Certified Management Accountant (CMA) exams with more “tech focus” starting in January 2020. They are introducing more data analytics questions as a result of a job analysis performed with professionals of management accounting. The analysis showed the importance of covering these technological challenges that professionals are starting to face nowadays (Cohn, 2019).
There is an urgent need to adapt the curricula of management accounting subjects, both in bachelors and at the master level, to introduce topics related to the production and use of data science. Students need to be aware of what is nowadays starting to be a reality in the organizations of our environment. And once more, management accounting cannot lose this time its relevance. Top educational institutions, like the Massachusetts Institute of Technology (MIT), introduce topics related to data science and management accounting in their curricula. As an example, MIT in its “Applied Business Analytics” executive program, include a module devoted to helping decision making over inventory management with machine learning.
APPENDIX
Appendix 1: A participant’s code in R that scores 0.2748 applying a Random Forest algorithm
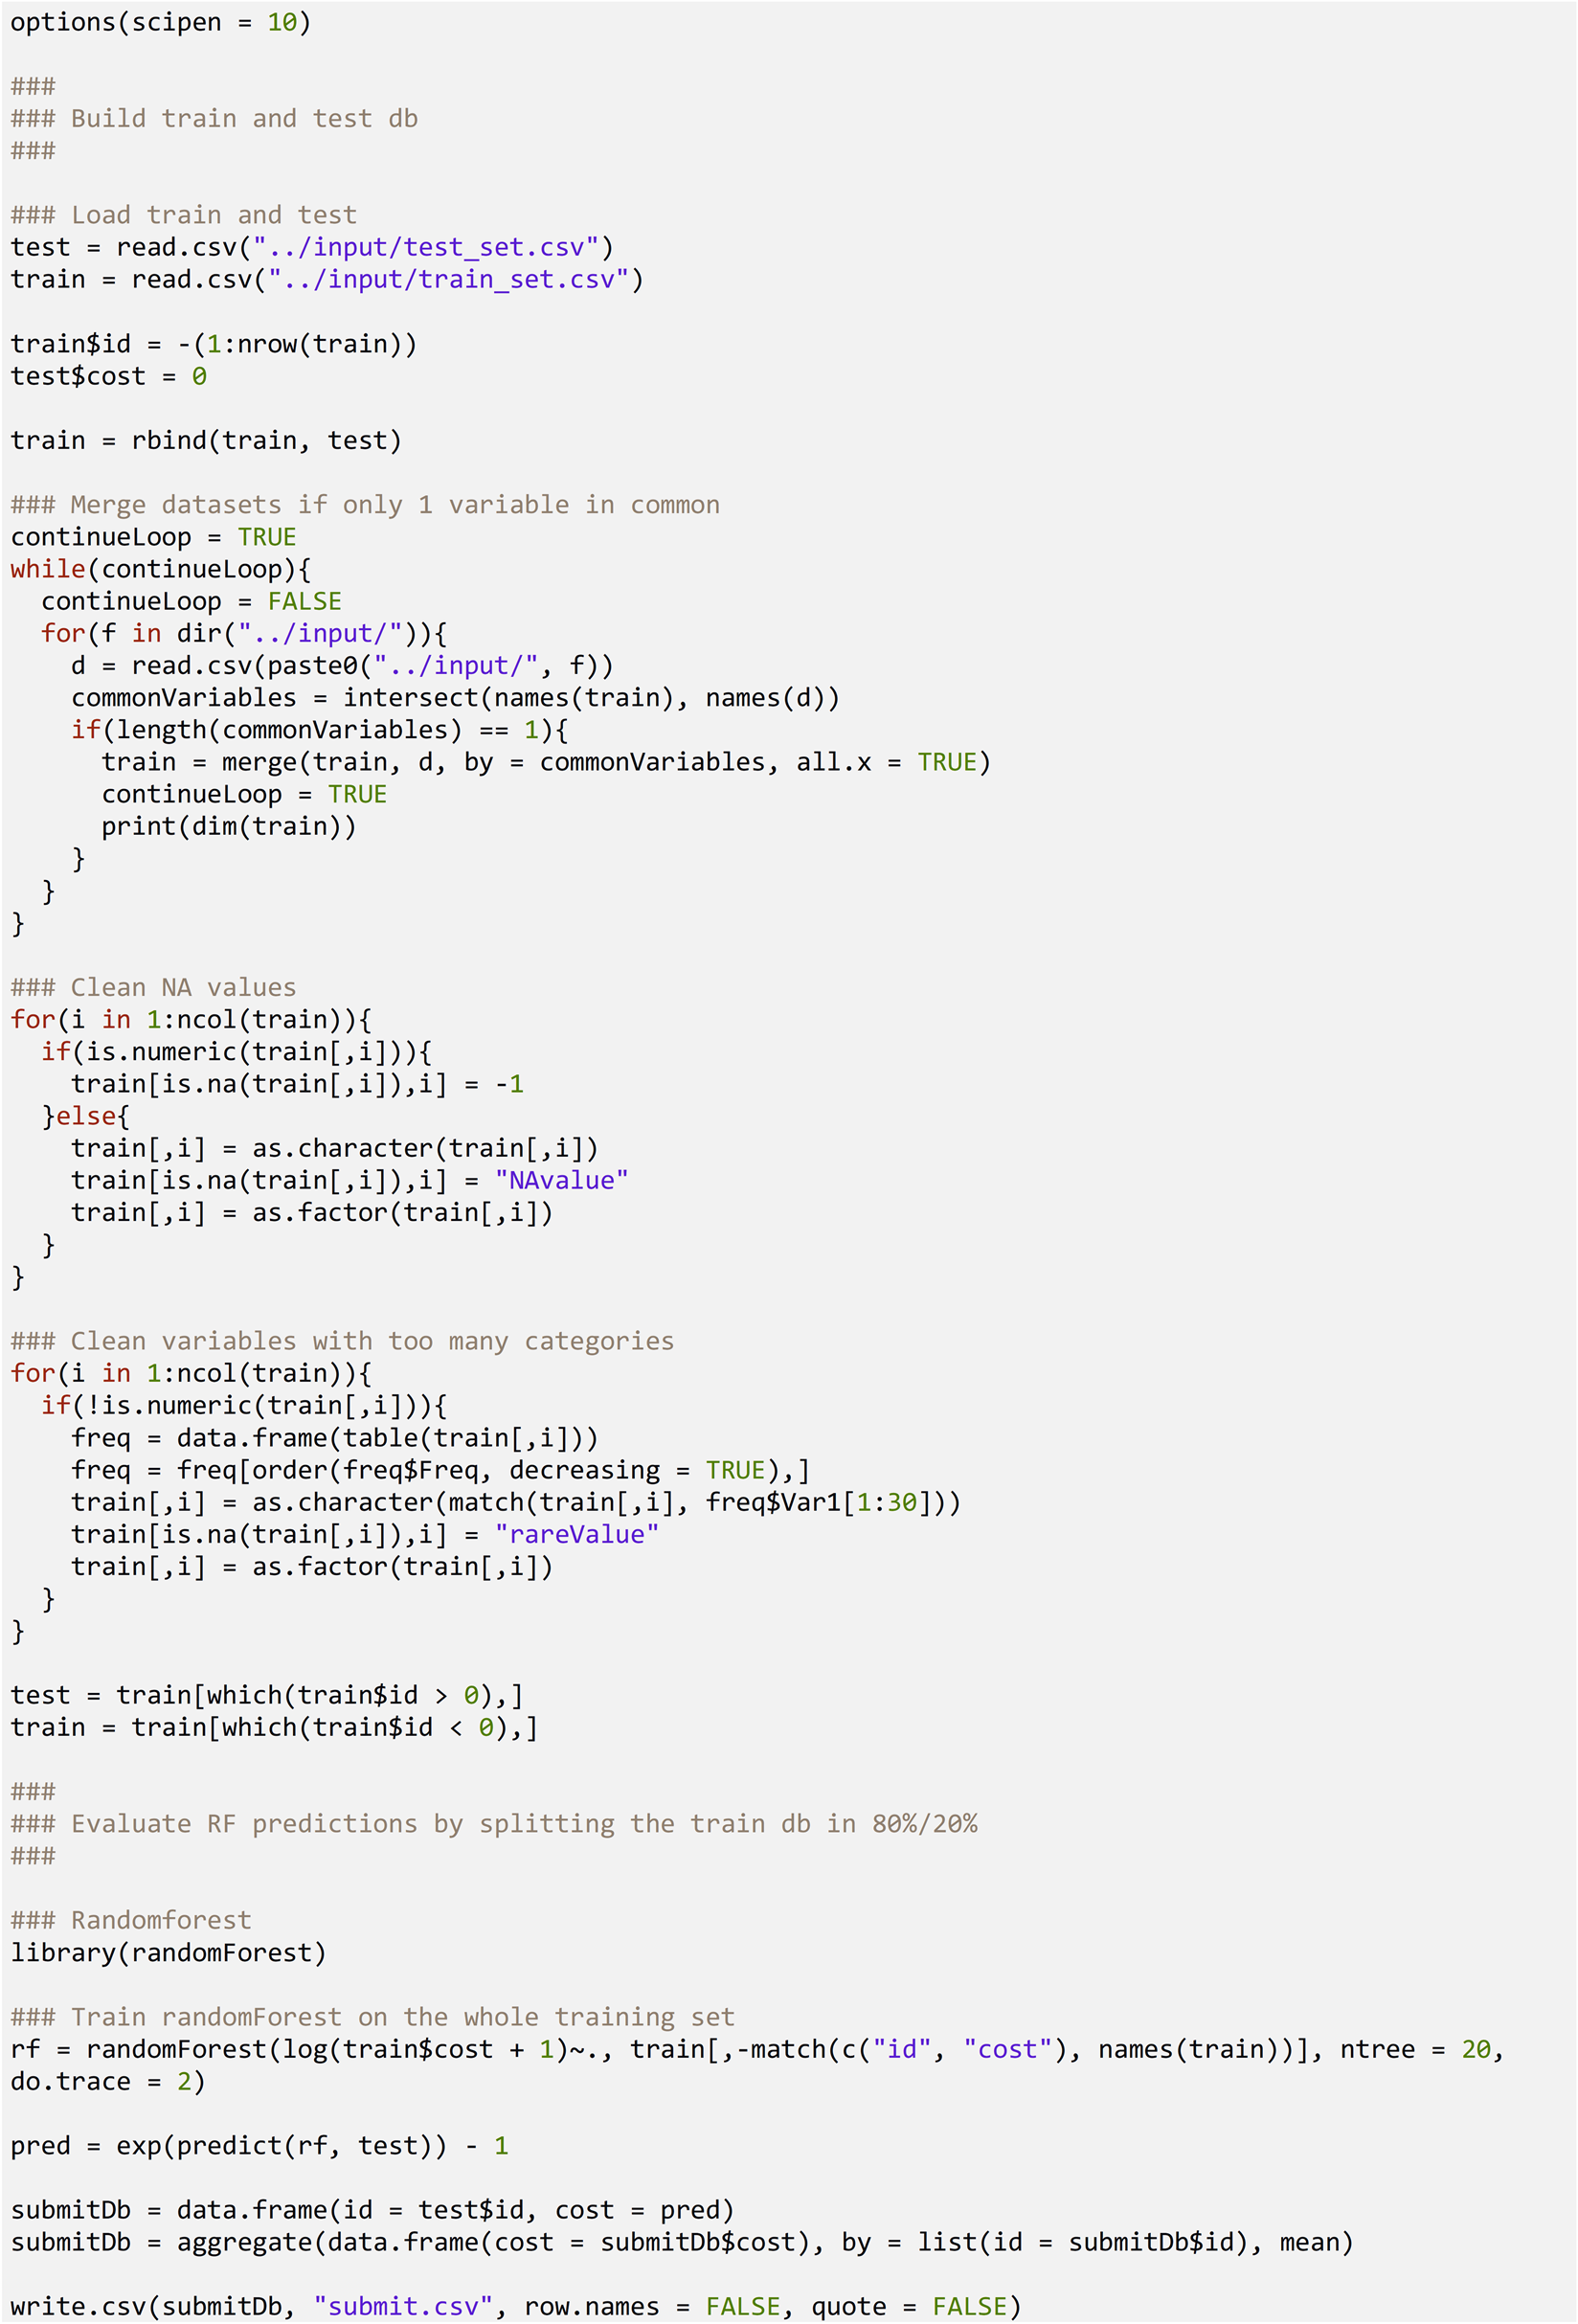
Source: https://www.kaggle.com/ademyttenaere/0-2748-with-rf-and-log-transformation.
Appendix 2: Sample of the submission file generated by the Random Forest algorithm of Appendix 1
| ID | PRICE |
|---|---|
| 1 | 22.1 |
| 2 | 13.0 |
| 3 | 7.1 |
| 4 | 5.4 |
| 5 | 4.2 |
| 6 | 4.0 |
| 7 | 3.9 |
| 8 | 3.8 |
| 9 | 21.7 |
| 10 | 11.9 |
| 11 | 6.5 |
| 12 | 4.6 |
| 13 | 3.4 |
| 14 | 3.1 |
| 15 | 3.0 |
| 16 | 2.9 |
| 17 | 27.7 |
| 18 | 16.0 |
| 19 | 9.3 |
| 20 | 6.8 |
| … | … |
| 30216 | 48.6 |
| 30217 | 27.2 |
| 30218 | 18.5 |
| 30219 | 12.2 |
| 30220 | 9.2 |
| 30221 | 6.2 |
| 30222 | 5.6 |
| 30223 | 5.6 |
| 30224 | 5.5 |
| 30225 | 10.4 |
| 30226 | 10.6 |
| 30227 | 6.5 |
| 30228 | 5.5 |
| 30229 | 30.0 |
| 30230 | 5.4 |
| 30231 | 9.7 |
| 30232 | 7.0 |
| 30233 | 10.3 |
| 30234 | 32.3 |
| 30235 | 29.3 |