The Impact of Corporate Social Responsibility on Regulatory Comment Letters: Evidence from Iran
ABSTRACT
Securities commissions regularly review corporate reports, and if the review reveals a possible deficiency— such as a potential accounting error— or requires further clarifications, they send the company a comment letter (CL), including a request for providing written responses and relative additional information. Current study aims to examine whether and how corporate social responsibility (CSR) affects CLs. This empirical study is based on a sample of 437 Iranian firm year observations from 2011 to 2017. Results show that firms with more CSR are less likely to receive CL, that more CSR does not influence the association of managerial misbehavior and CLs, and that the negative association between CSR and CLs is stronger among firms facing higher environmental information asymmetry and firms having higher corporate governance quality. Collectively, this paper contributes to the literature by providing new evidence on the beneficial effect of CSR in the context of CLs.
Keywords: CSR, Oversight, Comment letter, Spillover effect, Managers, Emerging markets.
JEL classification: G12, G14, G18, M48.
El impacto de la responsabilidad social de las empresas en las cartas de comentarios regulatorios: Evidencia de Irán
RESUMEN
Las comisiones de valores revisan periódicamente los informes de las empresas, y si la revisión revela una posible deficiencia -como un posible error contable- o se requiere más aclaraciones, envían a la empresa una carta de comentarios (CL), que incluye una solicitud de respuesta por escrito y la relativa información adicional. El presente estudio pretende examinar si la Responsabilidad Social de las Empresas (RSE) afecta a las cartas de comentarios y cómo lo hace. Este estudio empírico se basa en una muestra de 437 observaciones anuales de empresas iraníes desde 2011 hasta 2017. Los resultados muestran que las empresas con más RSC tienen menos probabilidades de recibir CL y que más RSC no influye en la asociación entre mal comportamiento de los directivos y CL. También se pone de manifiesto que la asociación negativa entre RSC y CL es más fuerte entre las empresas que enfrentan una mayor asimetría de información ambiental y las empresas que tienen una mayor calidad de gobierno corporativo. En conjunto, este trabajo contribuye a la literatura aportando nuevas pruebas sobre el efecto beneficioso de la RSC en el contexto de las CL.
Palabras clave: RSC, Supervisión, Carta de comentarios, Efecto indirecto, Gestores, Mercados emergentes.
Códigos JEL: G12, G14, G18, M48.
1. Introduction
Corporate social responsibility (CSR) describes a company’s commitments in caring for the social-environmental dimensions of its operations (e.g., Paredes-Gazquez et al., 2016; Brooks & Oikonomou, 2018; Larrán et al., 2018; Tan et al., 2020). Literature (e.g., Dhaliwal et al., 2012; Deng et al., 2013; Elliott et al., 2014; Naughton et al., 2018; López-González et al., 2019; Tomas Siueia & Wang, 2019), indicates that through CSR, companies display their corporate transparency, signal their managerial integrity and future financial performance, improve their corporate reputation, and protect value for the shareholders (e.g., Dhaliwal et al., 2012; Deng et al., 2013; Elliott et al., 2014; Christensen, 2016; Paredes-Gazquez et al., 2016; Brooks & Oikonomou, 2018; Larrán et al., 2018). Thus, information about CSR performance has become increasingly useful to stakeholders in their decision-making.
Despite the usefulness of CSR for decisions of various stakeholders — such as financial analysts (e.g., Dhaliwal et al., 2012), shareholders (e.g., Dhaliwal et al., 2011), creditors (e.g., Tan et al., 2020); employees (e.g., Christensen et al., 2017), customers (e.g., Servaes & Tamayo, 2013) and corporate managers (e.g., Christensen, 2016)— there is relatively little empirical evidence regarding the usefulness of CSR for decisions or actions of regulators, especially regulators in capital markets (e.g., Liu et al., 2018).
To address this research gap, this paper aims to study the impact of CSR on the intensity of regulatory oversight provided by securities commissions. Specifically, the paper investigates whether variation in CSR affects the issuance of comment letters (CLs). The CL as one of the most important oversight mechanisms for securities commissions (e.g., Brown et al., 2018; Cassell et al., 2019), is a letter from a securities commission that is sent to a company, when the securities commission identifies a possible deficiency, such as a potential accounting error, or requires further clarification (Brown et al., 2018; Cassell et al., 2019; Cunningham et al., 2020). In this regard, current study will theoretically discuss and predict that securities commission uses CSR as a “heuristic cue” (e.g., Linthicum et al., 2010; Fernbach & Rehder, 2013; Chen et al., 2015) and therefore, firms with more CSR are less probably to be scrutinized and less likely to receive a CL. This paper uses CLs issued by the Securities and Exchange Organization (SEO) of Iran. Consequently, the research sample contains companies listed on the Iranian capital market over the period 2011 to 2017. This is an appropriate research setting because of the following reasons. On the one hand, while CSR disclosure worldwide is still predominantly unaudited (e.g., Cohen & Simnett, 2015; Carey et al., 2017), in Iran, external auditors must review CSR information to obtain moderate assurance as to whether the disclosures are free of material misstatement (SEO, 2007). Therefore, the reliability of CSR information in Iran is relatively high. On the other hand, SEO is under very high workload pressure, because SEO in the last line of defense in policing corporate reporting quality should compensate for the poor institutional setting (e.g., Hesarzadeh, 2020). Further, in Iran’s capital market, similar to other developing capital markets, it is not easy to access the diverse sources of information (Su et al., 2014). These characteristics make SEO rely more on CSR and its signaling effect. In addition, the Iranian capital market contains not only mature, large companies, but also a significant proportion of young, small companies. Hence, this research setting enables us to generalize research results to a variety of cases, ranging from high-growth, young and small companies to stable, large and mature companies.
Results show that CSR negatively affects CLs, and that the negative association between CSR and CLs is stronger among firms that face higher environmental information asymmetry and firms with higher corporate governance quality. The paper also documents evidence consistent with the spillover effect of CSR, in the sense that more CSR of peer firms increases a firm’s CL. Collectively, the findings provide evidence on the internalities and externalities of CSR in the context of CLs. This study makes important contributions. On the one hand, the study enriches the literature on the consequences of CSR (e.g., Dhaliwal et al., 2011; Brooks & Oikonomou, 2018; López-González et al., 2019; Tomas Siueia & Wang, 2019). Further, this study extends the literature by presenting evidence on how the consequences of CSR may be reinforced. On the other hand, this study extends the stream of research has formed to explore the determinants of public enforcement. Particularly, the study enriches the emerging literature (e.g., Robinson et al., 2011; Cassell et al., 2013; Johnston & Petacchi, 2017; Ballestero & Schmidt, 2019) on the determinants of receiving CLs by introducing a new factor (i.e., CSR) that reduces CLs.
2. Literature Review and Hypothesis Development
2.1. Corporate Social Responsibility
In recent decades, few topics have drawn more attention from practitioners than CSR (Bae et al., 2020). Unruh et al. (2016) report that approximately 90% of top managers believe that CSR is vital to remaining competitive. Academics scholars have responded to this burgeoning interest, spurring a large body of literature, with most attention given to understanding the association of CSR and diverse economic consequences.
Briefly, the scholars suggest that the value of CSR majorly lies in corporate reputation (e.g., Flammer, 2013; Golden et al., 2018), and this corporate reputation leads to diverse favorable outcomes such as better consumer support (e.g., Lev et al., 2009), better choice between bank debt and public debt (Tan et al., 2020), the decrease of cost of equity (e.g., Dhaliwal et al., 2012), and the increase in firm value (e.g., Harjoto & Jo, 2015).
Compared to these functions, the risk management functions of CSR are less discussed and have few empirical investigations (Francis & Armstrong, 2003; Peloza, 2006; Bonsón & Bednárová, 2015). From a risk management perspective, CSR can provide insurance‐like protection during difficult times (Bae et al., 2020). For example, CSR can minimize any reactions and penalties when a firm is facing the exposure of wrongdoing (Bonsón & Bednárová, 2015). As Kytle & Ruggie (2005) mention, CSR is related to risk management through two mechanisms: by providing intelligence about what those risks are and by offering an effective means to respond them. The key to both is more effectively managing stockholder relationship. Specifically, in the event of a crisis, the moral capital accumulated through CSR can help decouple any illegitimate activity from the rest of the organization (Bansal & Clelland, 2004). Further, CSR influences consumers’ attributions of blame when there is a product crisis, and that CSR reduces negative brand evaluations (Klein & Dawar, 2004). In this regard, Godfrey (2005) demonstrates that better CSR provides some degree of insurance protection against the risk of market, political, regulatory, and social sanctions when negative corporate events occur. Hong & Kacperczyk (2009) find that firms with irresponsible behavior face a higher level of litigation risk than other firms. Similarly, Starks (2009) and El Ghoul et al. (2011) find that stakeholders perceive socially irresponsible firms as high risky firms. Relatedly, Koh et al. (2013) show that, for firms with a high risk of securities litigation, CSR has a positive effect on firm value due to its ex ante insurance against the risk of securities lawsuits. However, the authors do not explicitly test whether CSR reduces the probability of securities class action lawsuits. Distinct from the aforementioned research, I examine whether CSR has implications for CLs, an important attribute of firms’ regulatory risks.
CSR may also protect companies against negative events whose causes are purely external. In this regard, Schnietz & Epstein (2005) show that a reputation for social responsibility protect a firm’s stock price in the general decline associated with the collapse of World Trade Organization talks in Seattle in 1999.
Regarding CSR in Iran, comparable to the most of countries, it is a voluntary activity. Iranian companies that tend to report their social activities usually follow the SEO guideline on CSR reporting. This guideline, comparable to other regulations in the world — such as Directive 2014/95/EU (European commission, 2014) — covers information on the policies which companies implement in relation to the environmental protection, social responsibility and treatment of employees, anti-corruption and bribery, and diversity on company boards. Furthermore, the guideline encourages companies to report the aforementioned information in section Management discussion and analysis (MD&A) of annual reports. In accordance with Regulations on Disclosure of Information (SEO, 2007), external auditors must review MD&A to obtain moderate assurance as to whether the disclosures are free of material misstatement. For this reason, the reliability of CSR in Iran is relatively high. Empirical research (Jalili & Gheisari, 2013; Fakhari et al., 2017; Ghaderi et al., 2019) indicates that CSR is important for Iranian market players. For example, Fakhari et al. (2017) shows that CSR reduces information asymmetry and increases investment efficiency.
2.2. Regulatory Comment Letters
Securities commissions have designed the regulatory review process to protect investors (Duro et al., 2018). They periodically review financial statement filings to ensure compliance with disclosure requirements, and if a filing is deemed to be deficient in some way or if the securities commissions desire further information, they issue CLs to companies to require changes to publicly reported information or request additional information (Bills et al., 2019). Consequently, companies should provide written responses and relative additional information (Cunningham et al., 2020; Brown et al., 2018).
Research about how companies craft responses to securities commissions inquires is limited, likely due to the inability of researchers to gain insight into such process (Ballestero & Schmidt, 2019). Recently, Cassell et al. (2019) investigate the association between the readability of companies’ responses to regulatory comment letters, and find that companies having less readable responses face higher remediation costs.
In turn, the research has investigated the determinates and consequences of receiving a CL. Research on the determinates of receiving a CL (e.g., Robinson et al., 2011; Cassell et al., 2013; Johnston & Petacchi, 2017; Ballestero & Schmidt, 2019; Hesarzadeh and Rajabalizadeh, 2020) provides evidence that CL receipt is more likely for companies that are large, older, more volatile, unprofitable, complex, engage smaller auditors, have recent IPO, or have weak corporate governance, managerial ability, and financial reporting. Furthermore, research on the consequences of receiving a CL (e.g., Gietzmann & Pettinicchio, 2014; Bozanic et al., 2017; Johnston & Petacchi, 2017; Brown et al., 2018; Duro et al., 2018; Cassell et al., 2019; Yao & Xue, 2019; Cunningham et al., 2020) suggests that, in general, a CL improves information environment, in the form of higher earnings response coefficients, quality of disclosures, and forecast accuracy; and lower internal control opinion shopping, earnings management, abnormal trading volume, return volatility, bid-ask spread and future stock price crash risk.
Regarding the regulatory review process in Iran, it is relatively comparable to the U.S. securities commission (SEC) review procedure, as the key source to frame review procedure in Iran’s capital market, is the SEC review procedure. In according to Iran’s Capital Market Act (see Islamic Consultative Assembly, 2005; SEO, 2014), the mission of SEO is to protect investors and enhance market efficiency. Therefore, as part of this mission, the SEO must review/scrutinize the corporate reports. The SEO review process involves evaluating the corporate reports from an investors’ perspective and asking questions that investors might ask when reading the disclosure. Upon scrutiny of corporate reports, if questions arise, the SEO issues a CL including possible disclosure deficiency and concerns to the firms. The responses of firms must include new or additional disclosures in the corporate reports (Hesarzadeh and Rajabalizadeh, 2020). The SEO consider the responses and their new or additional disclosures and then, may issue new CLs until all potential deficiencies are resolved. The CL procedure may terminate with the SEO recommending the cases of corporate reporting irregularities to the process of regulatory enforcement and sanctions (Hesarzadeh and Rajabalizadeh, 2020).
Notable, SEO scrutiny procedure has specific/unique characteristics in comparison of SEC scrutiny procedure. In this regard, first, SEO scrutiny procedure is under very high workload pressure. This is because, in Iran’s capital market, institutional setting is relatively poor and therefore, to protect investors and enhance market efficiency, SEO in the last line of defense in policing corporate reporting quality should compensate for the poor institutional setting (Hesarzadeh, 2020). Second, SEO scrutiny procedure usually has to focus on corporate disclosures. This is because in Iran’s capital market, comparable to other developing capital markets, it is not easy to access the diverse sources of information (e.g, Su et al., 2014) and therefore, SEO scrutiny procedure should majorly focuses on corporate disclosures. In this regard, current study will discuss that SEO reviewers are looking for some heuristic cues to limit the processing of information and therefore, to more efficiently and effectively conclude the reliability of corporate reports. These conditions make SEO rely more on CSR reports and its signaling effect.
2.3. Hypothesis Development
CSR can be viewed as a mechanism through which managers build a moral corporate reputation. Generally, this reputation encourages stakeholders to “look the other way” (Kotchen & Moon, 2012) and may reduce the probability of litigation risks (Baker & Griffith, 2009; Kim et al., 2012). A positive CSR reputation can encourage stakeholders to view events suggestive of violations as the result of a one-time error and not an intentional act to deceive. Hence, when there is a belief in a lack of intent, the motivation to file a lawsuit is likely to be lower.
Particularly, CSR may reduce the risk of receiving a CL because of the following reasons. First, while CL procedures is very time consuming and costly, the securities commissions have to allocate specific and limited human and financial resources to the scrutiny of disclosures (Brown et al., 2018). Under this condition, securities commissions are looking for some heuristic cues to limit the processing of information and therefore, to more efficiently and effectively conclude the reliability of corporate disclosures (Fernbach & Rehder, 2013; Hesarzadeh and Rajabalizadeh, 2020; Cassell et al., 2019). In this regard, the reviewers of securities commissions use CSR as an important heuristic cue in examining the reliability of corporate disclosures. This is because CSR provides a signal of sincere care about reliable information (Linthicum et al., 2010; Cao et al., 2019) as CSR is a sign of ethics of management (Linthicum et al., 2010; Chen et al., 2015); and company’s reputation which will prevent managers from opportunistic behaviors (Linthicum et al., 2010; Rothenhoefer, 2018). Hence, the reviewers of securities commissions probably use CSR as a positive heuristic cue while investigating the reliability of disclosures.
Second, CL procedure is mainly made from the view of investors, that is, the information and the information environment, which are necessary for the investors’ decision (SEC, 2015; Bozanic et al., 2017). In this respect, CSR strongly relates to the information and the information environment, which are necessary for the investors’ decision (Cho et al., 2013; Ramanna, 2013; Elliott et al., 2014), as CSR can provide wider useful information than financial statements (Ramanna, 2013); shrinks information asymmetry (Cho et al., 2013); and affects economic decisions (Elliott et al., 2014). Thus, since the CL procedure is mainly made from the view of investors, and CSR is important for investors, then the reviewers of securities commissions probably address CSR while assessing the minimum expected quality and quantity of information.
Third, the positive association between CSR financial disclosure's truthfulness suggests that CSR is used by honest managers to really improve information quality and transparency (Jo & Na, 2012; Scholtens & Kang, 2012). In this respect, Scholtens & Kang (2012) point out companies with more CSR have lower earnings manipulation. Barton et al. (2015) extend this finding with evidence showing that better CSR companies manipulate earnings through reduction of financing costs and rather than extraction of rent. Notable, although companies having managerial misbehavior may engage greater CSR (Cho et al., 2013; Tomas Siueia and Wang, 2019), CSR, at least, improves information users’ perceptions of the truthfulness of disclosure (Fieseler, 2011; Guiral, 2012). For example, Guiral (2012) reveals that CSR positively influences the perception of auditors about a company’s internal control mechanisms. Thus, based on the association of CSR and truthfulness of financial disclosure (or at least based on the association of CSR and perceptions of truthfulness of disclosure), the reviewers of securities commissions may positively address CSR, while choosing the firms for review.
Based on above arguments, this paper expects that firms with more CSR are less probably to be scrutinized and therefore, are less likely to receive a CL. Formally stated:
H1: CSR is inversely associated with CL.
The demand for corporate reporting majorly stems from environmental information asymmetry (Diamond & Verrecchia, 1991; Healy & Palepu, 2001; Bushman et al., 2011; Cheng & Wu, 2014; Hesarzadeh, 2020; Burke et al., 2020; Hu & Fu, 2020), since the information asymmetry is a fundamental principle regarding information search processes, and it initiates the process of information seeking (Hesarzadeh, 2020).
In this regard, for example, Diamond & Verrecchia (1991) theoretically posit that the information asymmetry can create incentives for information users to search additional information. Further, Cheng & Wu (2014) show that the effect of corporate information is larger for companies having high environmental information asymmetry.
Particularly, in the context of CSR, Martínez-Ferrero et al. (2015), Hickman (2018), and Burke et al. (2020) suggest that, under higher environmental information asymmetry, there is a greater need to CSR information. Particularly, Bae et al. (2020) argue that as environmental information asymmetry increases and, therefore, the credibility of financial information drops, an alternative source of information investors can count on is the firm’s nonfinancial voluntary disclosure such as CSR disclosures, as the CSR disclosures matter for the understanding of a company’s risks and opportunities (KPMG, 2015). Further, Tan et al. (2020) suggest that higher environmental information asymmetry can result in more demand for and higher reliance on CSR from public debtholders in their risk assessment tasks.
This information asymmetry is also important from CL perspective. For clarity, the reviewers of securities commission scrutinize a firm by evaluating the corporate reports from investors’ view and addressing issues that investors might address when reviewing the reports and thus, detect instances that firms should clarify (Brown et al., 2018). Hence, if under higher environmental information asymmetry, investors have greater needs to CSR information, and the reviewers of securities commission scrutinize a firm by addressing issues that investors might address, then we can expect that under higher environmental information asymmetry, the reviewers more likely address CSR, while choosing the firms for review or scrutinizing firms. Furthermore, based on Su et al. (2014), when a firm’s environmental information asymmetry is high, the reviewers may search for additional information, like CSR information, to assess the firm’s behaviors. Hence, under higher environmental information asymmetry, the reviewers of securities commission more likely address CSR, while choosing the firms for review or scrutinizing firms. Therefore, this paper predicts that the association of CSR and CL is stronger when the environmental information asymmetry is higher. Hence, current paper states its second hypothesis as follows:
H2: Higher environmental information asymmetry strengthens the association of CSR and CL.
CSR may be driven by moral/honest management or by opportunistic management. Specifically, on the one hand, CSR is enjoyed by moral/honest managers (e.g., Jo & Na, 2012; Kim et al., 2012; Scholtens & Kang, 2012; Barton et al., 2015). For example, Kim et al. (2012) and also Barton et al. (2015) show that companies engaging higher CSR have lower earnings manipulation.
On the other hand, managers may employ CSR as an entrenchment strategy, i.e., as a means to cover up managerial misbehavior or to mask their self-serving behaviors (e.g., Surroca & Tribo, 2008; Burke et al., 2020). For instance, Burke et al. (2020) suggest that managers seek to over-invest in CSR for their private benefit, such as enhancing their own reputation as good citizens, garnering employees’ and customers’ affection, and increasing managers’ job security. From this perspective, CSR activities are instead a manifestation of the agency problem between managers and shareholders.
Hence, if the reviewers of securities commissions do not perceive (perceive) the company’s CSR as the result of managerial misbehavior or self-serving behaviors, they probably respond by reducing (increasing) scrutiny.
In this regard, corporate governance quality may affect the intuition of the regulatory reviewers about the (positive versus negative) nature of diverse corporate activities (Cassell et al., 2013, 2019; Johnston & Petacchi, 2017; Ballestero & Schmidt, 2019; Baugh & Schmardebeck, 2020; Cunningham et al., 2020; Hesarzadeh, 2020), including CSR. This is because, as Gill (2008) demonstrates, greater corporate governance quality is an appropriate way for pushing managers to more address ethical considerations, therefore, for the firms with greater corporate governance quality, CSR more (less) likely results from moral/honest management (opportunistic management). For instance, Khan et al. (2012) suggest that higher corporate governance quality may reduce some concerns relating to opportunistic CSR. Specifically, Cao et al. (2019) state that companies having CSR with strong (weak) governance are less (more) probably to have an entrenchment strategy. In addition, Nair et al. (2019) discuss that, in firms having weak corporate governance, managers use CSR disclosures for “green washing” which provides noisy information. Furthermore, Shahab and Ye (2018) find that the inclusion of institutional owners, independent board of directors, and large board size in the organizations may lead to increased adherence to the CSR guidelines.
For these reasons, if under higher (lower) corporate governance quality, the reviewers of securities commissions do not perceive (perceive) the company’s CSR as the result of managerial misbehavior, they probably respond by reducing (increasing) scrutiny. Thus, to the extent that the reviewers of securities commission pay attention to firms’ corporate governance quality, it could be expected that corporate governance quality strengthens the association of CSR and CL. Therefore, current paper states its third hypothesis as follows:
H3: Higher corporate governance quality strengthens the association of CSR and CL.
Figure 1 shows the theoretical associations of CSR, CL, environmental information asymmetry, and corporate governance quality.
Figure 1. Research hypotheses
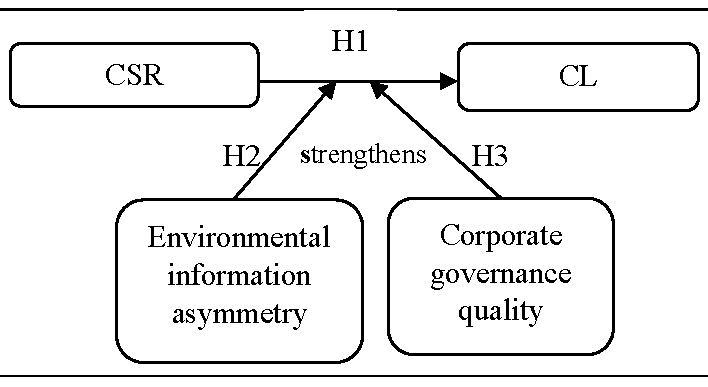
Figure above displays the theoretical associations of main variables.
3. Methods
3.1. Sample
The research sample focuses on Iran’s capital market, namely Tehran Securities Exchange (TSE), and consists of an unbalanced panel of 437 company-years observations over the period of 2011 to 2017. Table 1 outlines the steps to construct the sample. As shown in the table, the initial research sample comprises 2,219 company-years observations (i.e., 317 companies over seven years). This paper excludes financial/utility companies because of the dissimilarity in various metrics and following literature (e.g., Shahab & Ye, 2018; Bills et al., 2019; Nair et al., 2019; ; Yao & Xue, 2019; Cunningham et al., 2020). The paper further eliminates company-years with low trade levels (less than 20 trades) and company-years without the necessary data to compute research variables.
With the exception of data on CL that collected from the SEO, this paper extracts data from the Rahavard Novin, the most comprehensive database in TSE (Hesarzadeh, 2020).
Table 1. Sample selection procedures
| Company-years between 2011-2017 [317 × 7 =] | 2,219 |
| Less: Utility/financial company-years | (966) |
| Less: Low trade levels company-years | (503) |
| Less: Missing information company-years | (313) |
| Research sample (N) | 437 |
| Non-CL company-years | 346 |
| CL company-years | 91 |
Table above details the procedure of sample selection.
3.2. Measuring Variables
3.2.1. Corporate Social Responsibility
To measure CSR, extensive research (Dhaliwal et al., 2011; Cho et al., 2013; Davidson et al., 2019; Rothenhoefer, 2018), employs data from MSCI Inc, which is the successor of Kinder, Lydenberg, Domini & Co. (KLD). For simplicity, this paper refers to this database as KLD. KLD is an independent investment research firm specializing in compiling rating of firms’ CSR and it started to track firms’ social performance since1991. Over time, KLD has expanded its coverage and included CSR strengths and weaknesses for a large subset of its constituent firms, including Standard & Poor’s (S&P) 500, the Domini 400 Social Index, and firms in the Russell 1,000 Index (see, Ramchander et al., 2012; Flammer & Bansal, 2017; Golden et al., 2018). The KLD scores CSR on dimensions containing “corporate governance, community relations, diversity, employee relations, environment, product, alcohol, gambling, military contracting, nuclear power and tobacco” (Kim et al., 2012).
Since KLD does not cover Iranian firms, this paper uses Iranian KLD, which is based on the same dimensions in KLD and developed by Rahavard Novin Inc. However, this paper, following studies (Dhaliwal et al., 2011; Servaes & Tamayo 2013; Lins et al., 2017; Davidson et al., 2019; Cao et al., 2019), excludes the last five dimensions as these dimensions do not reflect the firms’ discretionary.
In addition, this paper excludes corporate governance dimension because of the following reasons. First, it is generally controversial to consider corporate governance as part of CSR (e.g., Kim et al., 2012; Lins et al., 2017; Cao et al., 2019), since CSR includes activities that serve interests of all stakeholders, depending on how one defines shareholders’ best interest, corporate governance and CSR may be two completely different constructs (Kim et al., 2012). Further, the relation between corporate governance and CSR may also depend on CSR incentives. For instance, if CSR is motivated by managers’ self-interest and good corporate governance works as a disciplinary mechanism, then corporate governance and CSR could be negatively associated (Cao et al., 2019). Second, corporate governance dimension is particularly controversial to the third hypothesis, where this paper investigates how corporate governance quality influences the association of CSR and CL.
In summary, this study constructs the CSR by total strengths minus total concerns in the five dimensions including community, employee relations, diversity, environment and product quality. This paper refers to this Index as Iranian adjusted KLD (AKLD).
3.2.2. Comment Letter
Following extensive relevant works (e.g., Cassell et al., 2013, 2019; Cunningham et al., 2020), SEO CL, “CL”, is coded as “1” (“0”) if a company receives (does not receive) a CL on the corporate reports in year t. Figure 2 shows how this paper assigns “1” (“0”) to each observation.
Figure 2. Visual description of variable CL
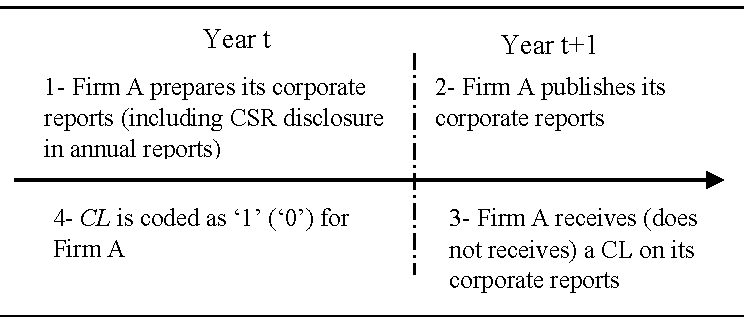
Figure above shows how CL is coded as "1" ("0").
3.2.3. Environmental Information Asymmetry
To measure environmental information asymmetry (E_ IA), first, this study measures the information asymmetry and, following Hesarzadeh (2020), employs a statistical principal components methodology to isolate the common component of information asymmetry in these four proxies: “return volatility,” “trading volume,” “ask-bid spread” and “illiquidity.” Then, since the information asymmetry potentially stems from environmental information asymmetry and also poor corporate reporting/internal controls (Zhang, 2006), following the methodology of Francis et al. (2005), this study employs the “residual value of regression of information asymmetry on corporate reporting/internal controls quality metrics” to measure environmental information asymmetry. The corporate reporting quality/internal controls metrics include accruals earnings management, real earnings management, internal control weakness, and restatement.
3.2.4. Corporate Governance Quality
Following Lopes et al. (2016), the measure of corporate governance quality, Gov, quantifies the quality of governance exploiting 15 questions regarding to four dimensions: shareholder rights; disclosure; ownership structure & control; and board performance & composition (see dimensions 1 to 15 in Exhibit 1 of Lopes et al. (2016)).
3.2.5 Control Variables
This study, based on literature (see, for example, Cassell et al., 2013, 2019; Hesarzadeh and Rajabalizadeh, 2020), includes diverse control variables which affect CL. The variables can be classified under three general dimensions, including corporate reporting/internal control quality, corporate characteristics, and corporate governance as follows (see Cassell et al., 2013, and Hesarzadeh and Rajabalizadeh, 2020, for a detailed discussion of this issue):
corporate reporting/internal control quality, including accruals-based earnings manipulation (A_EM), real activities based earnings manipulation (R_EM), internal control weakness (I_CW), and restate of financial statements (Rest);
corporate characteristics, including volatility of abnormal stock returns (Vol); market capitalization (M_C), age (Age), incidence of loss (Loss), return on assets (R_OA), bankruptcy risk (B_R); sales growth (S_G), external financing (E_F), and litigation risk (L_R);
corporate governance, including auditor size (Big), auditor tenure (A_T), institutional ownership (I_O), CEO-Chairman duality (Dual), chief financial officer power (C_P), and board of directors independence (Indep).
3.3. Test Model
Consistent with H1, current paper examines whether CSR affects the probability of receiving a CL. Thus, the predicted variable is CL (operationalized by SEO CL on corporate reporting, CL). Moreover, the test variable is the CSR (operationalized by modified KLD index, AKLD). The paper assesses the statistical relationship between CSR and CL by estimating this logistic regression:
\[\begin{equation} \label{eq1} \small \begin{split} CL_{it} =& \gamma_{0} + \gamma_{1}AKLD_{it} +\gamma_{2}A\_EM_{it} + \gamma_{3}R\_EM_{it} + \gamma_{4}I\_CW_{it} + \gamma_{5}Rest_{it}\\ & + \gamma_{6}Vol_{it} + \gamma_{7}M\_C_{it} + \gamma_{8}Age_{it}+ \gamma_{9}Loss_{it} + \gamma_{10}R\_OA_{it}\\ & + \gamma_{11}B\_R_{it} + \gamma_{12}S\_G_{it} + \gamma_{13}E\_F_{it} + \gamma_{14}L\_R_{it} + \gamma_{15}Big_{it}\\ & + \gamma_{16}A\_T_{it} + \gamma_{17}I\_O_{it} + \gamma_{18}Dual_{it}+ \gamma_{19}C\_P_{it}\\ & + \gamma_{20}Indep_{it} + I\_FE + Y\_FE + \varepsilon_{it} \end{split}\ \ \ \ (1) \end{equation}\]
Furthermore, consistent with H2 and H3, current study examines whether environmental information asymmetry and corporate governance quality moderate the association of CSR and CL. Thus, this study empirically examines the relation between CL and both “interaction of CSR and environmental information asymmetry” and “interaction of CSR and corporate governance quality”. Technically, current paper assesses the moderating roles of environmental information asymmetry (E_ IA) and corporate governance quality (Gov) by estimating these two regressions:
\[\begin{equation} \label{eq2} \small \begin{split} CL_{it} =& \gamma_{0} + \gamma_{1}AKLD_{it} + \gamma_{21}(E\_ IA)_{it} \gamma_{22}AKLD_{it} \times (E\_IA)_{it}\\ & + Controls_{it} + I\_FE + Y\_FE + \varepsilon_{it} \end{split}\ \ \ \ (2) \end{equation}\]
\[\begin{equation} \label{eq3} \small \begin{split} CL_{it} =& \gamma_{0} + \gamma_{1}AKLD_{it} + \gamma_{21}Gov_{it} + \gamma_{22}AKLD_{it} \times Gov_{it}\\ &+ Controls_{it} + I\_FE + Y\_FE + \varepsilon_{it} \end{split}\ \ \ \ (3) \end{equation}\]
In the logistic regressions above, Controls include all control variables in Equation (1).
This paper defines all of variables in Table 2.
Table 2. Definition of variables
| Variable | Definition |
|---|---|
| Predicted variable: | |
| CL= CL | 1 = firm received a SEO CL in year t, 0 = otherwise |
| Test variable | |
| CSR=AKLD | Total strengths minus total concerns in social responsibility dimensions including community, employee relations, diversity, environment and product quality |
| Moderator variables: | |
| E_ IA | Environmental information asymmetry that is residual value in the regression of information asymmetry on corporate reporting/internal controls quality measures. The information asymmetry computed exactly as in Hesarzadeh (2019). Further, the corporate reporting quality/internal controls measures are A_EM, R_EM, I_CW, and Rest. |
| Gov | Corporate governance quality score as constructed in Lopes et al. (2016) |
| Control variables: | |
| A_T | Auditor tenure in years |
| A_EM | The earnings manipulations through estimates or accrual computed exactly as in Dechow et al. (1995) |
| Age | The number of years the firm has been listed on TSE |
| B_R | 1= Altman’s Z score (DeFond and Hung, 2003) is higher than median, 0= otherwise |
| Big | 1= auditor is a big audit firm, 0= otherwise |
| C_P | 1= CFO is an executive director, 0= otherwise |
| Dual | 1= CEO is the chairman of the board of directors, 0= otherwise |
| E_F | Sum of external financing (equity + debt) divided by total assets |
| Vol | 1= the volatility of daily returns for the year is in the quartile four, 0= otherwise |
| I_O | The percentage of shares owned by institutional investors |
| L_R | 1= firm is in a litigious industry computed exactly as in Francis et al. (1994), 0= otherwise |
| Loss | 1= operational profit is negative, 0= otherwise |
| M_C | Market capitalization, i.e., Ln (the number of shares outstanding × share price) |
| I_CW | 1= audit reports is revealed an internal control weakness in year t, 0= otherwise |
| R_EM | The real earnings manipulations through real economic activities based on Cohen et al. (2008) |
| Rest | 1= firm with restatement, 0= otherwise |
| R_OA | Return on assets, i.e., operational profit divided by total assets |
| S_G | Sales growth, i.e., change in sales from year t-1to year t |
| Indep | The percentage of independent (non-executive) directors |
Table above describes the measurement of variables.
4. Empirical Findings
4.1. Univariate Analysis
Table 3 displays the basic features of variables. Notable, to decrease the impact of outliers on results, observations are winsorized at the 1% of continuous distributions. As shown in table, the average of AKLD is approximately 0.108 and -0.019 for two subsamples: no-CL companies (CL=0) and CL companies (CL=1), respectively. The statistically significant difference (sig=0.071) between the two subsamples suggests that CSR is likely higher for the former companies. The table further displays that the average of earnings manipulations through estimates/accruals and real economic activities (A_EM & R_EM), are somewhat lower for the first subsample relative to the second subsample; however, the difference is statistically insignificant. Further, the independent samples t test— reported in the last column— suggests that internal control weakness (I_CW), the restatement of financial statements (Rest) and CEO duality (Dual) are significantly lower for no-CL companies. Additionally, the bigness of auditor (Big) and board independence (Indep) are higher for no-CL companies.
Table 3. Descriptive statistics
| CL = 0 | CL = 1 | |||||||
|---|---|---|---|---|---|---|---|---|
| Mean | Median | Sth. Dev. | Mean | Median | Sth. Dev. | sig | ||
| AKLD | 0.108 | 0.000 | 1.345 | -0.019 | 0.000 | 1.647 | 0.071* | |
| A_EM | 0.005 | 0.002 | 0.095 | 0.006 | 0.012 | 0.099 | 0.196 | |
| R_EM | 0.006 | -0.032 | 0.552 | 0.010 | -0.036 | 0.625 | 0.426 | |
| I_CW | 0.037 | 0.000 | 0.191 | 0.292 | 0.000 | 0.458 | 0.000*** | |
| Rest | 0.026 | 0.000 | 0.160 | 0.229 | 0.000 | 0.157 | 0.000*** | |
| Vol | 0.239 | 0.000 | 0.427 | 0.292 | 0.000 | 0.457 | 0.402 | |
| M_C | 13.386 | 13.272 | 1.878 | 13.633 | 13.383 | 1.733 | 0.250 | |
| Age | 21.266 | 19.000 | 11.151 | 21.955 | 21.000 | 10.414 | 0.591 | |
| Loss | 0.100 | 0.000 | 0.303 | 0.078 | 0.000 | 0.270 | 0.441 | |
| R_OA | 0.152 | 0.142 | 0.159 | 0.153 | 0.140 | 0.153 | 0.992 | |
| B_R | 0.495 | 0.000 | 0.500 | 0.528 | 1.000 | 0.502 | 0.515 | |
| S_G | 0.232 | 0.202 | 1.588 | 0.235 | 0.183 | 1.194 | 0.439 | |
| E_F | 0.022 | 0.000 | 0.219 | 0.023 | 0.000 | 0.073 | 0.989 | |
| L_R | 0.396 | 0.000 | 0.489 | 0.415 | 0.000 | 0.495 | 0.739 | |
| Big | 0.294 | 0.000 | 0.456 | 0.224 | 0.000 | 0.419 | 0.072* | |
| A_T | 2.290 | 2.000 | 2.168 | 2.929 | 2.000 | 2.675 | 0.807 | |
| I_O | 72.796 | 81.040 | 23.891 | 72.828 | 79.980 | 21.135 | 0.991 | |
| Dual | 0.029 | 0.000 | 0.168 | 0.146 | 0.000 | 0.355 | 0.000*** | |
| C_P | 0.058 | 0.000 | 0.234 | 0.056 | 0.000 | 0.231 | 0.761 | |
| Indep | 0.635 | 0.600 | 0.174 | 0.557 | 0.600 | 0.187 | 0.000*** | |
| N | 346 | 91 | ||||||
Table above reports summary statistics of predicted/test/control variables. The asterisks indicate a 1% (***), 5% (**), and 10% (*) level of significance.
AKLD = Total strengths - Total concerns in CSR dimensions; A_EM refers to the accrual earnings management computed exactly as in Dechow et al. (1995); R_EM refers to the real earnings management computed exactly as in Cohen et al. (2008); I_CW = 1, if audit reports is revealed an internal control weakness in year t, & 0= otherwise; Rest = 1, for firm with restatement, & 0= otherwise; Vol = 1, if the volatility of daily returns for the year is in the quartile four, & 0= otherwise; M_C = Ln (Number of shares outstanding × share price); Age = Number of years the firm has been listed on TSE; Loss = 1, if operational profit is negative, & 0= otherwise; R_OA = Operational profit/Total assets; B_R = 1, if Altman’s Z score (DeFond and Hung, 2003) is higher than median, & 0= otherwise; S_G is the change in sales from year t-1to year t; E_F = (Equity + Debt divided)/Total assets; L_R = 1, if firm is in a litigious industry computed exactly as in Francis et al. (1994), & 0= otherwise; Big = 1, if auditor is a big audit firm, & 0= otherwise; A_T refers to the auditor tenure in years, I_O is the percentage of shares owned by institutional investors; Dual = 1, if CEO is the chairman of the board of directors, & 0= otherwise; C_P = 1, if CFO is an executive director, & 0= otherwise; Indep refers to the percentage of independent directors.
Table 4 tabulates the Pearson’s correlations of variables. Bold indicates a 10% level of significance. As shown in the table, the correlation of CL and AKLD is significant and negative (-0.089), representing that CSR probably decreases CL. In general, the correlations are lesser than 50%, and therefore, empirical findings are relatively free from multicollinearity problems.
Table 4. Pearson correlation
| AKLD | A_EM | R_EM | I_CW | Rest | Vol | M_C | Age | Loss | R_OA | B_R | S_G | E_F | L_R | Big | A_T | I_O | Dual | C_P | Indep | E_ IA | Gov | |
|---|---|---|---|---|---|---|---|---|---|---|---|---|---|---|---|---|---|---|---|---|---|---|
| CL | -0.089 | -0.062 | 0.038 | 0.365 | 0.400 | 0.040 | 0.055 | 0.026 | -0.037 | 0.001 | 0.031 | -0.037 | -0.001 | 0.016 | -0.065 | 0.012 | 0.001 | 0.223 | -0.015 | -0.185 | 0.016 | 0.327 |
| AKLD | 1 | -0.084 | 0.003 | 0.031 | -0.034 | 0.038 | 0.065 | 0.061 | -0.080 | 0.099 | -0.068 | 0.000 | -0.012 | 0.121 | 0.004 | -0.071 | 0.008 | 0.041 | 0.023 | -0.041 | -0.081 | 0.117 |
| A_EM | 1 | -0.088 | 0.015 | -0.104 | -0.009 | 0.150 | 0.015 | -0.489 | 0.433 | -0.242 | -0.071 | -0.052 | 0.025 | 0.024 | 0.051 | 0.092 | -0.006 | 0.014 | 0.023 | 0.092 | -0.210 | |
| R_EM | 1 | -0.017 | 0.060 | 0.061 | -0.179 | 0.086 | 0.142 | -0.205 | 0.043 | -0.095 | 0.077 | 0.004 | -0.037 | -0.001 | -0.169 | -0.059 | -0.001 | -0.097 | 0.115 | -0.106 | ||
| I_CW | 1 | 0.165 | 0.017 | 0.008 | -0.072 | 0.028 | -0.024 | 0.043 | 0.018 | -0.013 | -0.034 | 0.016 | 0.033 | 0.037 | 0.132 | 0.017 | -0.062 | 0.067 | 0.397 | |||
| Rest | 1 | -0.040 | 0.038 | 0.021 | 0.069 | -0.052 | -0.005 | 0.012 | -0.005 | 0.026 | 0.019 | 0.015 | -0.023 | 0.074 | -0.042 | -0.115 | 0.061 | 0.077 | ||||
| Vol | 1 | -0.015 | 0.131 | 0.074 | -0.082 | 0.086 | -0.028 | 0.040 | 0.006 | 0.136 | 0.075 | 0.012 | -0.001 | 0.004 | 0.043 | 0.218 | -0.052 | |||||
| M_C | 1 | -0.166 | -0.197 | 0.244 | -0.082 | -0.228 | -0.054 | 0.046 | 0.038 | 0.155 | 0.143 | 0.145 | -0.031 | -0.031 | -0.261 | 0.064 | ||||||
| Age | 1 | 0.054 | 0.008 | 0.012 | 0.022 | 0.001 | 0.171 | 0.086 | -0.018 | -0.108 | -0.045 | 0.080 | 0.116 | 0.004 | 0.132 | |||||||
| Loss | 1 | -0.418 | 0.218 | 0.054 | 0.005 | -0.078 | 0.019 | -0.005 | -0.116 | -0.046 | -0.021 | -0.064 | 0.057 | 0.005 | ||||||||
| R_OA | 1 | -0.562 | -0.051 | -0.319 | 0.234 | 0.040 | -0.017 | 0.069 | 0.028 | -0.040 | 0.070 | 0.054 | 0.019 | |||||||||
| B_R | 1 | -0.098 | 0.040 | -0.258 | 0.087 | 0.044 | 0.079 | -0.024 | 0.157 | -0.064 | 0.019 | 0.043 | ||||||||||
| S_G | 1 | 0.018 | 0.026 | 0.020 | -0.087 | -0.059 | -0.051 | -0.025 | 0.093 | 0.096 | 0.068 | |||||||||||
| E_F | 1 | 0.032 | 0.052 | 0.057 | -0.045 | 0.020 | -0.024 | -0.019 | -0.143 | 0.094 | ||||||||||||
| L_R | 1 | 0.056 | -0.121 | -0.178 | 0.007 | -0.062 | 0.037 | 0.003 | -0.045 | |||||||||||||
| Big | 1 | 0.502 | 0.028 | -0.082 | -0.053 | 0.057 | 0.062 | 0.134 | ||||||||||||||
| A_T | 1 | 0.012 | -0.031 | -0.024 | -0.008 | -0.023 | 0.052 | |||||||||||||||
| I_O | 1 | 0.080 | 0.070 | -0.061 | -.0154 | 0.342 | ||||||||||||||||
| Dual | 1 | -0.020 | -0.095 | 0.003 | 0.031 | |||||||||||||||||
| C_P | 1 | 0.090 | 0.073 | 0.009 | ||||||||||||||||||
| E_ IA | 1 | 0.048 | ||||||||||||||||||||
| Gov | 1 | |||||||||||||||||||||
| N | 437 | |||||||||||||||||||||
Table above tabulates Pearson correlations between variables. Bold values show correlations that, statistically, are different from zero at the 10%.
CL = 1 if firm received a SEO CL in year t, & 0= otherwise; AKLD = Total strengths - Total concerns in CSR dimensions ; A_EM refers to the accrual earnings management computed exactly as in Dechow et al. (1995); R_EM refers to the real earnings management computed exactly as in Cohen et al. (2008); I_CW = 1, if audit reports is revealed an internal control weakness in year t, & 0= otherwise; Rest = 1, for firm with restatement, & 0= otherwise; Vol = 1, if the volatility of daily returns for the year is in the quartile four, & 0= otherwise; M_C = Ln (Number of shares outstanding × share price); Age is the number of years the firm has been listed on TSE; Loss = 1, if operational profit is negative, & 0= otherwise; R_OA = operational profit / total assets; B_R = 1, if Altman’s Z score (DeFond and Hung, 2003) is higher than median, & 0= otherwise; S_G is the change in sales from year t-1to year t; E_F = (Equity + Debt divided)/Total assets; L_R = 1, if firm is in a litigious industry computed exactly as in Francis et al. (1994), & 0= otherwise; Big = 1, if auditor is a big audit firm, & 0= otherwise; A_T refers to the auditor tenure in years, I_O is the percentage of shares owned by institutional investors; Dual = 1, if CEO is the chairman of the board of directors, & 0= otherwise; C_P = 1, if CFO is an executive director, & 0= otherwise; Indep refers to the percentage of independent directors.
4.2. Multivariate Analysis
4.2.1. Test of H1
Current study begins its multivariate analysis by testing the hypothesis H1. The hypothesis predicts that CSR is inversely associated with CL. Table 5 shows related empirical findings. The findings represent that the relationship between AKLD and CL is statistically significant (sig = 0.036). Further, this association is negative (-0.432), suggesting that the higher AKLD leads to less CL. Hence, consistent with hypothesis H1, firms having more CSR are less likely to receive a CL.
Evidence shows that, comparable to literature (e.g., Cassell et al., 2013; Hesarzadeh and Rajabalizadeh, 2020), accrual earnings manipulation (A_EM; sig = 0.005), internal control weakness (I_CW; sig = 0.000), and the restatement (Rest; sig = 0.000) significantly affect CL. Therefore, generally reporting/internal control quality affects the CL. The evidence further shows that some firm features, such as stock returns volatility (Vol; sig = 0.034), age (Age; sig = 0.027), loss (Loss; sig = 0.051), return on assets (R_OA; sig = 0.016) and bankruptcy rank (B_R; sig = 0.068) influence CL. In addition, the evidence displays that firms having auditors with bigger size (Big; sig = 0.025) experience a lower probability of the receipt of a CL. The CEO duality (Dual; sig = 0.000) and board independence (Indep; sig = 0.009) have a significant association to CL, collectively suggesting that strong corporate governance decreases CL. The results are comparable to the findings of Cassell et al. (2013) who suggest that corporate reporting/internal control quality, corporate features and corporate governance affect CL.
Table 5. Impact of CSR on CL
| CLit = γ0 + γ1AKLDit + Controlsit + I_FE + Y_FE + εit | |||
|---|---|---|---|
| Indep.Var | Pred. | Coef. | sig |
| AKLD | − | -0.432** | 0.036 |
| Controls: | |||
| A_EM | + | 6.514** | 0.005 |
| R_EM | + | 0.241 | 0.175 |
| I_CW | + | 2.891*** | 0.000 |
| Rest | + | 3.008*** | 0.000 |
| Vol | + | 0.637** | 0.034 |
| M_C | + | 0.087 | 0.287 |
| Age | + | 0.029** | 0.027 |
| Loss | + | -1.306* | 0.051 |
| R_OA | + | 4.780** | 0.016 |
| B_R | + | 0.321* | 0.068 |
| S_G | + | 0.021 | 0.675 |
| E_F | − | 0.843 | 0.183 |
| L_R | + | 0.754 | 0.451 |
| Big | − | -0.976** | 0.025 |
| A_T | − | 0.083 | 0.173 |
| I_O | − | -0.006 | 0.236 |
| Dual | + | 3.005*** | 0.000 |
| C_P | + | 0.565 | 0.274 |
| Indep | − | -2.135*** | 0.009 |
| Constant | -4.745** | 0.022 | |
| I_FE | Included | ||
| Y_FE | Included | ||
| N | 437 | ||
| Pseudo R2 | 29% | ||
| Area Under ROC | 82% | ||
| Explained (Total) Variance | 0.485(0.571) | ||
Table above displays the logistic estimation of CL (CL) on CSR (AKLD). The asterisks indicate a 1% (***), 5% (**), and 10% (*) level of significance.
CL = 1 if firm received a SEO CL in year t, & 0= otherwise; AKLD = Total strengths - Total concerns in CSR dimensions; A_EM refers to the accrual earnings management computed exactly as in Dechow et al. (1995); R_EM refers to the real earnings management computed exactly as in Cohen et al. (2008); I_CW = 1, if audit reports is revealed an internal control weakness in year t, & 0= otherwise; Rest = 1, for firm with restatement, & 0= otherwise; Vol = 1, if the volatility of daily returns for the year is in the quartile four, & 0= otherwise; M_C = Ln (Number of shares outstanding × share price); Age is the number of years the firm has been listed on TSE; Loss = 1, if operational profit is negative, & 0= otherwise; R_OA = operational profit / total assets; B_R = 1, if Altman’s Z score (DeFond and Hung, 2003) is higher than median, & 0= otherwise; S_G is the change in sales from year t-1to year t; E_F = (Equity + Debt divided)/Total assets; L_R = 1, if firm is in a litigious industry computed exactly as in Francis et al. (1994), & 0= otherwise; Big = 1, if auditor is a big audit firm, & 0= otherwise; A_T refers to the auditor tenure in years, I_O is the percentage of shares owned by institutional investors; Dual = 1, if CEO is the chairman of the board of directors, & 0= otherwise; C_P = 1, if CFO is an executive director, & 0= otherwise; Indep refers to the percentage of independent directors; I_FE and Y_FE = Industry and Year fixed effects.
4.2.2. Test of H2
Consistent with H2, current paper predicts that environmental information asymmetry strengthens the association of CSR and CL. Table 6 reports the empirical evidence. The evidence displays the coefficient of “AKLD \(\times\) E_ IA” which is significant (sig= 0.033) and negative (-0.191) showing that when the environmental information asymmetry is higher, the association of CL and AKLD is stronger. Thus, higher environmental information asymmetry leads to a stronger association of CL and CSR. This result suggests that when the environmental information asymmetry is high, reviewers pay more attention to CSR. This point is probably well compatible with results obtained from literature (Su et al., 2014) suggesting that the usefulness of CSR is greater in the poor information diffusion condition.
Table 6. Impact of environmental information asymmetry on the association of CSR and CL
| CLit = γ0 + γ1 AKLDit + γ21 (E_ IA)it + γ22 (AKLD)it × (E_ IA)it+ Controlsit + I_FE + Y_FE + εit | |||
|---|---|---|---|
| Indep.Var | Pred. | Coef. | sig |
| AKLD | − | -0.349** | 0.049 |
| E_ IA | ? | -1.587** | 0.038 |
| AKLD × E_ IA | ? | -0.191** | 0.033 |
| Controls | Included | ||
| Constant | Included | ||
| I_FE | Included | ||
| Y_FE | Included | ||
| N | 437 | ||
| Pseudo R2 | 28% | ||
| Area Under ROC | 84% | ||
| Explained (Total) Variance | 0.491(0.571) | ||
Table above displays the logistic estimation of CL (CL) on the interaction of CSR and environmental information asymmetry (AKLD× E_ IA). The asterisks indicate a 1% (***), 5% (**), and 10% (*) level of significance.
CL = 1 if firm received a SEO CL in year t, & 0= otherwise; AKLD = Total strengths - Total concerns in CSR dimensions; E_ IA refers to the environmental information asymmetry that is residual value in the regression of information asymmetry on corporate reporting/internal controls quality measures; Controls refer to the control variables, which are defined in Table 2; I_FE and Y_FE = Industry and Year fixed effects.
4.2.3. Test of H3
Consistent with H3, this study expects that corporate governance quality strengthens the association of CSR and CL. Table 7 provides the empirical evidence. The evidence shows that the association of “AKLD\(\times\)Gov” is significant (sig= 0.046) and negative (-0.097), representing that higher corporate governance quality reinforce the association of CL and AKLD. Thus, higher corporate governance quality leads to a stronger association of CL and CSR. This result reveals that under high corporate governance quality, reviewers pay more attention to CSR.
Table 7. Impact of corporate governance quality on the association of CSR and CL
| CLit = γ0 + γ1 AKLDit + γ21 Govit + γ22 AKLDit × Govit + Controlsit + I_FE + Y_FE + εit | |||
|---|---|---|---|
| Indep.Var | Pred. | Coef. | sig |
| AKLD | − | -0.395** | 0.041 |
| Gov | ? | -0.682** | 0.038 |
| AKLD × Gov | ? | -0.097** | 0.046 |
| Controls | Included | ||
| Constant | Included | ||
| I_FE | Included | ||
| Y_FE | Included | ||
| N | 437 | ||
| Pseudo R2 | 30% | ||
| Area Under ROC | 88% | ||
| Explained (Total) Variance | 0.441(0.571) | ||
Table above displays the logistic estimation of CL (CL) on the interaction of CSR and corporate governance quality (AKLD× Gov). The asterisks indicate a 1% (***), 5% (**), and 10% (*) level of significance.
CL = 1 if firm received a SEO CL in year t, & 0= otherwise; AKLD = Total strengths - Total concerns in CSR dimensions; Gov refers to the corporate governance quality score as constructed in Lopes et al. (2016); Controls refer to the control variables, which are defined in Table 2; I_FE and Y_FE = Industry and Year fixed effects.
4.3. Supplemental Analysis
4.3.1. The Impact of Corporate Social Responsibility on the Association of Managerial Misbehavior and Comment Letter
In this section, current paper investigates this important ethical question: do the companies engaging in managerial misconduct— such as earnings manipulation— can mislead the CL procedure by displaying more CSR? Theoretically, information recipients (here, reviewers) may unintentionally employ their affective/emotional feedbacks to CSR to estimate different metrics — such as managerial performance or fundamental value (Sen & Bhattacharya, 2001; Frijda, 2008; Isbell et al., 2013) — as imagery-provoking nature or value-laden nature of CSR can cause positive or negative affective reactions in information recipients (e.g., Klein & Dawar, 2004). These affective reactions unintentionally influence the individuals’ subsequent judgments and weaken the information recipients’ ability to react to information in the way that they intend (Elliott et al., 2014). Particularly, the affective reactions weaken the reviewers’ ability to react to information in the scrutiny of managerial actions/behavior in the way that reviewers intend. Thus, it is expected that CSR weakens the relationship between managerial misbehavior and CL.
To empirically examine the aforementioned question, this study assesses the association of “CL” and “interaction of earnings manipulation and CSR”. The study measures accrual earnings manipulation (A_EM) following Dechow et al. (1995), and real earnings manipulation (R_EM) following Cohen et al. (2008).
Table 8 offers the empirical evidence. Briefly, the evidence indicates that the coefficients on “A_EM\(\times\) AKLDdummy” and “R_EM\(\times\) AKLDdummy” are not significant (sig= 0.673 and 0.430, respectively), suggesting that more CSR does not affect the relationship between CL and earnings manipulation. Thus, more CSR cannot cause less CL for managerial misconduct. This result, together with the separate significant impacts of CSR and earnings manipulation on CL, suggests that reviewers often see (do not see) more CSR as a complementary (substitute) heuristic cue for their scrutiny. Further, this result may be derived by “attribution perspective” in psychology, in the sense that if information recipients attribute their affect to its main cause, the affect cannot impress subsequent judgments (e.g., Schwarz & Clore, 1983).
Table 8. Impact of CSR on the association of managerial misbehavior and CL
| CLit = γ0 + γ1 (AKLDdummy)it + γ21 (A_EM)it + γ22 (R_EM)it + γ23 (A_EM)it× (AKLDdummy)it + γ24 (R_EM)it × (AKLDdummy)it+ Controlsit + I_FE + Y_FE + εit | |||
|---|---|---|---|
| Indep.Var | Pred. | Coef. | sig |
| AKLDdummy | − | -0.542** | 0.025 |
| A_EM | + | 6.975** | 0.001 |
| R_EM | + | 0.389* | 0.065 |
| A_EM×AKLDdummy | ? | 3.543 | 0.673 |
| R_EM ×AKLDdummy | ? | -0.109 | 0.430 |
| Controls | Included | ||
| Constant | Included | ||
| I_FE | Included | ||
| Y_FE | Included | ||
| N | 437 | ||
| Pseudo R2 | 30% | ||
| Area Under ROC | 86% | ||
| Explained (Total) Variance | 0.508(0.571) | ||
Table above displays the logistic estimation of CL (CL) on the interaction of earnings manipulation and CSR (A_EM× AKLDdummy & R_EM × AKLDdummy). The asterisks indicate a 1% (***), 5% (**), and 10% (*) level of significance.
CL = 1 if firm received a SEO CL in year t, & 0= otherwise; AKLDdummy = 1, if firm’s AKLD is greater than median, & 0= otherwise; A_EM refers to the accrual earnings management computed exactly as in Dechow et al. (1995); R_EM refers to the real earnings management computed exactly as in Cohen et al. (2008); Controls refer to the control variables, which are defined in Table 2; I_FE and Y_FE = Industry and Year fixed effects.
4.3.2. The Spillover Effect of Corporate Social Responsibility on Comment Letter
Theoretically, the quality and quantity of publicly relevant information including information from “peer firms” (related firms) affect the decisions of a firm’s information users (Lambert et al., 2007; Ma, 2017). This is particularly because the information of the aforementioned firms is useful to information users in assessing and comparing information among firms (Pandit et al., 2011). For example, when CSR of a firm is more than CSR of its peer firms, this more CSR of the firm may offer a positive heuristic cue for reviewers and therefore, the firm experiences lower scrutiny. Thus, peer firms’ CSR is theoretically expected to affect a firm’s CL. Following studies (Ma, 2017; Brown et al., 2018), current paper calls this indirect outcome as “spillover effect.” To provide some empirical evidence regarding this effect, this study develops and includes AKLDrf, a peer firms’ AKLD, in the regression of CL on CSR. the study defines the AKLDrf: Leader/Rival as AKLD of ‘Leader’/‘Rival’. Following Brown et al. (2018), this study defines the ‘Leader’ (’Rival’) as companies with greater than 20% of the market share of sales (companies having similar/closest total assets) within the same industry-year.
Table 9 displays the results. The results present the association of AKLDrf: Leader/AKLDrf: Rival and CL. The coefficients on the both AKLDs are negative significant (Coefficient = -0.052/0.017; sig = 0.041/0.056) for the regression of CL on the both peer firms’ AKLDs. Thus, these findings show that AKLD of peer firms negatively affects a firm’s CL, suggesting the spillover effect of CSR on CL. Moreover, the results suggest that the spillover effect from leaders is relatively larger than rivals.
Table 9. Spillover effect of CSR
| (1) CLit = γ0 + γ1 AKLDit + γ21 (AKLD rf: Learder)it + γ22 (AKLD rf: Rival)it + Controlsit + I_FE + Y_FE + εit (2) CLit = γ0 + γ1 AKLDit + γ21 (AKLD rf: Learder)it + Controlsit + I_FE + Y_FE + εit (3) CLit = γ0 + γ1 AKLDit + γ21 (AKLD rf: Rival)it + Controlsit + I_FE + Y_FE + εit | |||||||||||
|---|---|---|---|---|---|---|---|---|---|---|---|
| Regression (1) | Regression (2) | Regression (3) | |||||||||
| Indep.Var | Pred. | Coef. | sig | Pred. | Coef. | sig | Pred. | Coef. | sig | ||
| AKLD | − | -0.385** | 0.038 | − | -0.406** | 0.027 | − | -0.417** | 0.026 | ||
| AKLD rf: Learder | − | -0.052** | 0.041 | − | -0.063** | 0.033 | |||||
| AKLD rf: Rival | − | -0.017* | 0.056 | − | -0.014* | 0.068 | |||||
| Controls | Included | Included | Included | ||||||||
| Constant | Included | Included | Included | ||||||||
| I_FE | Included | Included | Included | ||||||||
| Y_FE | Included | Included | Included | ||||||||
| N | 437 | 437 | 437 | ||||||||
| Pseudo R2 | 31% | 27% | 25% | ||||||||
| Area Under ROC | 85% | 81% | 80% | ||||||||
| Explained (Total) Variance | 0.496 (0.571) | 0.472 (0.571) | 0.465 (0.571) | ||||||||
Table above displays the spillover effect of CSR (AKLD). The table shows the logistic estimation of AKLD rf — including Leaders’ AKLD/ Rivals’ AKLD — on CL (CL). The asterisks indicate a 1% (***), 5% (**), and 10% (*) level of significance.
CL = 1 if firm received a SEO CL in year t, & 0= otherwise AKLD = Total strengths - Total concerns in CSR dimensions; AKLD rf: Learder and AKLD rf: Rival refer to the AKLD of ‘Leader’ and ‘Rival’, respectively; Controls refer to the control variables, which are defined in Table 2; I_FE and Y_FE = Industry and Year fixed effects.
4.3.3. The Impact of Comment Letter on Subsequent Corporate Social Responsibility
Literature (e.g., Gupta et al., 2014; Bozanic et al., 2017; Hesarzadeh and Rajabalizadeh, 2020) highlights the diverse consequences of receiving CLs. For example, Hesarzadeh and Rajabalizadeh (2020) argue that companies enhance their disclosures after the receipt of CLs. Furthermore, companies exposed to higher litigation risk have higher conservatism in corporate reporting (e.g., Nelson & Pritchard, 2016). As a result, this paper expects the receiving CLs and future CSR is positively associated. To investigate this conjecture, this paper estimates the regression of AKLD in year t+1, on CL and the possible determinants of AKLD (see for example, Siegel & Vitaliano, 2007; Davidson et al., 2019).
Table 10 offers the empirical evidence. Briefly, the evidence indicates that the relationship between CL and AKLD is statistically significant (sig = 0.052). Further, this association is positive (0.019), suggesting that the CL leads to higher AKLD in subsequent years. Hence, consistent expectation, firms respond to CL by increasing CSR.
Table 10. Impact of CL on Subsequent CSR
| AKLDit+1 = γ0 + γ1CLit + γ1Ageit+1 + γ2Competit+1 + γ3Debtit+1 + γ4Divit+1 + γ5 CRICQit+1 + γ6 Govit+1 + γ7MTBit+1 + γ8 R&Dit+1 + γ9R_OAit+1 + γ10Sizeit+1 + I_FE + Y_FE + εit+1 | |||
|---|---|---|---|
| Indep.Var | Pred. | Coef. | sig |
| CL | + | 0.019* | 0.052 |
| Age | + | 0.001 | 0.317 |
| Compet | + | 0.003 | 0.479 |
| Debt | − | -0.021* | 0.095 |
| Div | − | -0.084** | 0.012 |
| CRICQ | − | -0.266*** | 0.000 |
| Gov | + | 0.315 | 0.020 |
| MTB | + | 0.012 | 0.210 |
| R&D | + | 0.147* | 0.089 |
| R_OA | + | 0.021 | 0.316 |
| Size | + | 0.004*** | 0.000 |
| Constant | Included | ||
| I_FE | Included | ||
| Y_FE | Included | ||
| N | 354 | ||
| Adj. R2 | 27% | ||
| Explained (Total) Variance | 0.390(1.445) | ||
Table above displays the OLS estimation of CSR (AKLD) on CL (CL). The asterisks indicate a 1% (***), 5% (**), and 10% (*) level of significance.
AKLD = Total strengths - Total concerns in CSR dimensions; CL = 1, if firm received a SEO CL in year t, & 0 = otherwise. Age = number of years the firm has been listed on TSE; Compet refers to Herfindhal-Hirschman index (market share of sales for each firm among all firms within the same industry-year); Debt = Total debt/Total assets; Div = Dividend/Total assets; CRICQ is the aggregation of corporate repotting/internal control quality metrics; Gov refers to the corporate governance quality score as constructed in Lopes et al. (2016); MTB = (market value of equity + total liabilities)/total assets; R&D = Research and development expense / total assets; R_OA = Operational profit/total assets; Size Ln(total assets). I_FE and Y_FE = Industry and Year fixed effects.
4.4. Additional Analysis
4.4.1. Endogeneity Analysis
CSR is probably associated with other aspects that influence CL. For example, it could be expected that companies with higher overall corporate reporting probably engage in more CSR, and this higher corporate reporting quality can reduce the CL. Under this condition, the main finding of this paper, i.e., the negative impact of CSR on CL, stems from variables other than CSR itself. For this reason, the results are potentially subject to endogeneity concerns.
To deal with the potential endogeneity, current paper conducts Heckman's (1979) two-stage approach and re-estimates the Equation (1). Specifically, in the first stage, the paper regresses CSR on the possible determinants of AKLD (see for example, Siegel and Vitaliano, 2007; Davidson et al., 2019), and calculates the inverse Mills ratio (IMR) from the regression. Then, in the second stage, the paper includes the IMR in the Equation (1) as a control variable to correct for potential endogeneity. Table 11 reports the results. As is evident from the table, with the correction of endogeneity, the coefficient on AKLD is -0.716, which is still significant at the 5 percent level (sig = 0.041). Hence, the negative impact of CSR on CL is robust to endogeneity concerns.
Table 11. Impact of CSR on CL: Correcting for the potential endogeneity of CSR
| First stage model: Prob [(AKLDdummy) = 1] = γ0 + γ1Ageit + γ2Competit + γ3Debtit + γ4Divit + γ5 CRICQit + γ6 Govit + γ7MTBit + γ8 R&Dit + γ9R_OAit + γ10Sizeit + I_FE + Y_FE + εit CLit = λ0 + λ1 (AKLD)it + λ21 (IMR)it + Controlsit + I_FE + Y_FE + εitCLit = λ0 + λ1 (AKLD)it + λ21 (IMR)it + Controlsit + I_FE + Y_FE + εit | |||
|---|---|---|---|
| Indep.Var | Pred. | Coef. | sig |
| AKLD | ? | -0.416** | 0.041 |
| IMR | ? | -0.004 | 0.319 |
| Controls | Included | ||
| Constant | Included | ||
| I_FE | Included | ||
| Y_FE | Included | ||
| N | 437 | ||
| Pseudo R2 | 25% | ||
| Area Under ROC | 80% | ||
| Explained (Total) Variance | 0.472(0.571) | ||
Table above displays the results concerning the association of CSR (AKLD) and CL (CL), after correcting for the potential endogeneity of CSR. Specifically, the Heckman two-stage approach is used and the test model is re-estimates after adding inverse mills ratio (IMR). The asterisks indicate a 1% (***), 5% (**), and 10% (*) level of significance.
CL = 1 if firm received a SEO CL in year t, & 0= otherwise AKLD = Total strengths - Total concerns in CSR dimensions; AKLDdummy = 1, if firm’s AKLD is greater than median, & 0= otherwise; Age = number of years the firm has been listed on TSE; Compet refers to the Herfindhal-Hirschman index (market share of sales for each firm among all firms within the same industry-year); Debt = Total debt/Total assets; Div = Dividend/Total assets; CRICQ is the aggregation of corporate repotting/internal control quality metrics; Gov refers to the corporate governance quality score as constructed in Lopes et al. (2016); MTB = (market value of equity + total liabilities)/total assets; R&D = Research and development expense / total assets; R_OA = Operational profit/total assets; Size Ln(total assets). I_FE and Y_FE = Industry and Year fixed effects.
4.4.2. The Impact of Total Strengths and Concerns on Corporate Social Responsibility
While CSR studies usually aggregate total strengths and total concerns for a single CSR measure, each component can represent distinct constructs (e.g., Mattingly & Berman, 2006; Kim et al., 2012). Particularly, studies (e.g., Cho et al., 2013; Flammer, 2013; Golden et al., 2018) discuss that total strengths and total concerns should not be aggregated. Hence, current study performs further examinations by decomposing CSR (AKLD) into its two components (AKLD+ and AKLD-). Table 12 reports the findings.
The findings represent that the relationship between AKLD+ and CL is significant (sig = 0.019). This relationship is negative (-0.498), suggesting that the higher strengths lead to a lower probability of the receipt of a CL. Further, the relationship between AKLD- and CL is relatively significant (sig = 0.056). This relationship is positive (0.058), suggesting that the higher concerns leads to more CL. In addition, the relationship between AKLD+ and CL is stronger than relationship between AKLD- and CL. This point suggests that CL is more closely related with CSR strengths.
Table 12. Impact of CSR by total strengths and concerns on CL
| (1) CLit = γ0 + γ1AKLDit + Controlsit + I_FE + Y_FE + εit (2) CLit = γ0 + γ1AKLDit+ + Controlsit + I_FE + Y_FE + εit (3) CLit = γ0 + γ1AKLDit- + Controlsit + I_FE + Y_FE + εit | |||||||||||
|---|---|---|---|---|---|---|---|---|---|---|---|
| Regression (1) | Regression (2) | Regression (3) | |||||||||
| Indep.Var | Pred. | Coef. | sig | Pred. | Coef. | sig | Pred. | Coef. | sig | ||
| AKLD | − | -0.432** | 0.036 | ||||||||
| AKLD+ | − | -0.498** | 0.019 | ||||||||
| AKLD- | + | 0.058* | 0.056 | ||||||||
| Controls | Included | Included | Included | ||||||||
| Constant | Included | Included | Included | ||||||||
| I_FE | Included | Included | Included | ||||||||
| Y_FE | Included | Included | Included | ||||||||
| N | 437 | 437 | 437 | ||||||||
| Pseudo R2 | 29% | 32% | 25% | ||||||||
| Area Under ROC | 82% | 86% | 81% | ||||||||
| Explained (Total) Variance | 0.484 (0.571) | 0.502 (0.571) | 0.441 (0.474) | ||||||||
Table above displays the logistic estimation of CL (CL) by strengths and concerns on CSR (AKLD). Specifically, AKLD+ (AKLD-) reflects total strengths (concerns) of CSR’s five social rating categories. Notable, for further clarity, the table also re-reports the association of AKLD and CL (i.e., regression (1)), which is presented in the Table 5. The asterisks indicate a 1% (***), 5% (**), and 10% (*) level of significance.
CL = 1 if firm received a SEO CL in year t, & 0= otherwise; AKLD = Total strengths - Total concerns in CSR dimensions; AKLD+ (AKLD-) refers to the total strengths (concerns) in CSR dimensions; Controls refer to the control variables, which are defined in Table 2; I_FE and Y_FE = Industry and Year fixed effects.
4.4.3. Lag Analysis of the Relationship between Corporate Social Responsibility and Comment Letter
As a further analysis, this paper examines whether the impact of CSR (AKLD) on CL (CL) is limited to one year. In this regard, the paper re-runs the test model using CLt+1 / CLt+2. Table 13 reports the findings. The findings represent that the association of AKLDt and CLt+1 / CLt+2 is significant (sig = 0.052 / 0.086) and negative (-0.183 / -0.054), suggesting that firms with more CSR are less likely to receive a CL on corporate reports of year t+1 / t+2. However, the impact of AKLDt on CLt+2 is significantly weaker than the impact of AKLDt on CLt+1 (CLt).
Table 13. Impact of CSR on subsequent CLs
| (1) CLit = γ0 + γ1AKLDit + Controlsit + I_FE + Y_FE + εit (2) CLit+1 = γ0 + γ1AKLDit + Controlsit+1 + I_FE + Y_FE + εit (3) CLit+2 = γ0 + γ1AKLDit + Controlsit+2 + I_FE + Y_FE + εit | |||||||||||
|---|---|---|---|---|---|---|---|---|---|---|---|
| Regression (1) | Regression (2) | Regression (3) | |||||||||
| Indep.Var | Pred. | Coef. | sig | Pred. | Coef. | sig | Pred. | Coef. | sig | ||
| AKLD | − | -0.432** | 0.036 | − | -0.183* | 0.052 | − | -0.054* | 0.086 | ||
| Controls | Included | Included | Included | ||||||||
| Constant | Included | Included | Included | ||||||||
| I_FE | Included | Included | Included | ||||||||
| Y_FE | Included | Included | Included | ||||||||
| N | 437 | 373 | 312 | ||||||||
| Pseudo R2 | 29% | 30% | 23% | ||||||||
| Area Under ROC | 82% | 85% | 80% | ||||||||
| Explained (Total) Variance | 0.474 (0.571) | 0.509 (0.589) | 0.491 (0.598) | ||||||||
Table above displays the logistic estimation of subsequent CL (CL) on CSR (AKLD). Notable, for further clarity, the table also re-reports the association of AKLD and CL (i.e., regression (1)), which is presented in the Table 5. The asterisks indicate a 1% (***), 5% (**), and 10% (*) level of significance.
CL = 1 if firm received a SEO CL in year t, & 0= otherwise; AKLD = Total strengths - Total concerns in CSR dimensions; Controls refer to the control variables, which are defined in Table 2; I_FE and Y_FE = Industry and Year fixed effects.
4.4.4. Field Evidence
To improve the robustness of causal inferences about the association of CSR and CL, this study provides evidence from interviews with SEO reviewers. Although field research suffers from problems such as small sample, the research provides an appropriate way to make sure about causal inferences that are endemic to archival research (Dichev et al., 2011). Hence, this paper conducts interviews with eight SEO reviewers. Author asks the SEO reviewers this question: “May I ask you to describe the SEO review process and the potential factors that directly or indirectly influence the process and issuance of CLs?” Author tried to let the reviewers tell us what is important at review process.
Table 14 contains selective parts of responses. Briefly, the responses show that SEO reviewers really use heuristic cues while examining the reliability of reports. For example, Reviewer #1 believes that “due to…, time pressure … we need to find some cues to efficiently and effectively select a firm for review…” Further, the results show that the voluntary and non-financial disclosures such as CSR, affects the CL. For example, Reviewer #6 says “… social responsibility information … are sources for our scrutiny”. Thus, the responses are generally consistent with causal inferences about the significant negative association of CSR and CL.
Table 14. Interviews with SEO Reviewers
| Question: “May I ask you to describe the SEO review process and the potential factors that directly or indirectly influence the process and issuance of CLs?” Responses:
|
Table above provides some field evidence on whether SEO reviewers address the CSR. Specifically, the table presents selective parts of responses about the scrutiny process of SEO.
5. Conclusion
This paper shows that CSR negatively affects CL, suggesting that CSR decreases CL. This finding is robust to (consistent with) endogeneity analysis (field evidence). On the one hand, the finding is consistent with those studies indicating that regulators understand the importance of CSR (e.g., Albareda, 2008; Chen et al., 2015; Brooks & Oikonomou, 2018). On the other hand, the finding is in line with literature suggesting that CSR may be an element of corporate risk management (Francis & Armstrong, 2003; Koh et al., 2013; Bae et al., 2020) and may help companies to improve a firm’s reputation (Wang & Qian, 2011; Liu et al., 2018).
This study further shows that the association of CSR and CL is larger among firms facing higher environmental information asymmetry and firms having higher corporate governance quality. These findings are comparable to evidence suggesting that the beneficial effect of corporate reporting is moderated by environmental information asymmetry and corporate governance quality (Bushman et al., 2011; Khan et al., 2012; Su et al., 2014; Cheng & Wu, 2014; Cao et al., 2019). Furthermore, the empirical findings reveal the spillover effect of CSR, in the sense that more CSR of peer firms increases a firm’s CL.
Generally, this is the first study that performs empirical tests on the relation between CSR and CL. Particularly, this study makes several important contributions. First, the study enriches the literature on the consequences of CSR (e.g., Dhaliwal et al., 2011; Brooks & Oikonomou, 2018; López-González et al., 2019; Tomas Siueia & Wang, 2019). In this regard, the results of this study highlight a new benefit of CSR (i.e., the reduction in CLs), and therefore, contribute to resolving a long-standing debate in CSR studies over whether or not companies should divert their scarce resources to improving their CSR. In addition, this study extends the current literature by presenting evidence on how the consequences of CSR may be reinforced. These contributions are important, especially for emerging markets. This is because, understanding the consequences of CSR in emerging markets and knowing the moderating factors which affect the consequences of CSR are very important. To clarify, firstly, in capital markets with poor institutional setting such as emerging markets, information resources are limited and it is relatively hard to communicate with information recipients about a company (Su et al., 2014). In this respect, CSR is an appropriate solution for companies to mitigate the problem (Levy & Kaplan, 2009). Secondly, CSR-related activities are considered critical in enabling emerging markets to foster economic development and social equity (Nair et al., 2019). Thirdly, there is a significant pressure by socially responsible investors and other stakeholders in emerging markets to adopt a business-model approach to CSR that links CSR to firm value creation (Narwal & Singh, 2013). Fourthly, there is a significant growth in the listing of local companies on international stock exchanges (Jackling & Johl, 2009) which emphasize on CSR. This development is accompanied by a drive to attract more foreign direct investment through developing CSR activities (Nair et al., 2019).
Second, this study extends the stream of research has formed to explore the determinants of public enforcement. Particularly, the study enriches the emerging literature (e.g., Robinson et al., 2011; Cassell et al., 2013; Johnston & Petacchi, 2017) on the determinants of receiving CLs by introducing a new factor (i.e., CSR) that reduces CLs. In addition, this paper to validate the causal inferences about the association of CSR and CL, for the first time, provides field evidence from interviews with regulatory reviewers. This is closely consistent with Rajgopal's (2019) call for better “integrating practice into accounting research” and providing “believable” findings from practitioners' perspectives.
Third, the study extends the study of Kim et al. (2012) on the association between CSR and earnings management (as captured by discretionary accruals, real operating activities, and Accounting and Auditing Enforcement Releases, namely AAER). Because: firstly, while the theoretical and empirical discussions in Kim et al.’s study focus on the relationship between CSR and earnings management, current study focuses on the relationship between CSR and CL. Secondly, although they and this paper use the releases of a securities commission, mainly AAER differs from CL, as the securities commissions issue (send) an AAER (a CL) if they find a fraudulent reporting (potential deficiency). For this reason, AAER (CL) is often used in accounting literature as a proxy for financial reporting misstatement (regulatory scrutiny) (see for example, Kim et al., 2012; Krishnan et al., 2018; Frankel & Yan Sun, 2018; versus Do & Zhang, 2018; Cazier et al., 2018; Naughton et al., 2018). Thirdly, while current paper conducts its study in a developing capital market, they conduct their research in the largest developed capital market, i.e., U.S capital market. In this regard, since the institutional setting of developed capital markets is different from that of developing capital markets in ways that affect the efficacy of CSR (Mohammad & Husted, 2019), we cannot easily speak to the generalizability of Kim et al.’s results outside of the developed capital markets. Finally, for the first time, the current study provides empirical evidence on the spillover effect of CSR in the context of CL.
The findings of this paper are of primary interest to managers and stockholders involved in the CL procedure. For example, (1) the findings offer a practical way, that is, increased CSR, to alleviate a significant risk (i.e., CL) faced by firms. In this regard, the findings show that this practical way may not be opportunistic, because more CSR does not influence the association of managerial misbehavior and CL. (2) The findings suggest how the aforementioned practical way may be more effective. In this regard, findings show that under higher environmental information asymmetry and higher corporate governance quality, the way is more effective. Regardless, the findings display the CSR as a significant determinant of CL that should be useful for academics who are looking for way to explain or model the securities commissions’ behavior/decision. Further, the findings raise a host of possible directions for future studies by highlighting the externalities of CSR in the capital market. Additionally, the findings should be useful for other stakeholders, such as financial analysts or external auditors, who like to evaluate different types of risks around companies, including regulatory risks.
This paper notes readers to exercise some caution while employing the results. This is because, firstly, in this research, sample includes firms listed on the TSE, that is, a less developed capital market. As mentioned by Su et al. (2014), in more developed capital markets, where more information is available, information users may assess the firms from diverse channels, and therefore, the relaying on signaling effect of CSR may be lower. As a result, the effect of CSR on CL may be less strong in more developed capital markets. Secondly, it is possible that the measure of CSR does not include all CSR information, such as those included in unknown websites, and therefore, it may bias against empirical findings. Thirdly, the measure of regulatory CL in this research may not reflect all of regulatory CL. As such, the effect of CSR on regulatory CL may be different for other regulatory CL. Fourthly, while this paper employs the Heckman two-stage approach to correct for the potential endogeneity, to the extent that this approach is not exhaustive, one should be cautious in drawing causal inferences.
Finally, current study encourages future research to a further examination of different institutional contexts, as there are some major differences of managers’ orientation across countries. For clarity, while in Anglo-Saxon countries, managers are more sensitive to satisfying the interests of stockholders, in Continental countries, managers are more inclined to the improvement of interaction with suppliers and banks (Surroca & Tribó, 2008). The study further encourages future research to use content and textual analysis in examining how CSR affects content, tone, and language of CLs. In addition, this study encourages future research to examine other important factors that may affect the relationship between the CSR and CL, such as the personality of mangers like managerial materialism—defined as “relatively high luxury asset ownership” (Davidson et al., 2019) —, or the characteristics of firms like political connections (Muttakin et al., 2018) and types of ownership (López-González et al., 2019). This is because these factors may provide a different signal for regulatory reviewers about the strategy and reliability of a firm’s CSR. For example, Davidson et al. (2019) discuss that the materialistic managers have lesser concern for others, and are less sensitive to how their actions affect the community and environment. Muttakin et al. (2018) suggest that the perceived need for CSR as a legitimation strategy diminishes for politically connected firms, and Bianchi et al. (2019) argue that in settings where the existence of political connections are viewed as damaging collective interests of stakeholders, political connected firms can deal with legitimacy issues from such connections by resorting to CSR practices and the reporting thereof. In addition, López-González et al. (2019) suggest that family firms have shown to have a singular behavior in terms of CSR, earnings management, and concern for maintaining their reputation.