The economic impact of audit failures
ABSTRACT
This paper examines the economic consequences associated with an audit failure in the field of statutory auditing services, by analyzing changes in the audit firm’s market share around the time of the investigation process undertaken by the Spanish Public Oversight Board. We explore the variations in audit market share by applying the difference in differences method to a treatment group of 70 sanctioned audit firms and a matched control group of 70 non-sanctioned audit firms. The period of analysis covers the years from 1999 to 2015. Our results show that the sanctioned audit firms suffered a significant decrease in their relative number of clients. Moreover, this measure of market share decreased not only after the publication of the sanction disclosure (which may be attributed to reputational losses) but also after the initiation of the investigation (which may be attributed to the firm’s reluctance to audit risky clients). Findings are similar for both small and large firms when the market share is measured in terms of clients, whereas the evidence is weak concerning variations in their turnover-based market share. Our conclusions could be of interest for audit firms and also for audit regulators when designing disciplinary systems.
Keywords: Sanction, Audit Failure, Market Share, Economic losses, Difference in Differences.
JEL classification: C23; C51; H83; M42; M48.
El impacto económico de los fallos de auditoría
RESUMEN
Este trabajo examina las consecuencias económicas asociadas a un fallo de auditoría en el ámbito de los servicios de auditoría legal, analizando los cambios en la cuota de mercado de la firma de auditoría en torno al momento del proceso de investigación emprendido por el Consejo de Supervisión Pública español. Exploramos las variaciones en la cuota de mercado de la auditoría aplicando el método de diferencia en diferencias a un grupo de tratamiento de 70 firmas de auditoría sancionadas y a un grupo de control emparejado de 70 firmas de auditoría no sancionadas. El periodo de análisis abarca los años comprendidos entre 1999 y 2015. Nuestros resultados muestran que las firmas de auditoría sancionadas sufrieron un descenso significativo en su número relativo de clientes. Además, esta medida de la cuota de mercado disminuyó no sólo después de la publicación de la comunicación de la sanción (lo que puede atribuirse a las pérdidas de reputación), sino también después del inicio de la investigación (lo que puede atribuirse a la reticencia de la empresa a auditar clientes de riesgo). Los resultados son similares tanto para las pequeñas como para las grandes empresas cuando la cuota de mercado se mide en términos de clientes, mientras que la evidencia es débil en lo que respecta a las variaciones de su cuota de mercado basada en el volumen de negocio. Nuestras conclusiones podrían ser de interés para las firmas de auditoría y también para los reguladores de la auditoría a la hora de diseñar sistemas disciplinarios.
Palabras clave: Sanción, fracaso de la auditoría, cuota de mercado, pérdidas económicas, diferencia en las diferencias.
Códigos JEL: C23; C51; H83; M42; M48.
1. Introduction
This study explores whether audit failures (AFs) cause economic losses to audit firms, over and above the monetary penalties. To that end, in line with Francis (2011), we identify an AF as an audit firm being sanctioned by the public oversight board (POB) for the misapplication of auditing standards.
Recent decades have witnessed major legislative endeavors (Sarbanes–Oxley Act of 2002, SOX; Directive 2006/43/EC; Directive 2014/56/EU; Regulation (EU) No 537/2014 for public-interest entities) aimed at enhancing audit quality and the reliability of the financial reporting. Of these regulatory frameworks, both SOX 2002 and European Directive 2006/43/EC required the implementation of an external and independent POB to assess and monitor the application of the audit rules and ethical principles by statutory auditors when performing legal audits.
The intrusion by the public authorities into an activity that had hitherto been self-regulated in many countries (Gonzalo & Garvey, 2018) represented a major shift in the legal audit quality controls because: i) it replaced the peer-review system that had prevailed till then with the new external and independent inspections (García-Osma et al., 2017); and ii) the POB was also empowered to penalize bad auditors and required to release information about the sanctions imposed on auditors. In the same vein, standard-setters such as the International Auditing and Assurance Standard Board stated that audit quality control procedures at the national level through the implementation of inspections and related disciplinary sanctions is of upmost importance (IFAC, 2014, p.15) in achieving the desired audit quality standards.
However, despite the emphasis placed by regulators and standard-setters on those measures, empirical evidence assessing their efficacy is scarce. Several studies address the pros and cons of the external POB as compared to the peer-review system (Lennox & Pittman, 2010; Anantharaman, 2012); the likelihood of being sanctioned according to the type of fraud (Firth et al., 2005); the efficacy of the enforcement actions in enhancing audit quality (Carcello et al., 2011; DeFond & Lennox, 2011; Gramling et al., 2011; De Fuentes et al., 2015); and the influence on accounting conservatism (Wang et al., 2011; Sun et al., 2016), among other issues. Moreover, standard setters such as the IFAC (International Federation of Accountants, 2014) and well-reputed audit researchers (Francis, 2011; DeFond & Zhang, 2014) call for contributions in this field.
This study attempts to respond to this call for research and address a gap in the audit literature by documenting the economic impact of both the investigations and the disciplinary sanctions. We build on a number of previous studies: Wilson & Grimlund (1990) described the negative evolution of the sanctioned audit firm’s market share; Davis & Simon (1992) revealed that SEC enforcement actions triggered a significant decline in audit fees. However, Lennox & Pitman (2010) found no evidence of significant market share variations after Public Company Accounting Oversight Board (PCAOB) inspections. Given these inconclusive results, the impact of AFs on the audit market remains an open research issue.
In addition, according to deterrence theory (Schneider, 1990; Entorf, 2012) fear of being penalized may stop auditors from engaging in bad practices. Most published studies focus on litigious environments such as the US (Carcello et al., 2011; Anantharaman, 2012; Lennox, 2005; Lennox & Pittman, 2010; Gunny & Zhang, 2013; Abbott et al., 2013), where there is a high likelihood of being sued (La Porta et al., 2006). In these contexts, the audit risk is higher and so are the expected losses, according to Simunic's (1980) model. However, there is scarce evidence in low litigation risk environments, such as the Spanish one (La Porta et al., 2006; Cano-Rodríguez, Sánchez-Alegría & Arenas-Torres, 2016), where the (higher) expected pecuniary losses due to disciplinary sanctions might offset the (lower) expected compensation from civil lawsuits. Moreover, following the EU recommendation (Commission Recommendation 2001/256/EC1), the administrative sanctions and penalties are published in the ICAC’s official bulletins and on its website. Therefore, reputational damage might also be caused, along with the monetary fines.
This work builds on Wilson & Grimlund (1990) but there are several relevant differences that justify the present research. The first refers to the period of time analyzed. Wilson & Grimlund (1990) analyzed the SEC audit enforcement actions releases from 1976 to 1986, when there were eight Big Auditing Firms2. Since then, the Big Eight has become the Big Four3, the existing international accounting firms throughout most of our period of study. Therefore, the economic consequences for the audit firms might be different because the market is more concentrated and big clients have fewer audit firms to choose from.
Second, Wilson & Grimlund (1990) used 18 observations, so the authors only described the variations in the variables of interest. In this study, we collected a large enough sample of AFs to apply more sophisticated econometric techniques, i.e. the difference in differences (DiD) method, which provides more robust results.
Third, Wilson & Grimlund (1990) examined changes in audit firms’ market share between the year before and the year after the SEC action, with a maximum gap of two years. Our study covers a longer period of analysis (17 years) so as to identify long-term trends in the exploratory variables.
Fourth, since the whole administrative process takes, on average, three years, we split our period of analysis into two parts: the initiation of the investigation and the public disclosure of the disciplinary sanction. This allows us to make the novel contribution of exploring the auditor’s reaction to the investigation being initiated. Audit scholars (Johsntone & Bedard, 2004) empirically document that audit firms exhibit risk avoidance when managing their portfolios. However, due to the competitiveness of the current audit market, the auditor’s reluctance to take on risky clients that might trigger administrative sanctions needs to be demonstrated.
Additionally, prior research (Lennox & Pitman, 2010) explores a sample that includes the inspections of the audit firmsquality control systems. Since the aim of this study is to investigate the impact of the sanctions on the audit market, we have removed from the sample the outcomes of the inspections of internal control systems, which commonly generate reports calling for improvements and do not trigger a disciplinary sanction.
Spain provides an appropriate setting to investigate the impact of sanctions. Unlike other European countries (García-Osma et al., 2017), the POB required by the EU did not represent a novelty in Spain: The Spanish Institute of Accounting and Auditing (ICAC by its initials in Spanish) has been responsible for audit quality controls and disciplinary actions ever since the passing of the Audit Act in 1988. Spain, therefore, has a long-standing tradition in the investigation of AFs, which makes it possible to build a long-term data set related to the sanctions and penalties.
In contrast to prior studies, we disentangle the effects in two different sub-periods. The first is the time surrounding the investigation, when only the audit firm is aware of the administrative process and able to anticipate its consequences. Thus, the market reaction, if any, can mainly be attributed to the auditor’s behavior. The second, subsequent event is the public disclosure of the sanction, when the whole audit market may react against the audit firm’s malpractice.
To achieve our research aim, the database comprises financial and non-financial information related to 70 sanctioned and 70 non-sanctioned matched audit firms. The longitudinal data cover a period of 17 years, spanning from 1999 to 2015. Thus, the whole sample consists of 2,380 firm-year observations, i.e., 1,190 firm-year observations correspond to sanctioned audit firms and 1,190 to their non-sanctioned counterparts.
Following prior literature (Wilson & Grimlund, 1990; Lennox and Pitman, 2010; Ruiz-Barbadillo et al., 2015), we estimate the economic losses through the audit firm’s relative weight in the audit market; that is, we analyze the variations in the audit firm’s market share. We measure the auditor’s market share through its turnover as well as its number of clients. To check the differences in our variables of interest before and after the events explained above, we apply the DiD method, in line with prior research related to audit enforcement releases (Sun, Cahan & Xu, 2016).
Our results reveal significant and negative variations in sanctioned audit firms’ market share with respect to non-sanctioned audit firms. This significant decline is found both at the time of the investigation and the public disclosure of the sanction. We also confirm that both small and large audit firms experience significant decreases in the relative number of clients, although the evidence is weak concerning their market share in terms of turnover.
This study contributes to the related literature in a number of ways: i) it offers novel evidence about the auditor’s reaction to the initiation of an investigation; ii) it provides more up-to-date and robust results compared to the descriptive analysis in Wilson & Grimlund's (1990) study; iii) it specifically explores the impact of an AF that resulted in the misapplication of auditing standards, whereas Lennox & Pitman (2010) also cover inspections of audit firmsquality control systems that are not directly linked to a violation of audit standards.
In our view, these results are relevant for regulators and standard-setters. Academics (Sullivan, 1993; Francis, 2011) have claimed that there is a strong disconnect between scholars and regulators, and that the latter mostly ignore the empirical evidence and the academic contributions of the former. However, Harris & William (2019) have recently documented that, since 2013, standard-setters (in particular the PCAOB in the US) have increasingly been incorporating an evidence-based policy-making approach. Therefore, considering the importance the European Union (Directive 2014/56/EU, whereas 1) and the IAASB (2014) place on this quality control tool, empirical evidence on the sanctioning process of the public oversight system could be helpful. Regulatory bodies in the auditing arena might consider the conclusions of this study when designing and implementing the sanctioning scheme, because sanctioned auditors bear not only the monetary fines but also face a significant drop in their economic activity.
In addition, audit firms might also consider the outcomes of this study. According to deterrence theory, they might be dissuaded from engaging in activities that lead to an AF if they anticipate a sanction or punishment (McDermott & Newhams, 1971; Pogarsky et al., 2004). In fact, EU Regulation 2014/56/EU (whereas 1) strongly emphasizes the potential deterrent effect of the penalties resulting from auditor malpractice. Therefore, firms’ acknowledgment of the overall economic consequences of violating audit standards might prevent future AFs.
Finally, our findings from the auditing field could be extended to other professional providers of credence goods, that is, those goods whose buyers cannot identify their quality even in retrospect (UK Competition Commission, 2013, p. 35). They should be aware of the full negative economic impact of providing services below the required/standard level.
The remainder of the study is structured as follows: section 2 describes the legislative framework, the Code of Ethics, as well as the investigation-sanction process; section 3 summarizes the literature underpinning the hypotheses we test; section 4 presents the sample selection and the research design; section 5 is devoted to explaining the results; and section 6 discusses the results and concludes.
2. Legislative framework and institutional setting
During the last two decades, we have witnessed ongoing regulatory changes in the audit arena aimed at enhancing the quality of legal audits of financial statements. European regulation relies on, among other mechanisms, a set of ethical standards for auditors and an audit quality assessment system.
The European Union is trying to improve financial reporting reliability through the enhancement of the auditor’s ethical attitude, among other policies. With that aim, European legislation (Directive 2006/43/EC, Regulation (EU) No 537/2014 and Directive 2014/56/EU) includes the general principles of the auditor independence safeguards published in the Code of Ethics, issued by the International Ethics Standard Board for Accountants (IESBA), which is an independent standard-setting board of the IFAC.
In Spain, Directive 2006/43/EC and Directive 2014/56/EU were transposed into national law through the Audit Acts passed in 2010 and 2015, respectively. Hence, the core of the Code of Ethics is currently embedded in the Spanish audit legislation that governs the audit profession, although audit scholars (Espinosa-Pike & Barrainkua, 2020) claim that further endeavors are needed to implement ethical and professional values on the accounting profession.
Regarding the audit quality assessment system, following SOX 2002, European regulation (Directive 2006/43/EC) also required the implementation of an external and independent POB to assess and monitor the quality of the statutory audits, in order to ultimately guarantee the accuracy of the information supplied to investors (Dillard et al., 2001).
In consequence, several European countries replaced their former peer-review systems with an external POB (García-Osma et al., 2017). However, this was not the case in Spain: since the Audit Act of 1988 stipulated the compulsory audit of annual accounts, the ICAC has been responsible for the investigations of audit engagements and, later, the inspections of internal quality control systems.
The investigation of audit engagements by the ICAC commonly starts i) ex officio, according to an annual plan; ii) as a consequence of a legal claim from the auditee’s shareholders; iii) in response to a requirement by another prudential, regulatory or supervisory authority; or iv) due to the quality controls carried out by the relevant professional associations (De Fuentes et al., 2015). The external inspectors report the deficiencies discovered during the investigation to the Audit Committee (an ICAC advisory board), which determines whether or not the statutory auditor committed an infraction, and if so, the related sanction. Auditors can appeal to the Administrative Courts to revoke the sanction. Hence, considering all the stages involved, the sanction itself represents an objective assertion of the AF, as Francis (2011) states.
The European quality assurance scheme for statutory audits also requires the public disclosure of penalties imposed as a consequence of the AF (art. 30 Directive 2006/43/EC; Directive 2014/56/EU; and Regulation (EU) No 537/2014). In Spain, both the infraction and the penalties are publicly disclosed in the ICAC’s official bulletin. If the auditor appeals to the Administrative Court, the disciplinary action is disclosed only when the sentence is irrevocable. Thus, the whole sanctioning process lasts, on average, 3.5 years.
3. Theoretical foundations and hypotheses development
There may be several drivers of a decline in the sanctioned audit firm’s market share. From the auditee’s point of view, the postulates of agency theory (Jensen & Meckling, 1976; Fama & Jensen, 1983) provide the theoretical framework to predict the economic consequences of the AF: the auditor’s role is to reduce the information asymmetries between the principal and the agent (Kothari et al., 2010) and, hence, to mitigate the moral hazard problems (Dechow et al., 2010). Therefore, if the auditor succumbs to managerial pressure and the audited financial statements are not in accordance with the applicable financial reporting framework, the shareholders might perceive that the auditor is not minimizing the information asymmetry problems and replace the incumbent sanctioned audit firm. In consequence, the dismissal will result in a reduction of the sanctioned audit firm’s market share.
In addition, the auditor’s reaction towards the administrative sanctions is empirically documented. Auditors react to sanctions by becoming more ethical (Abbott et al., 2013) and, when the sanction is severe enough, it incentivizes an improvement in audit quality and discourages auditors from committing the same infraction again (Sundgren & Svanström, 2013). Regarding the audit market share, the audit firm’s portfolio management might also prompt a decline in its market share. The audit service is a credence good (IAASB, 2014) and auditors make substantial investments in attaining a good reputation to signal the quality of their audit services. That is, auditors have market-based incentives to comply with audit standards and keep their reputation (Weber et al., 2008; Skinner & Srinivasan, 2012). If their reputation is jeopardized by the sanctions, the auditor may try to avoid additional sanctions by dropping the riskiest clients that demand a high level of permissiveness towards earnings manipulation. In this vein, Bedard & Johnstone (2004) document that auditors assess situations involving both an aggressive management and inadequate corporate governance, and that there is a relationship between those assessments and auditorsplanning and pricing decisions.
Hence, according to the premises of agency theory and in line with prior evidence, we test the following hypothesis:
H1: The sanctioned audit firm’s market share declines after the investigation-sanction process.
As stated above, an AF may lead to a decrease in the audit firm’s market share due to actions by both the audit firm and its clients. In order to disentangle these two effects, we identify two sub-periods within the investigation-sanction process, i.e. the investigation and the sanction period.
The first sub-period starts with the beginning of the quality control and ends with the public disclosure of the sanction, lasting, on average, 3 years.
During this period of time, it is mostly the audit firm and the investigation team that are aware of the quality control events. Over the course of this process, it is reasonable to expect a change in the audit firm’s behavior. In particular, it could be expected to become more conservative and less permissive towards aggressive accounting practices (Sundgren & Svanström, 2013), because financial scandals entail both reputational and economic losses that could lead to the sanctioned audit firm exiting the market, e.g. Arthur Andersen (Chaney & Philipich, 2002; DeFond & Lennox, 2011).
Prior research has revealed a number of portfolio management strategies audit firms employ to minimize the impact of the client risk: i) applying higher billing rates in order to offset the litigation risk losses associated with audit engagements (Simunic, 1980); ii) using specialist personnel (Johnstone & Bedard, 2003); and iii) shedding the riskiest clients (Johnstone & Bedard, 2004), among others. In this vein, Johnstone and Bedard (2004) demonstrate that both the client continuance and client acceptance decisions imply a less risky portfolio emerging over time. Moreover, they conclude that audit risk factors are more important in audit firm portfolio management decisions than financial risk factors are.
Hence, on the one hand, the inspected auditors might avoid the riskiest clients. On the other hand, clients that wish to carry on with earnings management practices might also abandon their current auditor and hire a more permissive audit firm. In both cases, the outcome would be a decrease in the sanctioned audit firm’s clients.
Accordingly, we predict that the audit firm’s market share will decrease in the post-investigation period. To test this statement, we posit the following hypothesis:
H2: The sanctioned audit firm’s market share declines after the investigation process.
Once the disciplinary sanction has been made public and clients might be aware of the audit firm’s misconduct, there may be additional reputation-based reasons for replacing the sanctioned auditor with a more reputable audit firm.
In first place, managers (agents) have incentives to replace the current sanctioned audit firm in order to signal to shareholders (principal) and other stakeholders their willingness to provide proper reports by applying the accounting and auditing principles and to act in accordance with the principal’s interest. Several studies corroborate this premise: Wilson & Grimlund (1990) demonstrate that audit firms involved in SEC Accounting and Auditing Enforcement actions tend to lose market share relative to their competitors; Hilary & Lennox (2005) conclude that audit firms with clean opinions from peer-review reports tend to gain more clients than firms receiving modified or adverse opinions; and Abbott et al. (2013) show that although auditors react to sanctions by becoming more ethical, their clients are still more likely to dismiss them. Conversely, Lennox & Pittman (2010) show that audit firms’ market shares are not sensitive to their PCAOB inspection reports. Moreover, their findings suggest that the audit market effects of peer-review reports declined after the creation of the PCAOB, because these reports became narrower in scope.
Another reason for the client to replace the sanctioned audit firm is to avoid the spillover effects of the financial scandal. Clients of an audit firm involved in a high-profile financial scandal suffered from negative economic consequences, as is the case of Laventhol & Horwath (Menon & Williams, 1994; Baber et al., 1995); Arthur Andersen (Chaney & Philipich, 2002; De Fuentes & Pucheta 2006; DeFond & Lennox, 2011) or KPMG (Weber et al., 2008). Consequently, managers of companies audited by a sanctioned audit firm might seek to avoid those negative spillover effects by replacing the bad audit firm.
In a nutshell, clients of sanctioned audit firms have strong incentives to switch audit firms and previous research confirms that clients are more likely to dismiss a sanctioned audit firm (Abbott et al., 2013). Hence, we posit the following hypothesis:
H3: The sanctioned audit firm’s market share declines after the publication of the sanction.
4. Research design and sample selection
4.1. Research design
We explore the impact on the audit market of an external shock; that is, the investigation-sanction process. To that end, we apply the DiD method because it is one of the most suitable techniques to estimate the impact of a specific intervention or external shock that does not apply to the whole population (Meyer, 1995; Bertrand, Duflo & Mullainathan, 2004; Puhani, 2012; Wooldridge, 2015). Furthermore, Lennox, Francis & Wang (2012) recommend this method in accounting research to circumvent many of the endogeneity problems that typically arise when making comparisons between heterogeneous individuals.
Typically, to analyze the outcome of an external intervention, both the treatment and the control group are not randomly identified but the consequence of the intervention/treatment itself (Vicens, 2006; Wooldridge, 2015). In our study, the treatment group consists of audit firms that were subject to an external investigation and were sanctioned due to their misapplication of audit standards when performing a particular audit engagement. On the contrary, the control group is made up of audit firms that were not sanctioned (of note, we cannot identify whether the non-sanctioned audit firms had been previously investigated or not). DiD compares the difference in outcomes before and after the intervention to the corresponding difference for unaffected (or control) groups.
The model requires: i) an exogenous source of variation, e.g. the investigation-sanction process; ii) a measurable outcome of the shock, which in our study is represented by the audit market share; iii) a treatment group, that is, the sanctioned audit firms; and iv) a control group, i.e. the non-sanctioned audit firms.
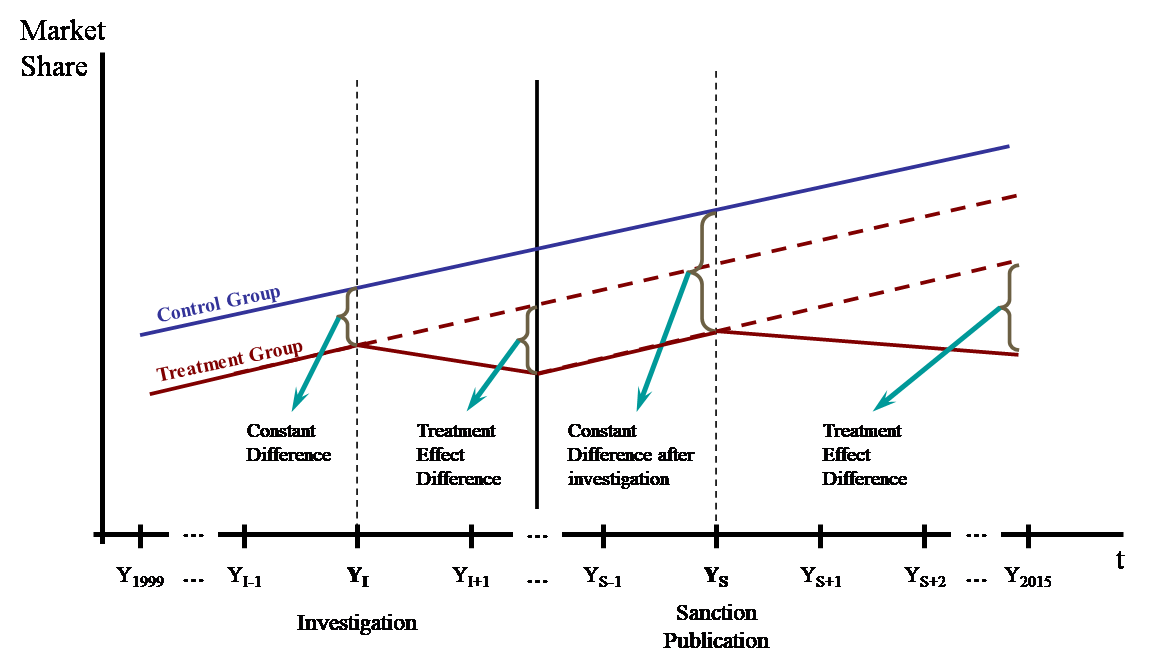
To better illustrate the decrease in the sanctioned audit firm’s market share tested in this study, Figure 1 shows how the ICAC’s disciplinary process might have an impact on both the treatment and control groups’ market share. Notably, a decline in the former does not necessarily trigger an increase in the latter because these two groups do not represent the whole audit market.
DiD also requires the assumption that changes in the dependent variable over time would have been the same in both the treatment and control groups in the absence of the external shock (Lechner, 2011). Therefore, in Figure 1 it is assumed that the audit market share in both the treatment and control groups would have been the same had the investigation not taken place.
It should be noted that Figure 1 is not intended to compare the treatment and control groups’ market shares. In fact, the treatment group might well have a bigger market share than the control group.
Figure 1. Difference in Differences in both Pre- and Post-Investigation and sanction events
Regarding the periods of time analyzed in this study, DiD requires that i) both the treatment and control groups are untreated during the pre-treatment period; ii) the intervention occurs between the pre- and post-treatment periods (Lechner, 2011).
Thus, our period of study starts in 1999, that is, one year before the initiation of the first investigation of our sample, and ends in 2015, three years after the last audit enforcement release of our sample.
Accordingly, to test H1, which refers to the whole investigation-sanction process, the data set comprises the years before the initiation of the investigation (Y1999 – YI-1) as the pre-treatment period, the years from the initiation of the investigation (YI) to the publication of the sanction (YS) as the treatment period, and the years after the publication of the sanction (YS – Y2015) as the post-treatment period.
In addition, we aim to disentangle the effects of the investigation and the publication of the sanction that make up the whole process. Hence, to test the effect of the investigation on the market share variations (H2), we analyze the interval comprising the years before the initiation of the investigation (Y1999 – YI-1) as the pre-treatment period, the year of the investigation (YI) as the treatment moment, and the years after the investigation (YI – Y2015) as the post-treatment period.
To explore the additional decline in the auditor’s market share (H3) due to the publication of the sanction and the subsequent expected damage to the auditor’s reputation, the analysis covers the years before the publication of the sanction (Y1999 – YS-1) as the pre-treatment period, the year of the sanction publication (YS) as the treatment moment, and the years after the publication of the sanction (YS – Y2015) as the post-treatment period.
To test our hypotheses, we develop the following three equations comprising the treatment, time and control variables:
\[\begin{equation} \label{eq1} \small \begin{split} MARKET\_SHARE_{it} =&\ \beta_{0} + \beta_{1}POSTINV\&SANC_{it} + \beta_{2}INV\& SANC_{it}\\ & + \beta_{3}POSTINV\&SANC_{it} \ast INV\& SANC_{it}\\ & + CONTROL_{it} + u \end{split} \ \ \ \ (1) \end{equation}\]
\[\begin{equation} \label{eq2} \small \begin{split} MARKET\_SHARE_{it} =&\ \beta_{0} + \beta_{1}POSTINV_{it} + \beta_{2}INV\& SANC_{it}\\ & + \beta_{3}POSTINV_{it} \ast INV\& SANC_{it}\\ & + CONTROL_{it} + u \end{split} \ \ \ \ (2) \end{equation}\]
\[\begin{equation} \label{eq3} \small \begin{split} MARKET\_SHARE_{it} =&\ \beta_{0} + \beta_{1}POSTSANC_{it} + \beta_{2}INV\& SANC_{it}\\ & + \beta_{3}POSTSANC_{it} \ast INV\& SANC_{it}\\ & + CONTROL_{it} + u \end{split} \ \ \ \ (3) \end{equation}\]
where:
We operationalize the variable of interest through the audit firm’s market share, MARKET_SHAREit, measured as the audit firm’s turnover i divided by total turnover generated by the whole audit market in year t (MS_TURN), following prior research (Lennox & Pitman, 2010; Ruiz-Barbadillo et al., 2015). We are aware that the audit firms might have cut their audit fees in order to retain their clients. Since we lack the information related to the individual audit fees per audit engagement, we have also estimated the market share as the number of clients of each audit firm i divided by the total number of clients in the audit market in year t, coded MS_CLIENTS (as in Craswell et al., 1995, or DeFond et al., 2000).
POSTINV&SANCit, POSTINVit and POSTSANCit are the time dummy variables that control for pre-treatment (coded 0) and post-treatment periods (coded 1). The analysis of the economic impact of each shock requires a period covering at least three years, i.e. the pre-treatment, the treatment and the post-treatment years. Thus, POSTINV&SANCit, related to H1, refers to the impact of the whole investigation-sanction period and, therefore, is coded 0 for the years before the initiation of the investigation and 1 for the years after the publication of the sanction. Since we also aim to disentangle the full impact into two components, we estimate POSTINVit, associated with H2, which is coded 0 for the years prior to the investigation and 1 for the year after the initiation of the investigation; and POSTSANCit which is coded 0 and 1 for the years before and after the publication of the sanction, respectively, to test H3.
INV&SANCit is the indicator variable, coded 1 for observations from the treatment group (investigated and sanctioned audit firms), and 0 for observations from the control group (non-sanctioned audit firms).
POSTINV&SANC*INV&SANCit, POSTINV*INV&SANCit and POSTSANC*INV&SANCit measure the interaction between the time period and the treatment variables. From that interaction, we can obtain the DiD effect, which explains the joint effect of an investigated and sanctioned audit firm in the post-treatment period (whole period, investigation period and sanction period, respectively).
In equation (1), \(\beta_{2}\) captures the incremental difference in market share between the sanctioned audit firms and the control group of non-sanctioned audit firms in the period prior to the investigation-sanction process, while \(\beta_{2} + \beta{3}\) captures the incremental difference between the treatment and control group in the post-investigation-sanction period. We are interested in \(\beta_{3}\), the coefficient on POSTINV&SANC*INV&SANC, which captures the DiD effect, i.e. the incremental difference in market share between the pre- and the post-investigation-sanction period for the treatment group after removing concurrent temporal effects (which are captured by the control group). Similarly, in equations (2) and (3), \(\beta_{3}\) captures the incremental difference in market share between the pre- and post-investigation period and between the pre- and post-sanction period, respectively, for the sanctioned audit firms.
Therefore, the coefficient \(\beta_{3}\) in models (1), (2) and (3) is the one that tests our hypotheses H1, H2 and H3, respectively.
We also need to control for individual characteristics that may influence the outcome of the intervention (Vicens, 2006):
Audit firm’s size. In Spain, as in many countries, the biggest audit firms not only audit the biggest companies (due to the economies of scale), but the fact that they are highly reputed means they also audit many small (Gonzalo & Garvey, 2018). As such, audit firm size is a key driver of its market share. The model thus controls for audit firm size by including total assets (TAi) and—since the audit service mostly relies on human capital—the number of employees (EMPLOYEESit), as in prior research (Gramling et al., 2011; Carcello et al., 2011; Zerni, Haapamaki & Jarvinen, 2012; Gunny & Zhang, 2013). The variable LARGE identifies the biggest audit firms, that is, those with the strongest reputation; it is therefore expected to be positively related to our variable of interest.
Audit firm’s leverage. According to general principles of debt contracting, firms with lower equity and higher financial leverage are less risk averse and more aggressive in their strategies to gain market share (Hilary & Lennox, 2005; DeFond & Lennox, 2011). Accordingly, the variable EQUITYit is expected to be inversely associated with our dependent variable.
Audit firm’s financial difficulties. According to Carcello et al. (2011), DeFond et al. (2002), Anantharaman (2012) and Gunny & Zhang (2013), among others, auditors facing financial difficulties might be more permissive towards earnings management practices in order to retain their clients. Hence, the model includes two financial performance measures; namely, operating cash-flow (OCFit) and the Zmijewski index (ZMIJEWSKIit).
The control variables are measured as follows:
- TAit = Natural logarithm of total assets of the audit firm i in year t.
- EQUITYit = Natural logarithm of the equity of the audit firm i in year t.
- EMPLOYEESit = The number of employees of the audit firm i in year t.
- OCFit = Operating cash flow of the audit firm i in year t deflated by total assets.
- ZMIJEWSKIit = Bankruptcy index, from Zmijewski (1984), of the audit firm i in year t.
- LARGEit = Coded 1 for BIG 44 and Second-Tier5 audit firms, and 0 otherwise.
4.2. Sample selection
The objective of the study is to explore the economic impact of the audit failures identified through external quality controls; in particular, the focus is on the type of malpractice that represents “a misapplication of audit standards that could have a significant effect on the results of the auditor’s work and, accordingly, on the audit report”6. This infraction could be penalized through monetary fines or through the temporary suspension of the audit activity, although the latter is very rare and was not imposed on any audit firm during our period of study.
Our database was initially composed of the infractions related to the statutory audits of the annual accounts whose year-end falls within the period 1999-2009. Our period of analysis ends in 2009, before the enactment of the 2010 Audit Act, which stipulated the implementation of internal quality controls in every audit firm, because this event constitutes an additional shock that might confound the results of our study.
Since the legal administrative process takes, on average, three years, as we explained in the preceding section, both the infractions and the related sanctions were disclosed in the ICAC’s Official Bulletins from 2002 to 2012. Thus, in order to analyze the impact on the audit market, we extended the data collection until 2015, three years after the last auditing enforcement release of our sample, which took place in 2012.
Data related to the whole audit market, such as the number of statutory audits carried out in one year or the audit market total turnover were sourced from the ICAC’s official bulletins.
The sample consists of audit firms and does not include sole practitioners, because there is no available financial information about them. In addition, although all sanctioned audit firms had previously been investigated, there was no information about investigated audit engagements that did not result in a disciplinary sanction.
Table 1. Sample of the study
| Audit firms | Observations | |
|---|---|---|
| Sanctioned audit firms due to “non-compliance with auditing standards that could have a significant effect on the results of the auditor’s work and, accordingly, on the audit report” (art. 16.2.c AA 1988/art. 16.3.b. AA amended by FA 2002/art. 34 b RT 2011) | 147 | 2,499 |
| Sanctions with incomplete information | (22) | (374) |
| Sample of sanctioned audit firms | 125 | 2,125 |
| Sanctions related to financial and insurance industry engagements | (12) | (204) |
| Audit firms with no available financial data during the period of study | (43) | (731) |
| Final Sample of Sanctioned audit firms | 70 | 1,190 |
| Control Sample of non-sanctioned audit firms | 70 | 1,190 |
| Total Sample | 140 | 2,380 |
As shown in Table 1, 147 audit firms were sanctioned by the ICAC from 2002 until 2012. Of those, 22 sanctions were eliminated from the sample due to incomplete information, meaning these cases were not fully explained in the ICAC’s Bulletin and it was not possible to identify the type of infraction. Following the typical exclusion criterion in the audit literature (among others, Biedma, Ruiz & Guiral, 2018), we dropped 12 audit firms that conducted the statutory audits of financial and insurance companies, because these industries are also supervised by financial and prudential regulators and their oversight processes commonly overlap. For 43 audit firms, we lacked financial data for most years of the analysis. Thus, the final sample consists of 70 sanctioned audit firms.
The control group consists of a matched sample of 70 non-sanctioned audit firms that can be considered nearest neighbors. In particular, before the investigation process starts, the non-sanctioned audit firm’s total assets are included in the [+ 5%; -5%] interval of the sanctioned audit firm’s total assets (following Hanlon, Maydew & Shevlin, 2008; Zerni et al., 2012; Sun et al., 2016).
We obtained the financial data, such as the audit firm’s total assets, equity or turnover from the SABI (Sistemas de Análisis de Balances Ibéricos) database. The annual turnover generated by the audit market and the number of statutory audit firms are published in the annual section devoted to the audit market in the ICAC’s Official Bulletins7.
The analysis is thus carried out on a final sample of 2,380 firm-year observations, comprising well-balanced panel data, although there is some missing data.
5. Empirical results
5.1. Descriptive statistics and univariate analysis
Table 2 displays the descriptive statistics for both the treatment and the control group. The variables are analyzed using the t-test (parametric test for difference in means) and the z-test (non-parametric Wilcoxon-Mann-Whitney test for difference in medians). As expected, the mean differences in total assets are not statistically significant, since we selected the control sample to match the corresponding audit firms according to their total assets, as explained above. However, MS_TURN in the control group (0.182%) is lower than in the treatment group (1.582%) and this difference is statistically significant at 1% (t-test coefficient of -1.400). Similar values are found for the variable MS_CLIENTS, which is also measured in percentage values. Values for EMPLOYEES and LARGE corroborate that the audit firms in the treatment group are, on average, bigger than those in the control group. This outcome might be explained by the fact that more audit firms labeled as LARGE have been sanctioned—3 big audit firms and 1 second-tier audit firms (0.057 of the treatment group)—than have not (0.028 of the control group). Conversely, audit firms included in the treatment group report less equity, that is, they have higher financial leverage (t-test coefficient of 0.280).
Additionally, the likelihood of facing financial difficulties (measured through the ZMIJEWSKI index and the operating cash flow, OFC) is not statistically different between the two groups.
Table 2. Descriptive statistics and univariate analysis of the treatment and the control group
| Control Group (INV&SANC =0) | Treatment Group (INV&SANC =1) | |||||||||
|---|---|---|---|---|---|---|---|---|---|---|
| Variables | N | Mean | Median | Stand. Dev. | N | Mean | Median | Stand. Dev. | t-test | |
| MS_TURN | 963 | 0.182 | 0.049 | 0.507 | 742 | 1.582 | 0.036 | 6.669 | -1.400 | *** |
| MS_CLIENTS | 1,190 | 0.006 | 0.002 | 0.022 | 1134 | 0.150 | 0.007 | 0.616 | -0.144 | *** |
| TA | 969 | 12.049 | 11.931 | 1.536 | 764 | 11.969 | 11.679 | 1.995 | 0.080 | |
| EQUITY | 959 | 11.032 | 11.008 | 1.711 | 710 | 10.752 | 10.590 | 1.742 | 0.280 | *** |
| EMPLOYEES | 751 | 16.145 | 4.000 | 45.002 | 575 | 89.351 | 4.000 | 355.946 | -73.206 | *** |
| OCF | 961 | 0.109 | 0.075 | 0.234 | 754 | 0.086 | 0.073 | 0.464 | 0.023 | |
| ZMIJEWSKI | 948 | 0.159 | 0.106 | 0.155 | 739 | 0.158 | 0.123 | 0.152 | 0.001 | |
| LARGE | 1,190 | 0.028 | 0.000 | 0.164 | 1,190 | 0.057 | 0.000 | 0.237 | -0.032 | *** |
MS_TURN is the percentage of the audit firm's market share, calculated as the audit firm's turnover divided by total audit market turnover in year t; MS_CLIENTS is the percentage of the audit firm's market share, calculated as the audit firm's clients divided by total audit market clients in year t; TA is the natural logarithm of total assets of the audit firm; EQUITY is the natural logarithm of total equity of the audit firm; EMPLOYEES is the number of employees working for the audit firm; OCF is the operating cash flow of the audit firm deflated by total assets; ZMIJEWSKI is the estimation by Zmijewski (1984) of the audit firm’s financial situation; LARGE is a dummy variable coded 1 for BIG 4 and Second-Tier audit firms, and 0 otherwise.
* significant at 10% level, ** significant at 5% level, *** significant at 1% level
We have also explored the correlation coefficients to identify any possible multicollinearity problems. The results (untabulated) show that the correlation coefficients between some variables are statistically significant, however, their Variance Inflation Factor (VIF) values are all below the threshold of 10, so they do not exhibit severe multicollinearity problems (Wooldridge, 2015). Additionally, we have confirmed that there is no multicollinearity in the DiD variables.
5.2. Hypotheses testing
As a preliminary analysis, we test whether the audit firm’s market share displays trends over time without considering the investigation process, within each sub-sample. With that aim, we run the model in Eq. (1) replacing the explanatory variables with a continuous variable that captures the market share evolution (YEAR).
The results in Table 3 indicate that, over the 17 years under study, the market share exhibits a negative trend. When the market share is measured by the audit firms’ turnover, both the treatment and the control group exhibit negative and significant coefficients (-0.049 and -0.003, respectively). When the market share is estimated as the relative number of clients, the treatment group displays a negative trend (-0.018), while the control group exhibits a significant and positive coefficient, although almost zero (0.000). Therefore, we can conclude that the treatment group’s market share slightly decreases over the period of analysis, while the control group’s market share displays similar behavior in terms of turnover but remains stable in terms of clients.
In addition, we may intuitively expect the decrease in the treatment group’s market share to be affected by the investigation-sanction process: the magnitude of the coefficients (-0.049 and -0.018) is bigger than those for their counterparts (-0.003 and 0.000).
Table 3. Regressions of audit firms’ market share on the continuous time variable
| Treatment Group | Control Group | |||||||||||
|---|---|---|---|---|---|---|---|---|---|---|---|---|
| (1) MS_TURN | (2) MS_CLIENTS | (3) MS_TURN | (4) MS_CLIENTS | |||||||||
| Variables | Coefficient | t-statistic | Coefficient | t-statistic | Coefficient | t-statistic | Coefficient | t-statistic | ||||
| Constant | 94.385 | 2.674 | *** | 35.585 | 5.589 | *** | 6.156 | 3.427 | *** | -0.310 | -2.500 | ** |
| YEAR | -0.049 | -2.748 | *** | -0.018 | -5.653 | *** | -0.003 | -3.679 | *** | 0.000 | 2.572 | ** |
| TA | 0.452 | 4.229 | *** | 0.110 | 5.670 | *** | 0.031 | 4.103 | *** | 0.000 | -0.873 | |
| EQUITY | -0.169 | -1.912 | * | -0.052 | -3.302 | *** | 0.008 | 1.164 | 0.000 | -0.712 | ||
| EMPLOYEES | 0.018 | 47.913 | *** | 0.001 | 8.206 | *** | 0.009 | 46.733 | *** | 0.001 | 39.516 | *** |
| OCF | 0.013 | 0.027 | -0.096 | -1.137 | 0.079 | 3.254 | *** | 0.001 | 0.315 | |||
| ZMIJEWSKI | -2.001 | -3.256 | *** | -0.454 | -4.077 | *** | 0.120 | 3.265 | *** | 0.004 | 1.424 | |
| LARGE | 0.783 | 1.594 | 1.054 | 11.793 | *** | 0.681 | 17.632 | *** | 0.026 | 9.639 | *** | |
| Observations | 521 | 502 | 730 | 730 | ||||||||
| Adj. R2 | 0.931 | 0.775 | 0.968 | 0.938 | ||||||||
| R2 | 0.931 | 0.775 | 0.968 | 0.938 | ||||||||
MS_TURN is the percentage of the audit firm's market share, calculated as the audit firm's turnover divided by total audit market turnover in year t; MS_CLIENTS is the percentage of the audit firm's market share, calculated as the audit firm's clients divided by total audit market clients in year t; YEAR is the year trend variable that controls for time effects during the period of analysis; TA is the natural logarithm of total assets of the audit firm; EQUITY is the natural logarithm of total equity of the audit firm; EMPLOYEES is the number of employees working for the audit firm; OCF is the operating cash flow of the audit firm deflated by total assets; ZMIJEWSKI is the estimation by Zmijewski (1984) of the audit firm’s financial situation; LARGE is a dummy variable that is coded 1 for BIG 4 and Second-Tier audit firms, and 0 otherwise.
* significant at 10% level, ** significant at 5% level, *** significant at 1% level
To corroborate these results an additional analysis was conducted. In this case, we replaced the continuous variable YEAR with a dichotomous variable (POSTINV&SANC) and re-ran the models of Table 3, to capture the market share variations between the pre-investigation and the post-sanction periods for both the treatment and the control groups. The results (unreported) are consistent with previous analyses on the continuous temporal variable.
Next, we tested whether the investigation-sanction process amplified the reported significant decline in the sanctioned audit firm’s market share. To that end, we apply DiD so that we can compare audit firms’ market share in the pre-investigation period with their market share in the post-sanction period after removing the exogenous time effect (Table 4).
Table 4. DiD regressions of the audit firms’ market share against the whole investigation-sanction period.
| MS_TURNOVER | MS_CLIENTS | |||||
|---|---|---|---|---|---|---|
| Variables | Coefficient | t-statistic | Coefficient | t-statistic | ||
| Constant | -1.059 | -2.496 | ** | -0.247 | -2.672 | *** |
| POSTINV&SANC | -0.081 | -0.709 | 0.002 | 0.067 | ||
| INV&SANC | 0.378 | 2.607 | *** | 0.224 | 7.128 | *** |
| POSTINV&SANC*INV&SANC | -0.288 | -1.684 | * | -0.201 | -5.397 | *** |
| TA | 0.337 | 5.721 | *** | 0.083 | 6.518 | *** |
| EQUITY | -0.253 | -4.945 | *** | -0.065 | -5.905 | *** |
| EMPLOYEES | 0.019 | 77.615 | *** | 0.001 | 18.249 | *** |
| OCF | -0.032 | -0.133 | -0.050 | -0.954 | ||
| ZMIJEWSKI | -1.691 | -5.221 | *** | -0.400 | -5.705 | *** |
| LARGE | 0.074 | 0.321 | 0.484 | 9.710 | *** | |
| Observations | 943 | 929 | ||||
| Adj. R2 | 0.934 | 0.672 | ||||
| R2 | 0.934 | 0.672 | ||||
MS_TURN is the percentage of the audit firm's market share, calculated as the audit firm's turnover divided by total audit market turnover in year t; MS_CLIENTS is the percentage of the audit firm's market share, calculated as the audit firm's clients divided by total audit market clients in year t; POSTINV&SANC is a dummy variable coded 1 for the period after the investigation-sanction process (entire enforcement process), and 0 for the period prior to it, for both the treatment and the control group; INV&SANC is a dummy variable coded 1 for observations from the treatment group, and 0 for observations from the control group; POSTINV&SAN * INV&SANC is the interaction between POSTINV&SANC and INV&SANC which indicates the DiD effect at the beginning of the investigation; TA is the natural logarithm of total assets of the audit firm; EQUITY is the natural logarithm of total equity of the audit firm; EMPLOYEES is the number of employees working for the audit firm; OCF is the operating cash flow of the audit firm deflated by total assets; ZMIJEWSKI is the estimation by Zmijewski (1984) of the audit firm’s financial situation; LARGE is a dummy variable coded 1 for BIG 4 and Second-Tier audit firms, and 0 otherwise.
* significant at 10% level, ** significant at 5% level, *** significant at 1% level
Table 4 displays the results of DiD regressions for the period covering the years before the initiation of the investigation and the years after the publication of the sanction, considering the investigation-sanction years as the treatment period. The coefficient \(\beta_{1}\) of POSTINV&SANC captures, ceteris paribus, the difference in the treatment group’s market shares before and after the investigation-sanction process. Neither of the coefficients (-0.081 and 0.002 for market share in terms of turnover and clients, respectively) are significant at conventional levels; therefore, there are no significant variations in the sanctioned audit firms’ market share before and after the investigation-sanction process.
\(\beta_{2}INV\&SANC\) captures the difference in market share between the treatment and the control sample. Both coefficients (0.378 and 0.224) related to turnover and clients, respectively, are positive and statistically significant and indicate that the sanctioned audit firms are bigger in terms of market share, ceteris paribus, than the non-sanctioned ones. These results are consistent with those reported in the descriptive statistics section.
We are interested in \(\beta_{3}\), the coefficient of the interaction variable POSTINV&SANC*INV&SANC, which captures the DiD effect, i.e. the difference between the treatment and the control group in the pre-investigation and the post-sanction period (which captures the temporal effect). This coefficient is found to be negative and significant for both measures, i.e., the sanctioned audit firms experience an additional 0.288% decrease in turnover and an additional 0.201% decrease in clients compared to the evolution experienced by the control group in the same periods of time, although the result for turnover is only significant at 10%. Therefore, the results are consistent with our hypothesis H1.
In general, the results of the control variables are in line with those reported in the descriptive statistics section. Regarding the variables that control for the audit firm size, we observe that the bigger the audit firm, the higher the market share measured through turnover, since both coefficients of TA and EMPLOYEES exhibit positive and significant coefficients (0.337 and 0.083, respectively). These dependent variables exhibit the same sign and level of significance when the market share is estimated using the number of clients. LARGE is significant only for the market share in terms of clients, registering a coefficient of 0.484 at the 1% level of significance.
On the contrary, as expected, total equity is found to have a negative and significant coefficient for turnover (-0.253) and market share in terms of clients (-0.065): more indebted firms show a more aggressive attitude towards gaining market share.
Audit firms in greater financial difficulties perform worse: both market share measures are negatively associated with the likelihood of bankruptcy (the ZMIJEWSKI coefficient is negative and significant in each case). However, the operating cash flow (OCF) is not significant.
It is worth noting that the model has high explanatory power for the turnover-based market share (adjusted R2 of 93.4%) and fairly high for the client-based market share (67.2%).
As stated above, we split the period of analysis into two sub-periods covering the beginning of the investigation and the publication of the sanction. Table 5 presents the results related to the first sub-period, which comprises the years prior to the initiation of the investigation as the pre-treatment period and the years following that event as post-treatment period. In this case, the coefficient of interest, that is, of the interaction variable (POSTINV*INV&SANCit) is negative and significant. Therefore, the effect is consistent with H2 because both dependent variables (TURNOVER and CLIENTS) decrease by an additional 0.300% and 0.188%, respectively, for the sanctioned firms during the investigation period.
The results for the control variables are consistent with those for the whole investigation-sanction process.
Table 5. DiD regressions of the audit firms’ market share against the investigation sub-period.
| MS_TURN | MS_CLIENTS | |||||
|---|---|---|---|---|---|---|
| Variables | Coefficient | t-statistic | Coefficient | t-statistic | ||
| Constant | -1.083 | -2.871 | *** | -0.259 | -3.277 | *** |
| POSTINV | -0.045 | -0.404 | 0.008 | 0.355 | ||
| INV&SANC | 0.398 | 2.709 | *** | 0.227 | 7.444 | *** |
| POSTINV*INV&SANC | -0.300 | -1.822 | * | -0.188 | -5.503 | *** |
| TA | 0.253 | 4.731 | *** | 0.071 | 6.370 | *** |
| EQUITY | -0.170 | -3.619 | *** | -0.053 | -5.437 | *** |
| EMPLOYEES | 0.019 | 85.500 | *** | 0.001 | 22.696 | *** |
| OCF | 0.154 | 0.757 | -0.001 | -0.028 | ||
| ZMIJEWSKI | -1.149 | -4.006 | *** | -0.298 | -5.002 | *** |
| LARGE | -0.084 | -0.411 | 0.444 | 10.486 | *** | |
| Observations | 1,251 | 1,232 | ||||
| Adj. R2 | 0.924 | 0.668 | ||||
| R2 | 0.924 | 0.668 | ||||
MS_TURN is the percentage of the audit firm's market share, calculated as the audit firm's turnover divided by total audit market turnover in year t; MS_CLIENTS is the percentage of the audit firm's market share, calculated as the audit firm's clients divided by total audit market clients in year t; POSTINV is a dummy variable coded 1 for the period after the beginning of the investigation, and 0 for the period prior to it, for both the treatment and the control group; INV&SANC is a dummy variable coded 1 for observations from the treatment group, and 0 for observations from the control group; POSTINV*INV&SANC is the interaction between POSTINV and INV&SANC which indicates the DiD effect at the beginning of the investigation; TA is the natural logarithm of total assets of the audit firm; EQUITY is the natural logarithm of total equity of the audit firm; EMPLOYEES is the number of employees working for the audit firm; OCF is the operating cash flow of the audit firm deflated by total assets; ZMIJEWSKI is the estimation by Zmijewski (1984) of the audit firm’s financial situation; LARGE is a dummy variable coded 1 for BIG 4 and Second-Tier audit firms, and 0 otherwise.
* significant at 10% level, ** significant at 5% level, *** significant at 1% level
Table 6 provides the results of the DiD regressions designed to test H3. The interaction variable, POSTSANC*INV&SANC, shows significant and negative coefficients for both MS_TURN (-0.257) and MS_CLIENTS (-0.135), that is, the sanctioned audit firms’ market share declines during the sanction period. Therefore, the results of this analysis confirm H3.
Once again, the coefficients for the control variables are consistent with those reported in previous analyses, and the explanatory power of the models remains very high.
Table 6. DiD regressions of the audit firms’ market share against the sanction sub-period.
| MS_TURN | MS_CLIENTS | |||||
|---|---|---|---|---|---|---|
| Variables | Coefficient | t-statistic | Coefficient | t-statistic | ||
| Constant | -1.115 | -3.005 | *** | -0.268 | -3.437 | *** |
| POSTSANC | -0.079 | -0.874 | -0.003 | -0.161 | ||
| INV&SANC | 0.287 | 2.862 | *** | 0.148 | 7.020 | *** |
| POSTSANC*INV&SANC | -0.257 | -1.878 | * | -0.135 | -4.692 | *** |
| TA | 0.261 | 4.904 | *** | 0.075 | 6.800 | *** |
| EQUITY | -0.174 | -3.724 | *** | -0.056 | -5.795 | *** |
| EMPLOYEES | 0.019 | 85.565 | *** | 0.001 | 22.570 | *** |
| OCF | 0.100 | 0.485 | -0.006 | -0.136 | ||
| ZMIJEWSKI | -1.181 | -4.105 | *** | -0.306 | -5.096 | *** |
| LARGE | -0.094 | -0.460 | 0.445 | 10.443 | *** | |
| Observations | 1,251 | 1,232 | ||||
| Adj. R2 | 0.924 | 0.665 | ||||
| R2 | 0.924 | 0.665 | ||||
MS_TURN is the percentage of the audit firm's market share, calculated as the audit firm's turnover divided by total audit market turnover in year t; MS_CLIENTS is the percentage of the audit firm's market share, calculated as the audit firm's clients divided by total audit market clients in year t; POSTSANC is a dummy variable coded 1 for the period after the publication of the sanction, and 0 for the period prior to it, for both the treatment and the control group; INV&SANC is a dummy variable coded 1 for observations from the treatment group and 0 for observations from the control group; POSTSANC*INV&SANC is the interaction between POSTSANC and INV&SANC which indicates the DiD effect at the time of publication of the sanction; TA is the natural logarithm of total assets of the audit firm; EQUITY is the natural logarithm of total equity of the audit firm; EMPLOYEES is the number of employees working for the audit firm; OCF is the operating cash flow of the audit firm deflated by total assets; ZMIJEWSKI is the estimation by Zmijewski (1984) of the audit firm’s financial situation; LARGE is a dummy variable coded 1 for BIG 4 and Second-Tier audit firms, and 0 otherwise.
* significant at 10% level, ** significant at 5% level, *** significant at 1% level
Finally, we also explored whether the market reaction is related to the audit firms size. To that end, we run DiD regressions for two separate groups of audit firms, LARGE (BIG8 plus SECOND-TIER9 audit firms) and the set of audit firms labeled SMALL. Regarding the whole investigation-sanction process (results depicted in Table 7), the market share evolution displayed by the LARGE audit firms is clear: the coefficients of the interaction variable POSTINV&SANC*INV&SANC are negative both in terms of turnover and clients, although only the latter is significant, at 1%. Conversely, the interaction coefficient for SMALL auditing firms is positive for MS_TURN, and is negative and significant at 1% when the dependent variable is measured through the number of clients (the coefficient is -0.018). Notably, in the latter case, the explanatory power of the model falls to an Adjusted R2 of 19.4%. Therefore, regardless of the sanctioned audit firm’s size, the number of clients declines significantly in the post-sanction period. On the contrary, the coefficients for market share measured through turnover are found to be non-significant in both groups.
Table 7. DiD regressions of audit firms’ market share against the whole investigation-sanction period for Large and Small audit firms
| SMALL Audit Firms | LARGE Audit Firms | |||||||||||
|---|---|---|---|---|---|---|---|---|---|---|---|---|
| MS_TURN | MS_CLIENTS | MS_TURN | MS_CLIENTS | |||||||||
| Variables | Coefficient | t-statistic | Coefficient | t-statistic | Coefficient | t-statistic | Coefficient | t-statistic | ||||
| Constant | -0.210 | -9.319 | *** | -0.035 | -3.733 | *** | -68.431 | -6.539 | *** | -5.532 | -3.709 | *** |
| POSTINV&SANC | -0.015 | -2.691 | *** | -0.001 | -0.274 | -3.101 | -2.346 | ** | -0.107 | -0.570 | ||
| INV&SANC | -0.015 | -2.141 | ** | 0.028 | 9.610 | *** | 1.762 | 1.248 | 1.840 | 9.143 | *** | |
| POSTINV&SANC*INV&SANC | 0.011 | 1.291 | -0.018 | -5.309 | *** | -0.545 | -0.339 | -1.569 | -6.846 | *** | ||
| TA | 0.013 | 4.468 | *** | 0.001 | 0.806 | 4.597 | 6.210 | *** | 0.554 | 5.252 | *** | |
| EQUITY | 0.006 | 2.151 | ** | 0.002 | 1.854 | * | 0.238 | 0.380 | -0.168 | -1.880 | * | |
| EMPLOYEES | 0.011 | 36.062 | *** | 0.001 | 4.234 | *** | 0.010 | 7.720 | *** | 0.000 | 1.353 | |
| OCF | 0.068 | 6.117 | *** | -0.003 | -0.531 | -5.304 | -0.819 | -0.394 | -0.427 | |||
| ZMIJEWSKI | 0.053 | 3.325 | *** | 0.015 | 2.263 | ** | -13.865 | -3.398 | *** | -1.851 | -3.184 | *** |
| Observations | 877 | 863 | 66 | 66 | ||||||||
| Adj. R2 | 0.782 | 0.194 | 0.960 | 0.903 | ||||||||
| R2 | 0.782 | 0.194 | 0.960 | 0.903 | ||||||||
MS_TURN is the percentage of the audit firm's market share, calculated as the audit firm's turnover divided by total audit market turnover in year t; MS_CL is the percentage of the audit firm's market share, calculated as the audit firm's clients divided by total audit market clients in year t; LARGE: Deloitte, PWC, KPMG and Ernst and Young, BDO, GRANT THORNTON, MAZARS, AUREN, PKF ATTEST, MOORE STEPHENS, HORWATH and GASSÓ RSM.; POSTSANC is a dummy variable coded 1 for the period after the publication of the sanction, and 0 for period prior to it, for both the treatment and the control group; INV&SANC is a dummy variable coded 1 for observations from the treatment group, and 0 for observations from the control group; POSTSANC*INV&SANC is the interaction between POSTSANC and INV&SANC which indicates the DiD effect at the time of publication of the sanction; TA is the natural logarithm of total assets of the audit firm; EQUITY is the natural logarithm of total equity of the audit firm; EMPLOYEES is the number of employees working for the audit firm; OCF is the operating cash flow of the audit firm deflated by total assets; ZMIJEWSKI is the estimation by Zmijewski (1984) of the audit firm’s financial situation.
* significant at 10% level, ** significant at 5% level, *** significant at 1% level
The results of the DiD regressions considering the investigation sub-period, displayed in Table 8, show that both the SMALL and LARGE investigated audit firms experience a greater decrease in the relative number of clients than the control group does (significant coefficients of -0.016 and -1.286 respectively). The turnover-based market share does not exhibit significant variations.
Table 8. DiD regressions of audit firms’ market share against the investigation sub-period for Large and Small audit firms
| SMALL Audit Firms | LARGE Audit Firms | |||||||||||
|---|---|---|---|---|---|---|---|---|---|---|---|---|
| MS_TURN | MS_CLIENTS | MS_TURN | MS_CLIENTS | |||||||||
| Variables | Coefficient | t-statistic | Coefficient | t-statistic | Coefficient | t-statistic | Coefficient | t-statistic | ||||
| Constant | -0.252 | -10.774 | *** | -0.032 | -4.213 | *** | -67.773 | -6.369 | *** | -7.045 | -4.25 | *** |
| POSTINV | -0.014 | -2.289 | ** | -0.001 | -0.304 | -1.949 | -1.337 | 0.002 | 0.007 | |||
| INV&SANC | -0.015 | -1.823 | * | 0.028 | 10.226 | *** | 1.831 | 1.136 | 1.802 | 7.174 | *** | |
| POSTINV*INV&SANC | 0.009 | 0.992 | -0.016 | -5.261 | *** | -0.413 | -0.235 | -1.286 | -4.701 | *** | ||
| TA | 0.017 | 5.298 | *** | 0.001 | 0.444 | 4.428 | 5.803 | *** | 0.658 | 5.538 | *** | |
| EQUITY | 0.006 | 2.088 | ** | 0.002 | 2.470 | ** | 0.259 | 0.382 | -0.184 | -1.741 | * | |
| EMPLOYEES | 0.011 | 33.316 | *** | 0.001 | 5.454 | *** | 0.011 | 7.526 | *** | 0.000 | 0.012 | |
| OCF | 0.064 | 5.687 | *** | 0.000 | 0.025 | 3.288 | 0.479 | 0.736 | 0.688 | |||
| ZMIJEWSKI | 0.065 | 3.948 | *** | 0.018 | 3.411 | *** | -12.191 | -3.162 | *** | -1.799 | -2.994 | *** |
| Observations | 1,169 | 1,150 | 82 | 82 | ||||||||
| Adj. R2 | 0.706 | 0.197 | 0.944 | 0.846 | ||||||||
| R2 | 0.706 | 0.197 | 0.944 | 0.846 | ||||||||
MS_TURN is the percentage of the audit firm's market share, calculated as the audit firm's turnover divided by total audit market turnover in year t; MS_CL is the percentage of the audit firm's market share, calculated as the audit firm's clients divided by total audit market clients in year t; LARGE: Deloitte, PWC, KPMG and Ernst and Young, BDO, GRANT THORNTON, MAZARS, AUREN, PKF ATTEST, MOORE STEPHENS, HORWATH and GASSÓ RSM.; POSTSANC is a dummy variable coded 1 for the period after the publication of the sanction, and 0 for the period prior to it, for both the treatment and the control group; INV&SANC is a dummy variable coded 1 for observations from the treatment group, and 0 for observations from the control group; POSTSANC*INV&SANC is the interaction between POSTSANC and INV&SANC which indicates the DiD effect at the time of publication of the sanction; TA is the natural logarithm of total assets of the audit firm; EQUITY is the natural logarithm of total equity of the audit firm; EMPLOYEES is the number of employees working for the audit firm; OCF is the operating cash flow of the audit firm deflated by total assets; ZMIJEWSKI is the estimation by Zmijewski (1984) of the audit firm’s financial situation.
* significant at 10% level, ** significant at 5% level, *** significant at 1% level
Finally, the results related to the sanction sub-period (Table 9) confirm the negative and significant trend in the relative number of clients for both groups of firms, while the turnover-based measure is not significant.
Table 9. DiD regressions of audit firms’ market share against the sanction period for Large and Small audit firms
| SMALL Audit Firms | LARGE Audit Firms | |||||||||||
|---|---|---|---|---|---|---|---|---|---|---|---|---|
| MS_TURN | MS_CLIENTS | MS_TURN | MS_CLIENTS | |||||||||
| Variables | Coefficient | t-statistic | Coefficient | t-statistic | Coefficient | t-statistic | Coefficient | t-statistic | ||||
| Constant | -0.256 | -10.981 | *** | -0.035 | -4.496 | *** | -73.562 | -7.347 | *** | -7.636 | -5.064 | *** |
| POSTSANC | -0.011 | -2.227 | ** | 0.001 | 0.298 | -2.574 | -2.332 | ** | -0.100 | -0.602 | ||
| INV&SANC | -0.012 | -2.032 | ** | 0.021 | 11.293 | *** | 1.791 | 1.475 | 1.413 | 7.722 | *** | |
| POSTSANC* INV&SANC | 0.006 | 0.764 | -0.011 | -4.440 | *** | -1.411 | -0.990 | -1.233 | -5.742 | *** | ||
| TA | 0.017 | 5.367 | *** | 0.001 | 0.792 | 4.747 | 6.771 | *** | 0.750 | 7.098 | *** | |
| EQUITY | 0.005 | 1.997 | ** | 0.002 | 2.157 | *** | 0.277 | 0.485 | -0.236 | -2.749 | *** | |
| EMPLOYEES | 0.011 | 33.428 | *** | 0.001 | 5.351 | *** | 0.011 | 8.292 | *** | 0.000 | 0.103 | |
| OCF | 0.061 | 5.319 | *** | 0.001 | 0.232 | 2.395 | 0.412 | 0.606 | 0.692 | |||
| ZMIJEWSKI | 0.061 | 3.707 | *** | 0.018 | 3.363 | *** | -10.504 | -2.911 | *** | -1.859 | -3.422 | *** |
| Observations | 1,169 | 1,150 | 82 | 82 | ||||||||
| Adj. R2 | 0.706 | 0.181 | 0.952 | 0.877 | ||||||||
| R2 | 0.706 | 0.181 | 0.952 | 0.877 | ||||||||
MS_TURN is the percentage of the audit firm's market share, calculated as the audit firm's turnover divided by total audit market turnover in year t; MS_CLIENTS is the percentage of the audit firm's market share, calculated as the audit firm's clients divided by total audit market clients in year t; LARGE: Deloitte, PWC, KPMG and Ernst and Young, BDO, GRANT THORNTON, MAZARS, AUREN, PKF ATTEST, MOORE STEPHENS, HORWATH and GASSÓ RSM.; POSTSANC is a dummy variable coded 1 for the period after the publication of the sanction, and 0 for the period prior to it, for both the treatment and the control group; INV&SANC is a dummy variable coded 1 for observations from the treatment group, and 0 for observations from the control group; POSTSANC*INV&SANC is the interaction between POSTSANC and INV&SANC which indicates the DiD effect at the time of publication of the sanction; TA is the natural logarithm of total assets of the audit firm; EQUITY is the natural logarithm of total equity of the audit firm; EMPLOYEES is the number of employees working for the audit firm; OCF is the operating cash flow of the audit firm deflated by total assets; ZMIJEWSKI is the estimation by Zmijewski (1984) of the audit firm’s financial situation.
* significant at 10% level, ** significant at 5% level, *** significant at 1% level
5.3. Additional analyses and robustness tests
In order to assess the robustness of our results, we have performed several additional analyses that are explained below.
5.3.1. Expanding the audit failures to include those related to the banking and financial industries
In the accounting and auditing literature, the financial industry is typically excluded from the sample since it has its own accounting, regulatory, supervisory and prudential rules (Gebhardt & Novotny-Farkas, 2011; Osma, Mora & Porcuna-Enguix, 2019). When it comes to oversight, financial and insurance entities are not only subject to audit supervision but also to additional external inspections such as those carried out by the Banco de España, Dirección General de Seguros and prudential regulators. Therefore, the financial and insurance industries merit specific treatment. Unfortunately, the number of observations in this study associated with these industries was not enough to perform the statistical analysis.
Nevertheless, we re-ran the analysis on an extended sample that included financial and insurance entities. Results, not reported for the sake of brevity, differed somewhat from those found in the main analysis. Similarly, to the main results reported above, the sanctioned audit firms experience a negative and significant impact in terms of market share; however, the decrease in their market share is significantly amplified during the investigation period but not after the publication of the sanction. A plausible explanation for this finding is that the administrative process in this case usually differs from those associated with non-financial entities: the investigations of their audit engagements tend to be preceded by systemic banking crises. Cases such as Banesto, Bankia or Banco Popular were not only the subject of fierce debate in regulatory, academic and social forums but were also widely commented on by the mass media. Therefore, when the audit investigation was launched, the stakeholders were presumably well aware of the bank’s debacle and the potential associated AF. Thus, the audit firms might have suffered reputational losses by the time the POB initiated the investigation.
However, broader samples of AFs in the financial industry might lead to alternate conclusions and, therefore, this remains an open research issue.
5.3.2. Alternative measures of the dependent variable
Although market share is a relative measure that i) scales the variables of interest, i.e. turnover and clients; and ii) incorporates the audit market evolution into the model, we have also tested our hypotheses by measuring the variables in absolute terms, that is, without considering the rest of the audit market. To that end, the dependent variables were measured through the natural logarithm of the audit firms’ turnover and the audit firms’ number of audited clients.
The results obtained are consistent with the baseline model. Only the coefficient that captures the incremental difference in turnover-based market share at the initiation of the investigation turns out to be not significant.
5.3.3. Extended control sample
The matching procedure applied to build the sample for the main analysis (following Sun et al., 2016) entails a very restrictive condition, since every sanctioned audit firm was paired with a non-sanctioned audit firm of similar size in terms of assets [-5%; +5%] at the beginning of the investigation process.
However, according to Wooldridge (2015), big samples are closer to the whole population and they therefore reduce the variance of estimations, yielding less biased estimations. In the same vein, Zmijewski (1984) points out that when the size of the control sample is similar to the population size, comparisons between the treatment and the control sample are more consistent and less biased than when the control sample is small. Therefore, to better estimate the evolution of the audit market, following Wooldridge (2015) and Zmijewski (1984), and similar to prior research (Abbott et al., 2013; Chi et al., 2013; Anantharaman et al., 2016), we built another control sample made up of the whole population of audit firms with available information, which consisted of 4,590 non-sanctioned audit firms.
Additionally, instead of running the model on the whole period of analysis, from 1999 to 2015, we built the sample by including only the observations related to an eight-year period for every sanction. Therefore, for every sanctioned audit firm and the control sample, the investigation-sanction period started the year prior to the initiation of the investigation and ended three years after the publication of the sanction. In this case, the panel database consisted of 4,673 audit firms (4,590 non-sanctioned plus 83 sanctioned audit firms) and it covered a period of eight years for each sanction, yielding 37,384 firm-year observations.
Notably, the coefficients show the same sign and the significance is higher than for the previously reported results with the matched sample, as they are all significant at the 1% level.
To sum up, the additional analyses corroborate the main findings of this study.
6. Discussion of results and conclusions
In recent decades, systemic financial scandals have raised serious concerns about earnings management practices and auditors’ permissiveness towards them. Malpractice by the statutory auditor can be penalized by means of three different processes, which may overlap: i) administrative sanctions imposed by the auditing regulator; ii) civil penalties and; iii) reputational losses, which are often an outcome of the other two processes.
In countries such as Spain, where lawsuits against auditors are uncommon, the other two sources of deterrence to prevent AFs are of outmost importance. On the one hand, regarding the administrative process, European legislation (Directive 2006/43/EC; Directive 2014/56/EU) requires Member States to implement a POB and a disciplinary scheme in order to guarantee the auditor’s compliance with the auditing rules. On the other hand, the compulsory publication of the infraction and the related sanction might entail reputational damages and amplify the negative economic impact of the AF.
This paper documents the negative economic impact, other than the monetary fine, associated with the administrative process of an AF. To that end, we split the period of analysis to cover two different but related events, i.e. the beginning of the investigation by the POB and the publication of the sanction.
This study finds that the sanctioned audit firms register an additional and significant decrease in their market share, regardless of whether it is measured through revenues or clients. It also reports novel evidence on the economic impact of two sub-periods included in the administrative process, which might be the consequence of different courses of action: the decrease in market share during the investigation might be attributed to the auditor’s avoidance of risky clients (as in Johnstone and Bedard, 2004); while the negative evolution after the publication of the sanction might be the consequence of the audit market reaction against a bad auditor.
Therefore, it seems that the quality controls exercised by a POB constitute a relevant deterrent against auditors incurring an AF. Stakeholders are sensitive to the information disclosed by the ICAC. Hence, the ICAC’s transparency policy seems to be helpful for the stakeholder’s decision-making process (Argandoña, 2003) and an effective enforcement tool for the auditing rules.
Additionally, we empirically document that both large and small audit firms suffer from a negative and significant decline in their relative number of clients, although the outcomes in terms of turnover-based measures of market share are not conclusive.
The results of this research may be useful for audit firms, regulatory bodies and standard-setters, all of which should consider the economic impact of AFs not only from the monetary penalties but also stemming from a significant drop in the audit firms economic activity.
However, this study has a number of limitations. Firstly, there is no information related to investigated auditors that received a clean/good assessment. That said, this issue does not seriously impair our research because neither the auditor nor the market should react adversely to a good/standard audit service.
Secondly, the study does not account for how many bad audits have been performed by the sanctioned audit firms and, therefore, we do not conclude that all sanctioned auditors are bad auditors (although they underperformed on at least, one legal audit). In consequence, we cannot associate the decrease in mar ket share with other, undetected, bad audits.
This study documents two negative economic impacts in two sub-periods. Different theoretical frameworks can be applied to explain these findings: agency theory may explain the auditor’s avoidance of risky clients at the beginning of the investigation, whereas reputational theory provides a plausible explanation for the market reluctance to hire/renew the contract of a sanctioned audit firm. However, the audit market can anticipate the outcome of the administrative investigation if it is the consequence of a financial scandal that has been documented by the mass media or if some information has leaked during the investigation process. If this is the case, our assessment of the auditor’s behavior prior to the audit enforcement release might also be capturing the client’s response. Our results using a sample that includes financial entities support this hypothesis, however, we cannot determine whether the entire negative impact should be exclusively attributed to the audit market or if the audit firm’s reaction also plays a role.
Regarding the applied methodology, DiD is often used in accounting research because it controls for the potential bias caused by endogeneity. However, as Lennox et al. (2012) state, the endogeneity is controlled as long as its unobserved source is time-invariant, and this is a strong assumption that cannot be empirically validated.
In addition, although the period of study ends when compulsory internal quality controls were implemented under the 2010 Audit Law, we cannot rule out the possibility of alternative explanations for audit market behavior, which prevents us from eliciting causal relationships. That said, our results are robust to alternate measures, control samples and periods of analyses.
Finally, since prior research (Davis & Simon, 1992) has documented that audit enforcement releases were followed by a reduction in audit fees, and we could not test this due to lack of data on fees, we believe that our results might be biased due to this omitted factor. Nevertheless, although we verify that the number of clients also decreases in the post-sanction period, the decrease in total turnover might in part be caused by a significant cut in fees.