Management's choice of tone in letters to shareholders: sincerity, bias and incentives
ABSTRACT
This paper aims to identify the drivers of management reporting choices in a setting characterized by ownership concentration and weak enforcement. Previous research indicates, that tone of the letter to shareholders is correlated with performance. However, tone can be biased towards the positive when a company is highly responsive to stock market incentives or controlled by majority investors. Bias can be reduced by the monitoring activities of institutional investors in closely held companies. There are two major implications of the study. First, when managers bias the text, they lose the ability to communicate positive news about their company. Under rational expectations investors can detect bias based on known situational incentives and disregard the biased information. Second, the results suggest that managers manipulate tone strategically, rather than unconsciously, to satisfy the needs of key shareholder groups.
Keywords: Ownership concentration, Tone, Letter to shareholders, Incentives, Textual analysis.
JEL classification: G32, M41.
La elección del tono de la dirección en las cartas a los accionistas: sinceridad, sesgo e incentivos
RESUMEN
El objetivo de este artículo es identificar los factores que impulsan las decisiones de los directivos en materia de información en un entorno caracterizado por la concentración de la propiedad y la escasa aplicación de la ley. Investigaciones anteriores indican que el tono de la carta a los accionistas está correlacionado con los resultados. Sin embargo, el tono puede estar sesgado hacia lo positivo cuando una empresa es muy sensible a los incentivos del mercado de valores o está controlada por inversores mayoritarios. El sesgo puede reducirse gracias a las actividades de supervisión de los inversores institucionales en las empresas de capital cerrado. El estudio tiene dos implicaciones importantes. En primer lugar, cuando los directivos sesgan el texto, pierden la capacidad de comunicar noticias positivas sobre su empresa. En el marco de las expectativas racionales, los inversores pueden detectar el sesgo basándose en los incentivos situacionales conocidos y desestimar la información sesgada. En segundo lugar, los resultados sugieren que los directivos manipulan el tono estratégicamente, y no de forma inconsciente, para satisfacer las necesidades de los principales grupos de accionistas.
Palabras clave: Concentración de la propiedad, Tono, Carta a los accionistas, Incentivos, Análisis textual.
Códigos JEL: G32, M41.
1. Introduction
This paper looks at the interplay of situational factors that drive managers’ when writing the letter to shareholders. We study the tone of the text, the balance of positive and negative expressions. Managers may bias the text by using positive tone in order to sway investor opinion, or they may attempt to use a level of tone that reflects the situation of the company in a sincere manner. They are influenced, in their reporting decisions, by the input they receive from investors and shareholders (Bebchuk & Hamdani, 2009). When a company is attractive to investors, the managers respond to the needs of a broad range of interested investors (Daske et al., 2013). In contrast, when a company is closely held by a majority shareholder, the managers may focus on that key relationship rather than cater to the needs of minority shareholders (Mäki et al., 2016). Institutional investors can also exert pressure on the management (Kalay, 2015). Ours is among the first studies to study the combination of these factors and their effects on managerial reporting decision.
The letter to shareholders is a formal text in which the management present the performance and prospects of a company. The letter provides information in a succinct and non-technical manner, making it more accessible to readers than the entire annual statement (Hooghiemstra, 2010). The letter to shareholders is therefore read by investors (Fanelli & Grasselli, 2006; Prasad & Mir, 2002), it affects investment decisions and stock prices (Abrahamson & Amir, 1996; Keusch et al., 2012). The letter is an important element of the communication between companies and investors. In Europe, the letter is required as an element of the annual corporate statements. Its’ contents are weakly regulated, however, and subject to minimal audit requirements. This creates an interesting study setting, where the textual disclosure is mandatory, but managers enjoy a large degree of freedom in structuring the content.
The study of accounting texts has a long tradition (Hildebrandt & Snyder, 1981). It gained prominence when the increased complexity and uncertainty reduced the usefulness of traditional accounting numbers (Beattie, 2014). The increased use of text and visuals spurred research in impression management (Merkl-Davies & Brennan, 2017). Coincidentally, the quantitative study of textual disclosure has been facilitated by the development of technologies for automated textual analysis (Loughran & McDonald, 2016). Researchers began to probe the contents of textual disclosures such as goodwill impairment tests (Glaum et al., 2013; Klimczak et al., 2016), risk-factor disclosure (Campbell et al., 2014; Jorgensen & Kirschenheiter, 2003; Linsley & Lawrence, 2007), and the entire annual statement (Clatworthy & Jones, 2001; Loughran & McDonald, 2011; Tan et al., 2014).
Over time, the interpretations of what it is that textual disclosures constitute multiply instead of consolidating (Rutherford, 2018). Texts have been studied as the means to manipulate user impressions (Brennan et al., 2009; Huang et al., 2014) or to build reputation for sincere communication (Brennan & Merkl-Davies, 2018; Patelli & Pedrini, 2014; Yuthas et al., 2002). The analysis of textual disclosures has been performed with the view to assess the psychological traits of CEOs (Brennan & Conroy, 2013; Buchholz et al., 2018), predict litigation (Rogers et al., 2011), fraud (Humpherys et al., 2011) and stock price movements (Feldman et al., 2010; F. Jiang et al., 2018). The abundance of interpretations and theoretical frames applied to accounting texts suggests that texts can perform many functions much like accounting numbers do. Consequently, the study of tone can be consolidated by framing it in terms of accounting choice (Fields et al., 2001).
Our study is motivated by the literature that identifies linguistic tone as a key characteristic of textual disclosures. When writing a letter to shareholders, managers select the level of tone that corresponds to the current performance of the company and their expectations regarding the future (Abrahamson & Amir, 1996; Patelli & Pedrini, 2014). Such behavior is consistent with the concept of communicative action aimed at developing a common understanding of the company, rather than with attempts to manipulate the readers (Patelli & Pedrini, 2014; Yuthas et al., 2002). It is also consistent with the strategic disclosure literature which argues that managers make a choice to communicate sincerely with investors even when disclosure is cost-less and non-verifiable (Stocken, 2000). The intuition behind these findings is simple: biased disclosure would be discovered ex post, leading investors to disregard any further communication from that company. This literature is contrasted with empirical studies that attempt to identify bias in textual disclosures (Baginski et al., 2018; Huang et al., 2014). We suggest that the two streams, studies of sincere communication and bias, can be integrated by including situational incentives in the model. We present quantitative evidence that stock market incentives, ownership concentration and monitoring by institutional investors influence the extent to which managers bias tone.
We contribute to the literature in a number of ways. First, we apply the accounting choice methodology (Fields et al., 2001) to study rational determinants of the choice that managers make between different levels of tone. Prior literature tends to associate tone with company performance, sidelining incentives that drive the use of tone. We provide an in-depth explanation of these incentives, taking into account the multivariate interactions between them. Second, we add new evidence to the literature that looks at the impact of the balance of power between key shareholder groups on management reporting choice (Mäki et al., 2016). The country context that we chose facilitates this line of research, because ownership concentration is more common than in the traditional samples, increasing the variance in shareholder structure. Third, we use an ordinal measure of tone that allows us to differentiate in the cross section of letters between the degrees of how positive or negative a text is. Prior literature relies on ratio or score measures based on interval scales that cannot be interpreted in absolute terms and compared (Henry & Leone, 2016). The ordinal measure enables us to carry out a detailed marginal analysis of the effects incentives and their interactions have on the probability of choosing a specific level of tone.
The paper is structured as follows. In Section 2, we review the literature on the use tone and its determinants in order to develop the hypothesis. In Section 3, we discuss the methods applied for the measurement of tone and present our research model. In Section 4, we describe the sample. Next, Section 5 contains estimation results for the logit regressions and marginal analysis. Section 6 discusses the results, their implications and limitations. Section 7 concludes.
2. Literature review and hypothesis development
Tone is probably the most often studied characteristic of accounting texts. It has been studied in the contexts of market efficiency and communication with stakeholders (Baginski et al., 2018; Benamara et al., 2016; Kearney & Liu, 2014; Li, 2010a; Loughran, 2018; Loughran & McDonald, 2016). From the perspective of a human reader, tone, referred to also as linguistic tone (Baginski et al., 2018; Loughran, 2018) or sentiment (Henry & Leone, 2016; Kearney & Liu, 2014), can be defined as the extent to which managers frame company results and outlook in a favourable manner (Rogers et al., 2011, p. 2161). It focuses the analysis on the manager’s action of writing a text. The most common application of that definition is the counting of positive and negative words that appear in a text (Baginski et al., 2018; Kearney & Liu, 2014). Another definition that is often cited considers the feelings aroused in the reader by a communication (Henry, 2008, pp. 376-377). It focuses the analysis on the reception of a text by the readers. This approach requires that researchers confront a representative group of readers with a text to measure their response.
A significant body of literature confirms that tone, on average, is incrementally informative and price-relevant (Baginski et al., 2018; Henry, 2006). Researchers confirm that a positive relation exists between performance and tone in earnings press releases (Davis et al., 2012), earnings conference calls (Allee & Deangelis, 2015) and letters to shareholders (Abrahamson & Amir, 1996). Nevertheless, tone can be biased if managers attempt to mislead readers (Frazier et al., 1984; Henry & Leone, 2016). This can happen when managers are faced with situational incentives, such as the sensitivity of their personal wealth to the stock price effects of information (Davis & Tama-Sweet, 2012), their equity incentives (Arslan-Ayaydin et al., 2016) and weak corporate governance (Melloni et al., 2016). In this paper, we attempt to combine the various factors that influence managers in their decision to use a given level of tone.
2.1. The effect of performance on tone
Abrahamson and Amir (1996) show that tone is correlated with annual performance numbers for up to three years ahead. Feldman et al. (2010) reach a similar conclusion in their study of next quarter earnings surprise. Yuthas et al. (2002) apply an ethical lens based on Habermas’ norms of communicative action to explain managers’ behaviour. They make a distinction between strategic action, aimed at achieving a specific goal, and communicative action, aimed at building common understanding. They argue that managers are sincere when writing the letter by accurately representing their perceptions, areas of interest and corporate objectives. Patelli and Pedrini (2014) provide supporting empirical evidence by measuring how optimistic managers are, and how this measure of tone correlates with current and future performance. They note the need to investigate the role of incentives in the use of tone, which is the aim of our paper.
Managers cannot continuously mislead investors, even if at times they may resort to bias. Patelli and Pedrini (2014) argue that persistent misrepresentation would be detrimental to organisational legitimacy, which renders such behaviour economically unsustainable for the company. On an individual level, insincere managers would lose their reputation and damage their prospects in the job market, as future employers may fear the potential impact of the manager’s negative reputation on the credibility of company disclosures (Mercer, 2004).
Further arguments against the sustainability of the continuous use of bias can be found in the strategic accounting literature (Stocken, 2000). Managers may resort to bias in a single isolated reporting event, especially when the disclosure is non-routine and non-verifiable ex post. Investors, however, are aware of that risk, so they disregard the disclosure. When management disclosures are made repeatedly, managers cannot resort to bias because ex post verification is possible. If investors discover bias, they disregard all subsequent disclosures rendering management disclosure useless as a communication tool. This suggests that communication is sincere in equilibrium.
In sum, the literature shows that managers, on average, attempt to select the level of tone that corresponds not only to the present situation of the company, but also its prospects. Present performance constitutes public knowledge, as it can easily be verified. The prospects, or future performance, constitute private knowledge of the managers. We hypothesize that:
Hypothesis 1. The effect of private (future) performance information on tone is incremental to the effect of public (past) performance information.
2.2. The effect of market incentives on tone
It has long been recognised in the literature that incentives associated with the position a company occupies in the stock market play a predominant role in determining the accounting choices made by management (Ball et al., 2003; Daske et al., 2013; Isidro & Raonic, 2012). The effects of incentives can be observed directly in some cases. For example, companies change their disclosure practices when the management recognise an opportunity to attract institutional investors, after the company is included in an attractive index portfolio (Lin et al., 2018). In other cases, incentives can be inferred from a combination of factors. A growing company will have a chance of capturing investor attention, and will therefore tend to communicate be more positive about its prospects than a stagnant company, for example. This effect may be contingent on other factors, however. A growing company that relies on bank finance may chose a more conservative approach.
Daske et al. (2013) approach reporting incentives as a latent variable that can be measured using other observable variables. They provide an extensive review of the reporting incentives literature that leads them to identify key firm characteristics that affect reporting behaviour: company size, profitability, leverage and growth opportunities. In addition, they show that investors are aware of these characteristics. Thus, reporting incentives are public information. Investors can use this information to put company disclosures in context and adjust their trading decisions accordingly. We build on the approach of Daske et al. (2013) and we introduce composite equity market incentives as a determinant of the use of tone. Companies that are more attractive to investors are more motivated to maintain optimism about their prospects, even if that implies bias in the use of tone.
Hypothesis 2. Equity market incentives increase the level of tone.
2.3. The effect of ownership structure on tone
Ownership structure and the nature of shareholder groups are another source of incentives that modify management’s reporting decisions (Bebchuk & Hamdani, 2009). Financial reporting is less important as a communication medium when ownership is concentrated. When the controlling shareholder is the most important user of accounting information, the dispersed investors have little impact on reporting choices (Mäki et al., 2016). It is the controlling shareholder that sets the incentives for the management, and the management exert efforts to accommodate their interests.
Ownership structure has not been researched widely because ownership tends to be dispersed and broad in the US stock market. Nevertheless, it is common in some other markets characterised by greater information asymmetry. Studies find that ownership concentration is associated with lower timeliness of disclosures in Japan (Nagata & Nguyen, 2017), greater stock price synchronicity in China (Gul et al., 2010) and broader bid-ask spreads in New Zealand (H. Jiang et al., 2011). We consider ownership structure as a major determinant of management bias in the use of tone in our setting characterised by a high degree of ownership concentration. We hypothesize that it leads managers to adopt a positive stance regardless of actual performance. They can bias tone, because information asymmetry prevents minority investors from verifying the information they receive.
Hypothesis 3. Ownership concentration increases the level of tone.
Institutional investors may take the role of external monitors and lead to improved reporting (Ang et al., 2000). They substitute for corporate governance structures, which are not effective in limiting self-serving behaviour when ownership is concentrated (Brown et al., 2011; Bushman et al., 2004). Institutional investors have been shown to motivate companies to adopt predictable, consistent disclosure practices (Kalay, 2015), and improve financial reporting (Mäki et al., 2016) and voluntary disclosure (Schoenfeld, 2017). Consequently, the presence of institutional investors may counter the incentives for a biased use of tone when ownership is concentrated.
Hypothesis 4. The effect of ownership concentration is mitigated by the presence of institutional investors.
3. Methods
3.1. Tone
We use an ordinal measure of tone. Our ordinal scale comprises a range of options for the level of tone, ranked from negative to positive. Each step on the scale is distinct in terms of the direction of evaluation (positive vs negative) and the intensity of evaluation (Klimczak et al., 2017, pp. 53-56). This allows us to avoid confusion that arises when researchers use a ratio of word counts to measure tone, without establishing what any level of that ratio entails (Henry, 2008; Loughran & McDonald, 2011). Baginski et al. (2016) state in a note that it is unclear whether their ratio measure is a level variable or a change variable. Still, they suggest that neutral tone is the norm. Studies based on Loughran and McDonald’s (2011) word-lists refer to negative tone as the norm, simply because the mean value of the measure is negative in a typical sample. In contrast, the seminal study of Hildebrandt and Snyder (1981) argued that positive tone is the norm, as our own research suggest. We add this argument in favour of human-based measurement to the discussion in Henry and Leone (2016).
The importance of discriminating between the levels of tone is signalled in the literature. Feldman et al. (2010) suggest that investors place less trust in positive disclosures, as evidenced by greater excess post announcement drift returns. Baginski et al. (2016) concur. Baginski (2018) found that greater investor disagreement occurs after positive disclosures, again pointing to lower credibility. In an experimental study, researchers removed the positive elements of disclosures to make them neutral (Tan et al., 2014). Results point again to lower credibility of the positive tone. In sum, bias is associated with the level of tone. Discriminating between levels of tone is an important methodological question. Once we can observe in which cases tone is positive or very positive, we can determine what situational incentives lead managers to introduce more positive bias into their tone.
We measure tone manually. Manual analysis of text is more detailed (Brennan et al., 2009) and more flexible (Guillamon-Saorin et al., 2017) than automated techniques. It can be criticised as being subjective (Brennan et al., 2009). Following the framework established in impression management studies (García Osma & Guillamón-Saorín, 2011; Guillamon-Saorin et al., 2017; Melloni et al., 2016) and relying on previous research in manual text analysis (Krippendorff, 2018), we develop a coding procedure and instructions to ensure the reliability and validity of coding. We carry out the coding ourselves.
Manual coding of the tone variable is performed by two researchers who fill a standard worksheet for each letter. The results are then compared and a consensus is reached. The coders were asked to measure tone twice: for the first paragraph and for the whole text. In each case, they indicated the level of tone on a 4-point scale, making an additional note if the tone varied within a letter. They were also asked to describe the main theme and contents of the letters. We use these elements to cross-validate the tone measure, finding a high degree of consistency and coder agreement. The coders are trained financial professionals. They were instructed to focus their coding on what the management appears to state and avoid making judgements that would rely on information not contained in the text.
The resulting manual measure of tone takes into account the complexity of corporate communication. Professional readers can combine a large number of varied cues in their assessment (Brennan et al., 2009). These include the words, grammar, style and use of external referents (Klimczak & Dynel, 2018). Researchers are working on improving automated textual analysis, so that it may offer the same quality as human coders, but much work is required before this can be achieved (El-Haj et al., 2019).
In contrast to the richness of the manual approach, automated word-list-based measures of tone take into account only the frequencies with which various words occur in the text (Henry & Leone, 2016). This limits their contribution to large-sample market-based studies, where a weak noisy signal is statistically significant. Moreover, reliability and replicability concerns force researchers to use a single set of word-lists (Loughran & McDonald, 2016) that were developed on the basis of SEC-10K forms and optimised for the US market. Given our sample and research objective, manual coding is a better choice.
Manual coding continues to be an accepted method in textual research. Fisher et al. (2016) present the statistics of research publications in accounting, auditing and finance, using textual analysis. Out of 266 sources published between 1952 and 2014, 86 used manual coding (Fisher et al., 2016). More recently, studies evaluating earnings disclosures on Twitter (Yang & Liu, 2017), earnings announcement press releases (Guillamon-Saorin et al., 2017), business model disclosures (Melloni et al., 2016) and environmental disclosures (Rodrigue et al., 2015) have also relied on manual coding to measure tone.
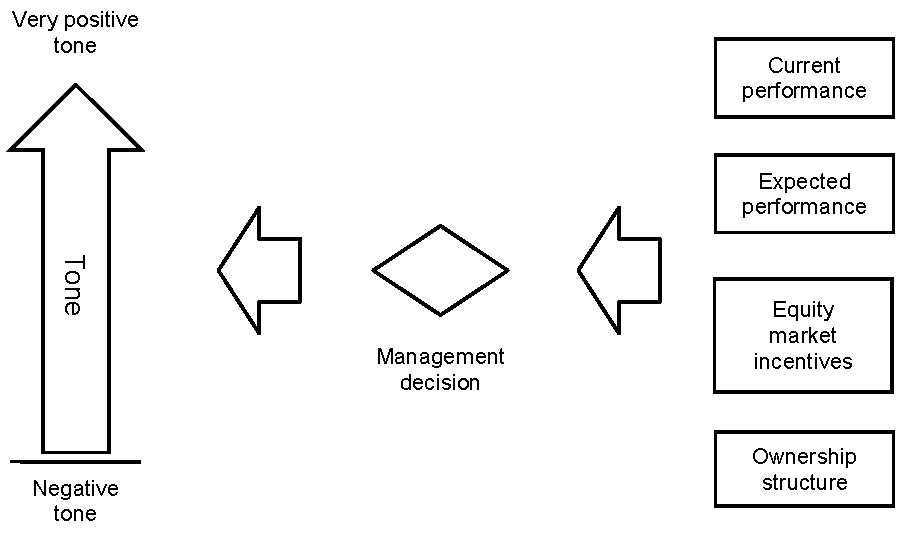
3.2. Model
We model the choice of tone as a management decision problem in the presence of external incentives (Figure 1). We apply the ordered logit regression to estimate the model, because tone is measured with an ordinal scale. The manager faces a limited number of options for the level of tone, from which he or she needs to select one. We assume, drawing from empirical observations, that each letter is characterised by a level of tone. It is possible for a manager to write a short formal letter, using few evaluation markers to avoid the expression of tone (Hadro et al., 2017). Such a letter would be classified as neutral in tone.
The ordered logit model takes the following form: \[Pr\left( TONE_{i} = j \right) = Pr\left( cut_{j - 1} < \ \beta \mathbf{\mathit{X}}_{i} + u_{i}\ < cut_{j} \right),\] where Pr indicates the probability of a given observation, TONEi stands for the tone used by the management of firm i in their letter to shareholders. The linear function \(\beta \mathbf{\mathit{X}}+u_{i}\) includes a matrix of measures for each observation that affects the level of tone according to our hypotheses, the coefficient vector \(\beta\), and the error term ui. The values cutj-1 and cutj are the estimated cut-points for the value of the linear function, ranging from cut0=0 to infinity for cut4. The probability of a given level of TONE occurring is determined by the probability with which the value of the linear function falls between the cut-points for that level of tone.
Figure 1. The research method
3.3. Data
The full dataset contains 174 annual observations for the years 2008 and 2013 of major companies listed at the Warsaw Stock Exchange (WSE) and the Vienna Stock Exchange (WB). It is constructed by combining a manual analysis of letters to shareholders with information from the IFRS financial statements published at the same time, and share ownership information. The sample is then limited by excluding banks (20 observations), because banks diverge from the rest of the data in terms of how letters are written, how financial statements are prepared, and how control over the company is executed. Further, we exclude the following from the core regressions: loss companies (where changes in earnings would need to be measured using a different scale), outliers (companies with extreme changes in earnings), and observations where one level of tone cannot be defined (e.g. letters that begin on a negative note to take a positive turn later). The final sample counts 89 observations. We report additional tests, where we expand the sample to test how the model performs on the full dataset (out of the estimation sample). The qualitative results are not affected by sample restrictions.
The data are drawn from stock markets in Poland and Austria, where ownership concentration is common enough to allow statistical testing. The two markets are comparable in terms of total market capitalisation. We select these two markets because of their proximity. In 2013, the WSE disclosed that it was conducting merger negotiations with the WB. At that time, the WSE together with the WB aspired to become leaders among the stock exchanges of Central and Eastern Europe (Bloomberg, 2013). The companies listed in these two exchanges operate in similar markets. The patterns in ownership structures are similar, with controlling shareholders holding two thirds of company shares and institutional investors holding about five percent on average. We select sample companies on the basis of index portfolios of WIG20, WIG60 and ATX at the beginning of 2008 to make sure that the sample includes the largest and most actively traded companies at the WSE and WB.
We select 60 companies from the WSE and 27 companies from the WB in order of decreasing market capitalisation. Letters to shareholders are published by Polish and Austrian companies as an introduction to their annual reports available on corporate websites. We study the letters written in Polish for companies from the WSE and in English for companies listed at the WB. We collect two letters for each company: one for the financial year 2008 and one for 2013. The data are separated by five years to allow changes to occur in the use of tone and ownership concentration. The two variables change slowly. Management tend to prefer consistency and predictability in reporting. Changes in ownership concentration require time for the transactions to take place.
We obtain financial data from the ORBIS database and the local Notoria database for Polish companies. We convert the amounts to euro for the variables measured at levels, but we make no foreign exchange rate adjustment to the variables measured in proportions. We validate the data against the original financial statements. Ownership information is based on mandatory filings for major shareholders that hold above 5% of shares. We construct this dataset manually from the filings and information we solicited from the two stock exchanges. For data validation we use the ORBIS ownership database.
3.4. Measures
Tone
Tone is an ordinal measure that denotes linguistic tone from negative (1), through neutral (2), to positive (3) and very positive (4). Tone is defined as the extent to which managers frame company results and outlook in a favourable manner (Rogers et al., 2011, p. 2161). We measure tone manually as described at the beginning of the section. In some cases, tone varies between sections of the text, making the overall tone ambiguous. We remove such observations from our data.
Current performance
Earnings growth, EG, is the main performance measure used in earlier studies (Abrahamson & Amir, 1996; Keusch et al., 2012). It is calculated as the percentage change in reported net profit from t-1 to t. This calculation excludes loss firms from the sample, because earnings growth can only be calculated for positive values.
Expected performance
Earnings growth in the following year, EGF, is the proxy for the performance expectations of the management (Abrahamson & Amir, 1996; Keusch et al., 2012). It is calculated as the percentage change in reported net profit from t to t+1.
Equity-market incentives
We create a composite measure that takes into account company size, profitability, leverage and growth opportunities (Daske et al., 2013). It is calculated using loadings obtained with principal component analysis (PCA) on the standardised values of these variables. Size is the average of standardised values of market capitalisation, total assets and revenue from sales. Profitability is equal to the standardised value of the average return on assets (ROA) between t-1 and t+1. Leverage is obtained in a similar manner using the net debt-to-assets ratio. The growth opportunities variable is obtained by standardising the market-to-book ratio (more specifically, the average of values for each month of the reporting year centred separately for each year).
The results of PCA analysis point to two principal components which explain 70% of total variance. The first composite measure, EMI1, contains positive loadings of profitability (ROA) and growth opportunities (book-to-market), while leverage (debt-to-assets) contains negative loadings. The second component, EMI2, contains positive loadings for size, leverage and growth opportunities. The two variables follow the standard normal distribution.
The equity-market incentives measure described above is based on Daske et al. (2013) reporting incentives concept. The measure was originally used to identify companies with incentives to adopt the International Financial Reporting Standards. We made a number of adjustments, however, to account for the characteristics of our data. Firstly, we use PCA instead of factor analysis, because the data does not show a factor structure. Secondly, we remove variables for internationalisation and ownership concentration. Internationalisation does not differentiate companies in our sample, since we study relatively small markets where all major companies engage in foreign sales. Ownership concentration is of particular interest in our study, so we include it as a separate measure rather than an element of the composite.
Ownership structure
We use a binary measure for concentrated ownership (H. Jiang et al., 2011). DCONTROL is a binary measure that marks companies in which the largest shareholder holds a block of at least 30% of shares. We apply the binary measure to block-holders because the distribution of their shareholdings is strongly skewed. We do not lose information by reducing the variable to binary scale.
Institutional shareholdings, denoted as INST, are measured with a continuous variable indicating the total percentage of shares held by institutional investors.
3.5. Model estimation
We use ordered logit regression to estimate efficiently the effect of the independent variables on the different levels of tone. Ordered logit regressions are appropriate where one can rank the response (tone), but no meaningful measure can be applied to the difference between the levels (e.g. the distance between positive and very positive tone). Indeed, we would argue that a reader of a letter to shareholders can indicate whether the tone is more or less positive than in another letter. We would not, however, ask the question: to what extent is the tone more or less positive?
From an estimation perspective, the ordered logit regression rests on the assumption that there exists a latent continuous variable for which one can observe only discrete, ranked values. Each level of the discrete variable, tone in our case, corresponds to a range of values of the latent variable. The cut-off points between levels of tone and the coefficients for the variables of interest can be estimated using maximum likelihood estimaLtion (Wooldridge, 2001, pp. 504-508).
The application of ordered logit estimation to our research problem carries the following consequences. Firstly, we need to apply marginal analysis at different levels of the variables of interest to determine their impact on the tone used in a letter. The estimated coefficients are not meaningful in either sign or value, because the effect of the independent variables on tone depends on the level of these variables and the level of tone that we are considering. In particular, the sign of the coefficients is only unambiguous for the extreme levels of tone. Secondly, we need to limit the number of variables included in the model, because maximum likelihood estimation is more sensitive to the number of degrees of freedom than the least squares method. Given the sample size, we cannot include in the regression any control variables that are not significant. The omission of some control variables does not affect the measurement of partial effects when a logit regression is used.
4. Descriptive statistics
The final sample used for model estimation contains 89 observations. In the following tables we present the distribution of the tone variable (Table 1) and the descriptive statistics for all the independent variables (Table 2). It appears that letters to shareholders tend to be written in a positive tone, with very positive tone being the second most frequent choice. Neutral and negative tones are rarely used. We would expect such letters to be published by companies that find themselves in an unfavourable situation, which is indeed the case. The number of neutral and negative letters would be far greater if we included loss companies in the sample. The overall approach to writing letters is similar in the two countries under study, as described in the background section. There is no statistically significant difference in the use of tone, as evidenced by the Chi-square statistic of 1.18.
The sub-samples of the two countries do not differ in terms of performance measures, which is the result of geographic and economic proximity (Table 2). Both sub-samples show a significant incidence of negative earnings growth with decreases of up to 84% and a negative median value. Poor performance is associated with the effects of the financial crisis. Mean earnings growth, however, is positive at 2%. Mean expected earnings growth is positive at 5%. The standard deviation of earnings growth is high. Since only a handful of Polish companies are as large as the Austrian ones, we note a greater dispersion in the earnings variables and the EMI1 variable that measures the attractiveness of the company in the equity market.
Differences appear in the values of equity market incentives measures. Polish companies tend to rank higher on the EMI1 variable (0.77 vs 0.23), while Austrian companies rank higher on the EMI2 variable (0.78 vs -0.24), with the differences being statistically significant. Thus, the Polish market appears more attractive to equity investors in terms of profitability and growth, while the Austrian market includes more mature companies that are larger and have accumulated more debt.
The two markets are similar in terms of ownership structures, with two-thirds of the companies controlled by a major shareholder. The average share of institutional shareholders is only 6%. These characteristics make our sample stand out from the American samples used in many studies.
The correlation matrix (Table 3) shows that the variables are not correlated, with some exceptions. Earnings growth appears to undergo a reversal in expected earnings growth, suggesting that spikes or drops in earnings are reversed in the following year. The correlation (-0.26), however, is low. We notice a slight negative correlation between the expected earnings growth and the EMI2 variable (-0.22), as well as between the EMI1 variable and institutional shareholdings (-0.25). The first may be explained by the negative effect of leverage on profitability in times of poor performance. The second may be associated with the fact that large accumulated shares of institutional shareholders are more prevalent in established companies (low EMI1), than in ones with high profitability and growth opportunities (high EMI1).
Table 1. Frequency of the tone variable in the estimation sample
| WSE | WB | Total | |
|---|---|---|---|
| 1: negative | 4 | 3 | 7 |
| 2: neutral | 5 | 4 | 9 |
| 3: positive | 34 | 14 | 48 |
| 4: v. positive | 17 | 8 | 25 |
| Total | 60 | 29 | 89 |
Note: Tone is an ordinal measure ranging from 1 to 4. Observations with fluctuating or unclear tone have been removed. The effect of the country of listing is not significant (Chi2=1.18).
Table 2. Descriptive statistics for the estimation sample
| Variable | Mean | SD | N | Min | Q1 | Median | Q3 | Max |
|---|---|---|---|---|---|---|---|---|
| Companies from the Vienna Stock Exchange in Austria | ||||||||
| EG | .06 | .40 | 29 | −.57 | −.16 | −.03 | .12 | 1.00 |
| EGF | −.10 | .44 | 29 | −.82 | −.25 | −.06 | .13 | 1.00 |
| EMI1 | .23 | .93 | 29 | −1.38 | −.41 | .19 | .83 | 1.97 |
| EMI2 | .78 | .77 | 29 | −1.05 | .41 | .83 | 1.27 | 2.04 |
| DCONTROL | .66 | .48 | 29 | .00 | .00 | 1.00 | 1.00 | 1.00 |
| INST | .05 | .07 | 29 | .00 | .00 | .00 | .11 | .20 |
| Companies from the Warsaw Stock Exchange in Poland | ||||||||
| EG | −.01 | .51 | 60 | −.83 | −.38 | −.08 | .28 | 1.00 |
| EGF | .12 | .45 | 60 | −.84 | −.20 | .16 | .41 | 1.00 |
| EMI1 | .77 | 1.17 | 60 | −1.51 | .07 | .51 | 1.33 | 3.77 |
| EMI2 | −.24 | .77 | 60 | −1.46 | −.95 | −.34 | .32 | 1.51 |
| DCONTROL | .68 | .47 | 60 | .00 | .00 | 1.00 | 1.00 | 1.00 |
| INST | .06 | .08 | 60 | .00 | .00 | .03 | .10 | .36 |
| Total estimation sample | ||||||||
| EG | .02 | .48 | 89 | −.83 | −.30 | −.05 | .24 | 1.00 |
| EGF | .05 | .46 | 89 | −.84 | −.20 | .04 | .31 | 1.00 |
| EMI1 | .60 | 1.13 | 89 | −1.51 | −.10 | .46 | 1.18 | 3.77 |
| EMI2 | .09 | .90 | 89 | −1.46 | −.54 | −.04 | .83 | 2.04 |
| DCONTROL | .67 | .47 | 89 | .00 | .00 | 1.00 | 1.00 | 1.00 |
| INST | .06 | .08 | 89 | .00 | .00 | .00 | .11 | .36 |
Note: EG denotes earnings growth over the reporting year, EGF denotes earnings growth over the year following the report (both variables are truncated at the value of 1), EMI1 and EMI2 are measures of incentives related to the equity market, DCONTROL is a binary variable that takes the value of 1 if the largest block of shares exceeds 30%, INST denotes the total of shares held by institutional investors.
Table 3. Correlation matrix
| EG | EGF | EMI1 | EMI2 | DCONTROL | INST | |
|---|---|---|---|---|---|---|
| EG | 1 | |||||
| EGF | −.2606* | 1 | ||||
| EMI1 | .0035 | −.0986 | 1 | |||
| EMI2 | −.0989 | −.2174* | −.0712 | 1 | ||
| DCONTROL | −.0399 | -.0829 | .2017 | −.1385 | 1 | |
| INST | .1080 | .0465 | −.2453* | −.0862 | −.1717 | 1 |
Note: Star denotes significance at p<0.05.
5. Results
5.1. Estimation results
We present results for the ordered logit regression by progressively including the variables related to incentives (Table 4). The base model (MB) includes only the historical and expected earnings growth variables relevant for testing H1. Estimation results show that both variables have a positive effect on tone and the model is statistically significant (Chi-square=8.09). When we include the equity market incentive variables from H2 in Model M1, the significance of the entire model improves in terms of the Chi-square, AIC and log-likelihood statistics. The effect is due only to EMI1, however, which is positively associated with tone. We do not include EMI2 in the following models, because it has no significant effect on tone.
Next, we test H3 by including shareholder concentration and find that companies controlled by a major shareholder tend to prepare more positive letters. The variable (DCONTROL) is statistically significant in Model M2 and its inclusion improves the statistical significance of the performance variables. We observe no such effect for institutional shareholdings when we include it as a standalone variable (Model M3). It is only when we juxtapose the two ownership variables in Model M4 that we find a negative effect of institutional shareholdings on tone: the effect is significant only if a controlling shareholder is present. Thus, we find support for H4.
Ultimately, we can obtain the strongest results when we include all the statistically significant variables in Model M5 and test the four hypotheses jointly. M5 outperforms the previous models in terms of Chi-square, AIC and log-likelihood. The coefficients on historical and expected performance both statistically significant and positive (H1). Equity market attractiveness (EMI1) affects tone positively (H2), as does the presence of a controlling shareholder (H3). Institutional shareholders appear to mitigate the positive bias in tone that occurs when a controlling shareholder is present (H4). We explore the significance and implications of these results in marginal analysis.
Table 4. Ordered logit regression results
| MB | M1 | M2 | M3 | M4 | M5 | |
|---|---|---|---|---|---|---|
| EG | 1.3218** (.4818) | 1.4507** (.4697) | 1.4693** (.4954) | 1.4787** (.5066) | 1.4788** (.5039) | 1.7816*** (.5001) |
| EGF | .9145†(.4832) | 1.0754*(.5220) | 1.0475** (.4413) | 1.0019*(.4947) | .9571†(.5131) | 1.1204*(.4823) |
| EMI1 | .5224**(.1905) | .3795†(.2008) | ||||
| EMI2 | −.0691(.2518) | |||||
| DCONTROL | .8713†(.5006) | 1.3734*(.6372) | ||||
| INST | −4.7033 (3.6267) | |||||
| INST|DCONTROL=0 | −3.1769 (5.9108) | 3.3531(4.9279) | ||||
| INST|DCONTROL=1 | −5.5681† (3.3378) | −8.0004* (3.9658) | ||||
| Cut 1 | −2.5443(.3905) | −2.3477(.4170) | −2.0357(.4859) | −2.8669(.4597) | −2.8776(.4624) | −1.9000(.4823) |
| Cut 2 | −1.5609(.2845) | −1.3333(.3024) | −1.0013(.4387) | −1.8621(.3684) | −1.8773(.3654) | −.8211(.4419) |
| Cut 3 | 1.1042(.2608) | 1.4852(.3172) | 1.7505(.4923) | .8598(.3028) | .8568(.3001) | 2.2056(.5425) |
| N | 89 | 89 | 89 | 89 | 89 | 89 |
| chi2 | 8.0853 | 14.7429 | 11.3889 | 8.8963 | 9.4538 | 19.1611 |
| p(chi2) | .0176 | .0053 | .0098 | .0307 | .0507 | .0039 |
| df(chi2) | 2 | 4 | 3 | 3 | 4 | 6 |
| AIC | 199.9789 | 196.2172 | 198.3237 | 199.2319 | 200.9646 | 193.5508 |
| Log-likelihood | −94.9895 | −91.1086 | −93.1618 | −93.6160 | −93.4823 | −87.7754 |
Note: Standard errors in parentheses. Tone is the dependent variable specified as in Table 1. EG denotes earnings growth over the reporting year, EGF denotes earnings growth over the year following the report (both variables are truncated at the value of 1), EMI1 and EMI2 are measures of incentives related to the equity market, DCONTROL is a binary variable that takes the value of 1 if the largest block of shares exceeds 30%, INST denotes the total of shares held by institutional investors, INST|DCONTROL=0/1 denotes the conditional coefficient on institutional shareholding for the two values of DCONTROL. Statistical significance: † p<0.10, * p<0.05, ** p<0.01, *** p<0.001.
5.2. Marginal analysis
Marginal analysis allows us to determine how changes in the values of the independent variables affect the probability of a company using each of the four levels of the dependent tone variable as predicted by model M5. In other words, marginal analysis shows the economic significance of our findings. The analysis also allows us to examine interactions between variables, such as equity-market incentives and ownership concentration. Since logit regressions involve a non-linear relationship between the variables and the probability of using a given level of tone, marginal effects vary depending on the combination of variable values at which they are estimated. In essence, by performing marginal analysis we seek to answer the following question: how would the predicted probability of a company using a given level of tone change if we modified one of the variables?
In order to answer this question we need to estimate marginal effects at each level of the tone variable for different values of the selected independent variables and compare them to unconditional values. The unconditional predicted probabilities of using the four levels of tone in our sample are 8% for negative tone, 10% for neutral tone, 54% for positive tone, and 28% for very positive tone. We focus marginal analysis on the conditional probabilities for negative, neutral and very positive tone, rather than positive tone. This is because positive tone is the one most frequently used, making it unlikely for any changes in independent variable values to affect significantly the predicted probability of using positive tone.
5.3. Unconditional effect of earnings growth expectations
The effect of earnings growth expectations (EGF) is of prime interest to our study, because it provides evidence of how management incorporate private information in the tone they use (H1). Panel A in Table 5 shows the predicted probabilities at two levels of EGF, roughly two standard deviations apart, while keeping all other variables at their actual sample values. We observe a large effect on the predicted probabilities of using very positive tone, which are about 18 percentage points apart (three standard errors) for the two values of EGF. The differences are smaller for negative and neutral tone, but they are significant. There is no difference in the probability of using positive tone, which as mentioned above is the most common.
Marginal effects show that a 100% change in EGF would cause the largest change in the probability of a company using very positive tone (16-19 percentage points), given the actual values of all other variables in the sample. The results for neutral and negative tones are smaller in magnitude, and the statistical significance of marginal effects is weaker. This is to be expected, because the unconditional probabilities for these levels of tone are low. Nevertheless, the results indicate that high earnings growth expectations may reduce the probability of using negative or neutral tone to zero. In sum, strong earnings growth expectations positively affect the probability of using very positive tone, while reducing the probability of using neutral or negative tones. Managers are, on average, sincere in communicating positive expectations. This effect is moderated by other variables that are analysed below.
5.4. Effect of past performance
In a business setting, performance tends to be perceived relative to historical earnings growth. H1 states that expected performance has an incremental effect compared to past performance. Thus, in Panel B of Table 5 we examine the joint effects of historical and expected performance variables. Should all companies in our sample report a 50% drop in recorded earnings (EG), the probabilities of using the four levels of tone would be 15%, 16%, 54% and 14% respectively. The differences between probabilities predicted at low and high values of EG are statistically significant and larger than those for EGF (except for the most common, positive tone).
Should a company expect a rebound in its earnings (EGF) after poor performance (a 50% drop in EG), the predicted probabilities would change by -13, -8, and 12 percentage points. Effectively, such a large expected change in earnings would reduce the probability of using negative tone to zero, while increasing the probability of using very positive tone to 26%, close to the unconditional probability. In contrast, if a company reported strong performance (a 50% increase in EG), the effect of expected earnings growth would be small for negative and neutral tone (-3% and -5%), because management would be unlikely to use low levels of tone when historical earnings growth is high, regardless of expectations. Expectations of strong earnings growth would motivate management to use very positive tone. The probability of using very positive tone would increase by 23%, while the probability of using positive tone would drop by 15%.
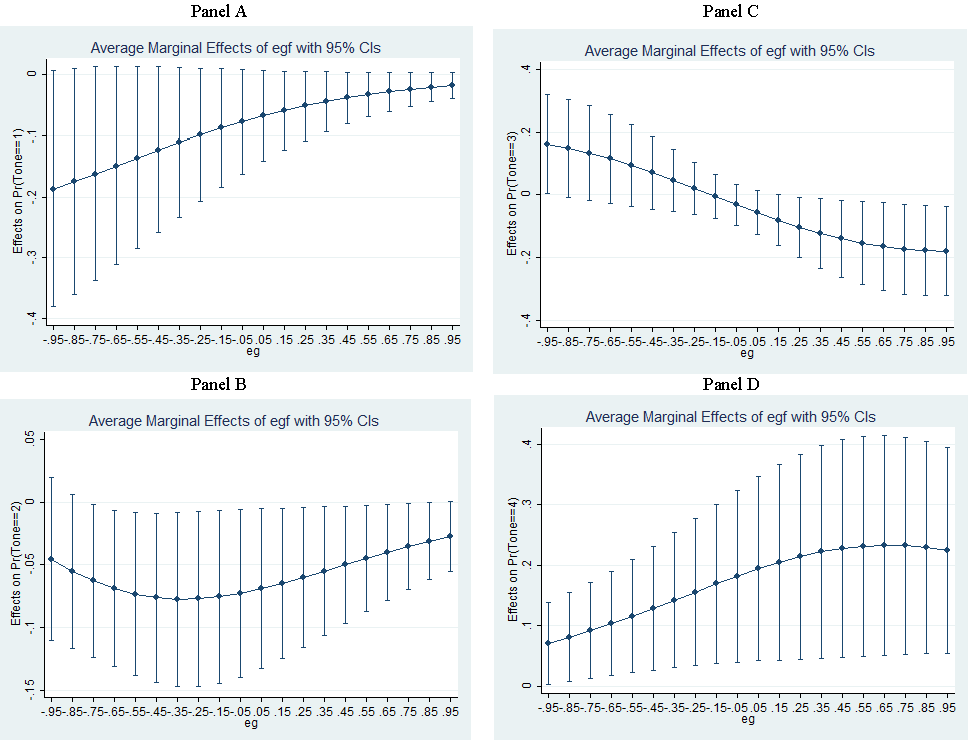
In sum, the effect of changes in management expectations on tone is incremental to the effect of historical earnings growth (Figure 2). When historical performance is poor, companies are more likely to use negative or neutral tones. If expectations are strong, management is likely to use positive tone instead. When historical performance is high, companies are likely to use positive tone. High expectations about future performance increase the probability of using very positive tone instead of positive tone.
Figure 2. Average marginal effects of EGF conditional on tone and the value of EG.
5.5. Effect of equity market incentives
Equity market incentives (EMI1) are associated with the general profitability and market valuation of a company (i.e. how attractive a company is to investors). H2 states that these incentives have a positive effect on the level of tone According to panel C in Table 5, the effect of EMI1 is less strong than that of EG. Should all sample companies fall one standard deviation above the mean for EMI1, very positive tone would be used nearly twice as often (30%) as in the reversed situation (when all companies would fall one standard deviation below the mean of EMI1). Note, however, that the unconditional probability of using very positive tone is 28%. It appears that it is low values of EMI1 that cause predicted probabilities to diverge from the sample frequencies, rather than high values of EMI1.
Consequently, an important finding seems to be that companies unattractive to investors are more likely to use low levels of tone than other companies. In the case of low EMI1 companies, it would take large expected growth in earnings to change the expected probabilities of using the four levels of tone back to sample frequency. The differences in the marginal effects of EGF for the two values of EMI1 are not significant, but appear to be somewhat larger for very positive tone and negative tone than other levels.
Table 5. Conditional probabilities and average marginal effects of earnings growth expectations
| A: Unconditional | Estimated probabilities | Estimated marginal effect of EGF | ||
|---|---|---|---|---|
| at EGF=−50% | at EGF=50% | at EGF=−50% | at EGF=50% | |
| Negative | .13* (.05) | .05*(.02) | −.09(.06) | −.07†(.03) |
| Neutral | .15**(.04) | .08**(.03) | −.07*(.04) | −.07*(.03) |
| Positive | .54***(.06) | .51***(.05) | .00(.04) | −.06(.4) |
| Very positive | .19***(.05) | .37***(.06) | .16**(.08) | .19*(.08) |
| B: Conditional on EG | Estimated probabilities | Estimated marginal effect of EGF | ||
| at EG=−50% | at EG=50% | at EG=−50% | at EG=50% | |
| Negative | .15**(.05) | .03*(.01) | −.13†(.07) | −.03†(.02) |
| Neutral | .16**(.05) | .05**(.02) | −.08*(.03) | −.05*(.02) |
| Positive | .54***(.06) | .47***(.06) | .08(.06) | −.15*(.07) |
| Very positive | .14**(.04) | .43***(.06) | .12*(.05) | .23*(.09) |
| C: Conditional on EMI1 | Estimated probabilities | Estimated marginal effect of EGF | ||
| at EMI1=−1 | at EMI1=1 | at EMI1=−1 | at EMI1=1 | |
| Negative | .12*(.05) | .06**(.02) | −.11†(.07) | −.06†(.04) |
| Neutral | .14**(.04) | .09**(.03) | −.08*(.03) | −.07*(.03) |
| Positive | .56***(.05) | .55***(.05) | .04(.06) | −.07(.04) |
| Very positive | .18***(.06) | .30***(.05) | .15**(.06) | .20**(.08) |
| D: Conditional on DCONTROL | Estimated probabilities | Estimated marginal effect of EGF | ||
| at DCONTROL=0 | at DCONTROL=1 | at DCONTROL=0 | at DCONTROL=1 | |
| Negative | .11*(.05) | .07**(.03) | −.10†(.06) | −.07†(.04) |
| Neutral | .14**(.05) | .09**(.03) | −.08*(.04) | −.07*(.03) |
| Positive | .56***(.06) | .53***(.05) | .04(.06) | −.06(.04) |
| Very positive | .20**(.07) | .31***(.05) | .15*(.07) | .19*(.08) |
Note: Marginal effects are estimated on actual values of the variables in the sample, but the indicated variable is set at the given level. Standard errors in parentheses. Statistical significance: † p<0.10, * p<0.05, ** p<0.01, *** p<0.001.
5.6. Effect of ownership structure
The presence of a large controlling shareholder (DCONTROL=1) motivates managers to use more positive tone regardless of company performance, which supports H3 (Panel D in Table 5). In particular, closely controlled companies tend to use very positive tone, with the predicted probability of 31%, as opposed to only 20% for other companies. The effect appears similar in magnitude to that of equity market incentives. Consequently, the probability of using negative or neutral tones is smaller for closely controlled companies.
The marginal effects of earnings expectations conditional upon DCONTROL appear to be similar to the unconditional values presented in Panel A. Strong earnings growth expectations further increase the likelihood of using very positive tone by closely controlled companies. It would take an expected drop in earnings of more than 50% for the predicted probability of using very positive tone to fall significantly below the sample frequency.
The effect of institutional shareholders is conditional upon the presence of a large shareholder, which supports H4 (Table 6). Panel A shows how the predicted probabilities change depending on the level of institutional shareholding. We find the strongest results for very positive tone, which would be used in 38% of letters if no institutional shareholder was present in either of the closely controlled companies, 24% if institutions held a tenth of the shares in each of these companies, and 14% if they held a fifth of the shares. It appears from these results that institutional investors counterbalance the tendency of management to increase the level of tone, and that this effect can be strong.
At the same time, large institutional shareholdings are associated with a relatively high probability of using neutral or even negative tones. If 20% of shares were held by institutions in all sample companies, as many as 17% of the closely controlled companies would use neutral tone, and a further 15% would use negative tone. These are large deviations from the unconditional probabilities of 10% and 8% respectively. It appears that sample frequencies for low levels of tone are exceeded if institutions hold a tenth of the shares.
Panel B in Table 6 shows that a high level of institutional shareholding reduces the marginal effect of earnings growth expectations on the probability of using very positive tone. Normally, high expectations would quickly push a closely controlled company towards using very positive tone, rather than positive tone. Significant institutional shareholding muffles this effect.
In contrast, institutional shareholdings strengthen the marginal effect of earnings growth expectations on the probability of using neutral or negative tones. The effect is stronger for negative tone than for neutral tone, and it increases in magnitude with the size of institutional shareholdings. If institutions held 20% of shares in all closely controlled companies, the marginal effect for negative tone would be twice as large as the average effect, and four times larger than the effect if no institutions were present.
Finally, we find a negative marginal effect for positive tone when institutional shareholdings are low or not present. This result further strengthens the argument that closely controlled companies are prone to using very positive tone, rather than positive tone when earnings expectations are positive. As institutional shareholdings increase, the marginal effect for positive tone becomes zero, and then increases up to a positive value of 17 percentage points for very large shareholdings. This suggests that companies monitored by institutions make a choice between neutral and positive tone when growth expectations are strong, rather than using very positive tone. If we compare the numbers in the last column of Panel A with the numbers in the last column of Panel B, it is clear that very positive tone is rarely used by companies with high institutional shareholdings.
Table 6. Conditional probabilities and average marginal effects of shareholder structure
| A | Estimated probabilities for DCONTROL=1 | ||||
|---|---|---|---|---|---|
| at INST=0% | at INST=5% | at INST=10% | at INST=20% | at INST=30% | |
| Negative | .04†(.02) | .05*(.02) | .08**(.03) | .15*(.07) | .27†(.15) |
| Neutral | .06**(.02) | .08**(.03) | .11**(.04) | .17*(.07) | .21**(.08) |
| Positive | .52***(.06) | .55***(.05) | .57***(.06) | .54***(.07) | .44**(.14) |
| Very positive | .38***(.07) | .31***(.05) | .24***(.05) | .14*(.07) | .07(.06) |
| B | Average marginal effects of EGF for DCONTROL=1 | ||||
| at INST=0% | at INST=5% | at INST=10% | at INST=20% | at INST=30% | |
| Negative | −.03(.03) | −.06(.04) | −.08†(.04) | −.13†(.07) | −.2*(.1) |
| Neutral | −.05†(.03) | −.07*(.03) | −.08*(.04) | −.08*(.04) | −.04(.07) |
| Positive | −.13†(.06) | −.08†(.04) | −.02(.05) | .10(.08) | .17*(.08) |
| Very positive | .22*(.09) | .20*(.08) | .17*(.07) | .11†(.07) | .07(.06) |
Note: Marginal effects are estimated on actual values of the variables in the sample, but the INST variable is set at the given level. Standard errors in parentheses. Statistical significance: † p<0.10, * p<0.05, ** p<0.01, *** p<0.001.
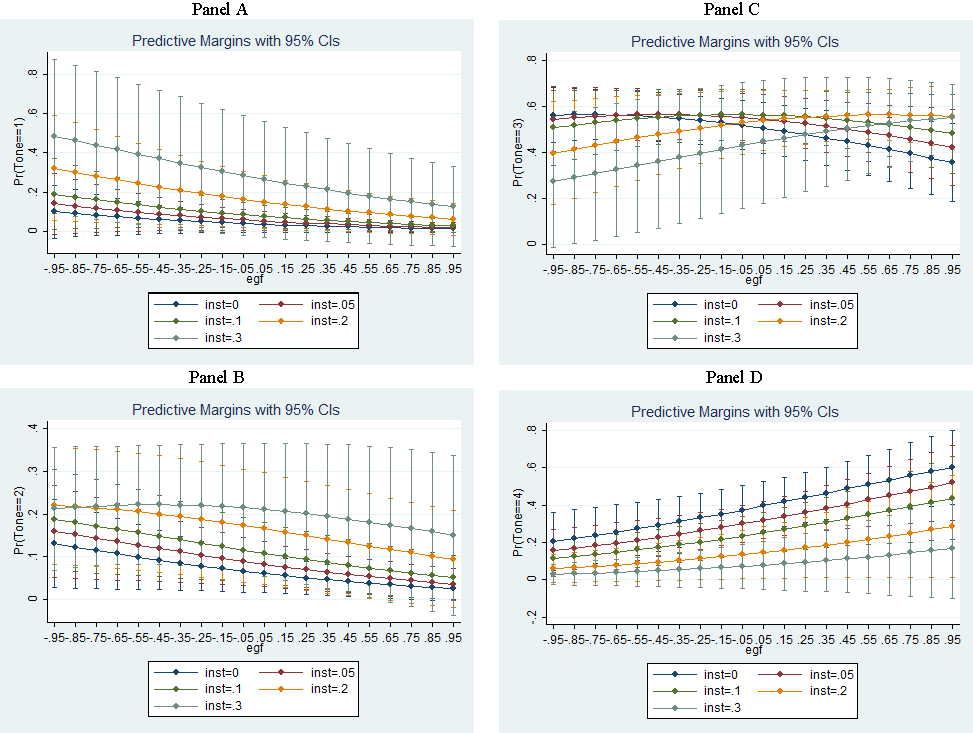
The effect of institutional shareholdings can be further explored by examining probabilities of using the four levels of tone at different levels of institutional shareholding and growth expectations predicted by the model (Figure 3). When earnings expectations are high, all companies are more likely to use very positive tone (Panel 4). Still, the slope is much steeper when institutional shareholders are assumed to be absent, or their level of shareholding is assumed to be low. Should a closely controlled company with no institutional shareholders expect a 50% increase in earnings, the predicted probability of using very positive tone would be 50%, about twice the sample frequency of 28%. In contrast, should institutional shareholdings reach 10%, we would predict a probability of using very positive tone equal to 34%, much closer to the sample frequency.
Figure 3 shows how the results diverge depending on the level of institutional ownership. The predicted probability of using positive tone decreases with EGF when institutions are absent or hold few shares. When institutions are present, the probability increases with EGF. This is a reflection of the choices made by the two groups of companies. When institutions are present, companies make a choice between neutral and positive tones, depending on expectations. Strong expectations increase the likelihood of using positive tone instead of neutral. Closely held companies that lack institutional investors make a choice between positive and very positive tones in the same situation.
The analysis of marginal effects for negative expectations complements this picture. The presence of institutional investors entices managers of closely held companies to use neutral tone in the letters to shareholders. In the case of an expected drop in earnings of 50%, we would predict the probability of using neutral tone to be between 10%, if no institutional shareholders were present, and 22% if they held a third of the shares. The spread in the probability of using negative tone is even larger: from 7% to 38%.
Figure 3. Estimated probabilities of using the four levels of tone as for DCONTROL=1 conditional on the combined shareholding of institutional shareholders and expected earnings growth (EGF)
5.7. Additional tests
In order to confirm our results, we lift sample restrictions and we repeat marginal analysis. We include loss companies, which we excluded from the estimation sample because earnings growth would need to be measured on a different scale when losses occur. In another test, we estimate the model (M5) again using a logarithmic scale for the earnings growth variable and sales growth as alternative measures.
Loss companies can be used to test if the estimated marginal effects identify correctly the choice of tone in cases of poor performance. Poor performance, both historical and expected, should lead managers to use reduced levels of tone. Indeed, when we compare the frequencies of tone used in the samples and by loss companies, we find that out of 48 companies that reported losses only 5 (compared to 25 in the estimation sample) use very positive tone, 22 (48) use positive tone, 16 (9) use neutral tone, and 5 (7) use negative tone.
In order to verify how the predictions from Model M5 would compare to reality, we need to modify the data for loss companies since we cannot calculate earnings growth for negative numbers. We circumvent this problem by setting earnings growth to unity for companies that move out of a loss situation, zero if losses continue, and negative if a company moves from profits to loss. With these modifications, Model M5 predicts that negative tone would be used by 33% of loss companies. This level is significantly higher than the prediction for sample companies (8%) and the actual frequency for loss companies (11%).
The predicted probabilities for all tone levels are significantly different in the out-of-the-sample group (Table 7). The model predicts that more companies would use neutral tone (17% vs 10% in the sample), but the actual frequency is lower, suggesting that the model overestimates the frequency of using negative tone at the expense of neutral tone. Fewer companies would use positive tone (34% vs 54%), although the actual frequency is higher (46%). Very positive tone would be used by 16% of companies, a smaller frequency than in the sample, but somewhat higher than the actual. These results may be driven by the data modification we employ. When we set the values of EG and EGF for loss companies at the sample means, we find the predicted probability for negative tone that is equal to the actual frequency, but high levels of tone are predicted to occur more often than the actual frequencies.
Beyond verifying the accuracy of our predictions, we obtain additional information concerning the role of independent variables. When we incorporate more companies in marginal analysis, the average marginal effects change to adjust for the changed distribution of variable values, such as lower values of EMI1 for loss companies. We estimate average marginal effects for the EGF variable, setting the values of EG and EGF at their sample means and keeping all other variables at their actual values. The results show no significant differences in the sensitivity of predictions to changes in EGF values. The findings reported earlier are, therefore, robust to the expansion of the sample.
Finally, we estimate the model again with alternative scales and measures of performance (Table 8). Although none of the alternatives performs better than the earnings growth model M5, all the models support our main findings: positive effect of both historical and expected growth, positive effect of equity-market-related incentives, and positive effect of concentrated ownership, which can be mitigated by institutional shareholdings.
In the first alternative model, we change the scale for the earnings growth variables to logarithmic. In the next model, we standardise the earnings growth variables and centre them on each of the two years. These modifications cause only minor changes in coefficient estimates. The following three models that employ sales growth as a performance measure, instead of earnings growth, allow us to confirm that alternative measures of performance also affect tone. Nevertheless, the results are weaker and less stable than for earnings growth, suggesting that the latter may be of higher relevance to management when making decisions about tone. We do not observe any significant changes in the coefficients on other independent variables.
Table 7. Estimated probability of the tone variable out-of-the-sample (N=48), and in-the-sample N(89) using model M5
| Actual frequencies | Estimated probabilities | At EG=0.02 and EGF=0.05 | |||
|---|---|---|---|---|---|
| In sample | Out of the sample | In sample | Out of the sample | Out of the sample | |
| Negative | .08 | .11 | .08*** (.03) | .33*** (.12) | .11 (0.05) |
| Neutral | .10 | .33 | .10*** (.03) | .17*** (.06) | .14*** (0.04) |
| Positive | .54 | .46 | .54*** (.05) | .34*** (.08) | .59*** (.06) |
| Very positive | .28 | .10 | .28*** (.04) | .16*** (.03) | .16* (.05) |
Note: Standard errors in parentheses. Statistical significance indicates if predictions are different from the actual out-of-the-sample frequency: † p<0.10, * p<0.05, ** p<0.01, *** p<0.001.
Table 8. Ordered logit regression results for alternative measures of performance
| M5 | Ln(EG) | SLn(EG) | SG | Ln(SG) | SLn(SG) | |
|---|---|---|---|---|---|---|
| Historical growth | 1.7816*** | 1.2329* | 1.5045* | 2.6724* | 1.8566 | .5082 |
| Expected growth | 1.1204* | .8691* | .7384* | .3561† | 2.6905† | .5508* |
| EMI1 | .3795† | .3346† | .3112 | .2749 | .2912 | .3123 |
| DCONTROL | 1.3734* | 1.3705* | 1.3681* | 1.1452† | 1.0830† | 1.2221† |
| INST|DCONTROL=0 | 3.3531 | 3.2617 | 3.4898 | 5.7864 | 5.3245 | 5.4838 |
| INST|DCONTROL=1 | −8.0004* | −7.8929* | −7.5595* | −6.7017† | −7.0045* | −8.8495* |
| N | 89 | 89 | 89 | 89 | 89 | 89 |
| chi2 | 19.16 | 17.53 | 18.88 | 17.61 | 21.18 | 21.10 |
| p(chi2) | 0.004 | 0.075 | 0.004 | 0.007 | 0.002 | 0.002 |
| df(chi2) | 6 | 6 | 6 | 6 | 6 | 6 |
| AIC | 193.55 | 196.2 | 196.61 | 199.79 | 200.5 | 196.76 |
| Log-likelihood | −87.78 | −89.1 | −89.31 | −90.89 | −91.25 | −89.38 |
Note: Tone is the dependent variable specified as in Table 1. Performance measures are: earnings growth M5, log of earnings growth Ln(EG), log of earnings growth standardised by year SLn(EG), sales growth SG, log of sales growth Ln(SG), log of sales growth standardised by year SLn(SG). EMI1 is a measure of incentives related to the equity market, DCONTROL is a binary variable that takes the value of 1 if the largest block of shares exceeds 30%, INST denotes the total of shares held by institutional investors, INST|DCONTROL=0/1 denotes the conditional coefficient on institutional shareholding for the two values of DCONTROL. Statistical significance: † p<0.10, * p<0.05, ** p<0.01, *** p<0.001.
6. Discussion
Taken together, the results of the marginal analysis confirm that managers incorporate both public and private information about performance when deciding what tone to use in the letter to shareholders (H1). The effect, however, is conditional upon the mix of firm characteristics included in H2-H4. These characteristics are public knowledge, implying that a rational investor takes this information into account when interpreting the letter to shareholders. Thus, investors’ expectations about the prospects of a company are conditional upon the tone of the letter and other characteristics studied here. The examples below clarify how investors may interpret the letters, and how the use of tone affects the ability of management to shape these expectations.
6.1. Examples
First, let us imagine that an investor is reading a letter prepared by a highly attractive (EMI1=1), closely controlled (DCONTROL=1) company with no institutional shareholders, which has delivered earnings growth (EG=10%, a positive value given the sample mean of 2%). Aware of the company’s characteristics, the investor would expect the company to use positive or very positive tone. What can the investor infer about expected earnings growth (EGF) from the actual tone used by management in the letter to shareholders?
If the tone is positive, the investor would remind themselves that a company with such characteristics is prone to using very positive tone. Hence, positive tone may be an indication of moderate or low expectations. The predicted probability of using positive tone is as high as 60% if earnings are expected to fall by half. It is lower by 20% if earnings are expected to grow by half, and lower by 30% if earnings are expected to double (with standard errors of about 10 percentage points).
If the tone is neutral, the investor would be quite certain that earnings expectations are low, as the predicted probability of such a company using neutral tone when expectations are positive is only about 3%. Negative tone would be an even stronger signal, but it is unlikely to occur in this case. In sum, companies that are highly attractive, closely controlled, and not monitored by institutional shareholders can signal negative earnings expectations credibly through tone, but they have little means of using tone to communicate positive earnings expectations.
Second, let us imagine that the same investor is reading a letter prepared by a company of average attractiveness (EMI1=0), closely controlled (DCONTROL=1), with institutional shareholdings (INST=20%) and positive earnings growth (EG=10%). Such a company is less prone to using very positive tone than the one in the first example. Consequently, the likelihood of using positive tone is higher in the case of positive earnings expectations: 64% if earnings are expected to grow by half or more. Such a company would be extremely unlikely to use very positive tone when earnings growth expectations are low. Even if earnings were expected to double, the predicted probability of using very positive tone is 24%. In contrast, the likelihood of using neutral tone is significant for any level of expectations and varies between 8%, when earnings are expected to double, to 26% if earnings are expected to fall by half.
Thus, if the investor notices that the tone is positive or very positive they may infer that management has positive earnings growth expectations. Neutral or negative tones would suggest an expected drop in earnings, as the predicted probability of using these levels of tone is 23% and 22% respectively (about two to three times the sample average) when earnings are expected to fall. In sum, when companies are not particularly attractive overall, and are monitored by significant institutional shareholding, they can use tone to signal both positive and negative earnings expectations.
Finally, there is more room for signalling positive earnings expectations in cases when past performance is low. Let us imagine that the investor is reading the letter of a company that is not attractive (EMI1=-1), controlled by a major shareholder (DCONTROL=1) and monitored by institutional shareholders (INST=.2), but has suffered a drop in earnings (EG=-50%), though it has not suffered losses. Can the investor expect earnings to rebound in the future on the basis of the letter to shareholders?
If the letter is written in a negative tone, such an expectation is unlikely to materialise, since the predicted probability of using negative tone is 18% if earnings are expected to double, significant at 10% confidence level only. Neutral tone is not an indication either, as the probability is about 20-25% for any level of expectations. Positive tone, however, would suggest a possible rebound. The predicted probability of using positive tone is 54% if earnings are expected to increase, as compared to 20% for a further reduction in earnings. Very positive tone is unlikely to be used by a company that is performing poorly, as the predicted probabilities are below 10% and non-significant (compared to the sample frequency of 21%). Should the letter indeed be written in very positive tone, the investor needs to ask themselves if this is a signal of positive expectations or an opportunistic attempt to sway investors’ sentiment. If the company had few or no institutional shareholders, a very positive tone would be a more credible signal, as the predicted probability of using very positive tone would increase to 20%.
6.2. Implications
This study complements earlier literature, which finds that tone is correlated with current and future performance, by providing evidence from a low-enforcement environment with concentrated ownership. Patelli and Pedrini (2014) find a positive relationship between tone and future performance, while controlling for other factors that drive performance. Li (2010b) shows that human-based assessment of tone is positively associated with future performance even after controlling for word-list measures of tone. In the field of environmental disclosure, Arena et al. (2015) argue that textual disclosure can be used to communicate the commitment of companies to improving their environmental performance. Importantly, they show that tone is a substitute for costly commitment devices, such as board monitoring and stakeholder orientation. In a low-enforcement environment, costly commitment devices are less effective and used rarely, increasing the role of tone. We show that these earlier findings can be replicated in our setting.
We attempt to integrate the literature devoted to communicative action with the study of bias in the use of tone. The results show that managers improve the tone of the letter, relative to what the performance of their company would warrant, when the company is highly placed in the stock market or closely held by a controlling investor. This behaviour can be interpreted as bias, since there is no evidence that either characteristic influences performance (Demsetz & Villalonga, 2001). In a series of examples, we argue that investors would disregard biased disclosures. In fact, Baginski et al. (2018) show that any bias in tone can only sway inexperienced individual investors, and not the market as a whole. Biased use of tone is an outcome of identified incentives, but it is not effective in manipulating the market.
Bias may be ineffective and limits the ability of managers to include positive information in the letter to shareholders for two reasons. First, bias occurs when managers use more positive tone than would be expected given the financial performance of their company. If financial performance is indeed positive, the manager has little room to improve the tone of the letter further. Second, bias is ineffective in general as investors discount the information received. In particular, the strategic accounting literature argues that repeated disclosures are verified ex post, allowing investors to disregard positive information provided by companies with a record of bias (Stocken, 2000). Managers that bias their use of tone may see that their letters to shareholders are disregarded.
The consequences of the inability to communicate positive information can be significant. Positive information is less credible in general, as shown by studies of market reaction management reports (Feldman et al., 2010) and earnings announcements (Baginski et al., 2018). Thus, communicating positive information requires more effort. Positive information can be verified with information from other sources, so that investors evaluate it as credible (Baginski et al., 2016). Arguably, managers are at least as interested in communicating positive information, as they are in communicating negative. Our findings imply that they can increase their effectiveness in communicating positive news by refraining from bias in the use of tone.
Finally, our findings suggest that managers make a conscious choice when deciding what type of tone to use in the letter to shareholders. The issue of whether textual characteristics are the outcome of a rational decision-making process has been evaluated as a limitation in a number of studies (Arena et al., 2015; Patelli & Pedrini, 2014) and discussions (Loughran, 2018). While it is possible that tone includes a degree of noise, the presence of correlation with rational incentives suggests that managers make a conscious choice in the level of tone.
6.3. Limitations and future research
The accounting choice framework, which serves as the backbone of our study, limits the scope of our investigation to factors related with rational behaviour. Some studies look to psychological or social factors in order to explain managerial bias. Brennan and Conroy (2013) find evidence of hubris and narcissism in letters to shareholders. Davis et al. (2015) measure the manager-specific component of tone in transcripts of conference calls. Buchholz et al. (2018) apply quantitative methods to measure the effect of CEO narcissism on the tone of 10-K filings in the US. These studies, while outside the scope of the present research, complement the description of management communication.
Another limitation of our study arises from the use of ordinal scale for the measurement of tone. Our choice is guided by the need to study a language other than English, and by the conviction that holistic measures allow for a clearer discrimination between levels of tone (Li, 2010b). An alternative stream of literature relies on proportions of positive and negative statements to measure tone (Henry & Leone, 2016). This allows researchers to measure abnormal tone which represents the degree to which the level of tone is not explained by identified rational factors (Davis et al., 2015). Such models can be applied to the analysis of irrational determinants of the use of tone mentioned earlier, or to the measurement of the degree to which tone is not explained by information known at the time of disclosure. Applications include the study of investor reactions to tone (Baginski et al., 2018) and the signalling of private information (Baginski et al., 2016).
Future research should strive to develop a deeper understanding of the choices made by managers when preparing textual communications and the consequences of these choices. First, the debate on the conceptualisation and measurement of textual characteristics is at a nascent stage. When researchers apply repeatedly the standard word-lists, the question of the nature of tone in the context of accounting texts is not being asked (Rutherford, 2016). Li (2010) proposes the use of machine-learning instead of word-lists, but other researchers reject any alternatives (Henry & Leone, 2016). Nevertheless, it is difficult to disregard the progress that is being made in the areas of linguistics and textual analysis, which leads to a much deeper understanding of written language. Accounting researchers need to keep abreast of these developments and explore their potential for generating new insights. Wordnets, for example, can help verify prior findings concerning causal explanations in accounting texts using larger samples (Aerts & Yan, 2017).
Further, once we acknowledge the interplay between sincerity and bias in textual disclosures, questions arise as to the various factors that affect management choices. While this paper is focused on ownership structure and equity market incentives, future research may examine the incentives associated with management remuneration. The role of other stakeholders, such as employees and customers, remains to be explored. National contexts may affect not only regulation and enforcement, but also the significance attached to various disclosure types and their characteristics. Many of the areas indicated by Loughran and McDonald remain to be explored (Loughran & McDonald, 2016).
Finally, the effect of management choices in the use of tone is an avenue of research that needs further investigation. Tone is a relatively minor element of the whole information set (Feldman et al., 2010). Nevertheless, textual disclosures have been shown to play a meaningful role in moderating the effect of other information that is being disclosed (Abrahamson & Amir, 1996; Baginski et al., 2018). Calls are being made for examining the interactions between different sources of information and their characteristics (Lipe, 2018). Further research along these lines may lead to interesting findings.
7. Conclusions
We study tone in letters to shareholders with the aim of identifying and measuring the impact of situational incentives on sincere communication and bias. The findings integrate a number of research streams in textual analysis. The results show that managers are on average sincere in their use of tone: tone is correlated with company performance. This is in line with some previous research (Abrahamson & Amir, 1996; Allee & Deangelis, 2015; Davis & Tama-Sweet, 2012; García Osma & Guillamón-Saorín, 2011; Li, 2010b). Positive bias occurs among companies that are closely held by a major shareholder and companies that are attractively positioned in the stock market. These results integrate findings of (García Osma & Guillamón-Saorín, 2011; Melloni et al., 2016) showing, that weak corporate governance is associated with an overused of positive tone together with the view, that market incentives influence the reporting behaviour of managers (Allee & Deangelis, 2015; Arslan-Ayaydin et al., 2016; Daske et al., 2013). The presence of institutional investors counters the bias caused by ownership concentration, supporting the stream of research into the roles of different shareholder groups (Mäki et al., 2016; Schoenfeld, 2017).
This study contributes to the literature on textual corporate disclosures in a number of ways. First, it integrates the study of linguistic tone with the literature on management accounting choices. Thus, we support the consolidation of textual research around fundamental problems of the accounting literature. Second, we provide novel evidence supporting earlier findings that the use of tone by managers can be predicted based on rational factors: financial performance, equity market incentives and ownership structure. Thirdly, we illustrate how the interactions between incentives affect management choices on the use of tone. We perform marginal analysis to measure the effect of the key variables and their interactions, showing how the probability of using each level of tone depends on the mix of ownership and equity-market incentives. Finally, we provide novel evidence that the monitoring role of institutional investors extends to the use of tone in closely held companies.
Our findings have practical implications for shareholders and managers. Shareholders and investors need to assess the presence of incentives towards bias when using letters to form expectations about company performance. According to our research, the potential presence of bias hinders the ability to form positive expectations. Managers acknowledge that under rational expectations investors make differential assessments of disclosed information by taking into account the presence of incentives when selecting the level of tone. Consequently, managers can predict that once they bias tone positively, they risk that investors will disregard positive information. In that case, only negative information can be communicated effectively. Managers may consider these effects of bias in planning their communication strategy. Since bias has no effect on the ability to communicate negative information, they may benefit from adapting their use of tone according to the expansion and contraction phases of the stock market.