Does Securities Commission Oversight Reduce the Complexity of Financial Reporting?
ABSTRACT
We investigate whether securities commission oversight reduces the complexity of financial reporting (complexity). To measure the securities commission oversight, we use comment letters from securities commission of Iran. Further, to measure the complexity, we employ the Fog index. Using a difference-in-differences design with a propensity score matching approach, we find that the securities commission oversight reduces the complexity. Furthermore, we document that the impact of securities commission oversight on the complexity is stronger for firms with higher corporate governance quality. In addition, we document that the impact of securities commission oversight on the complexity (1) is not limited to one year and persists through at least two years later; and (2) is not higher for firms that receive more comment letters. We further document the spillover effect of securities commission oversight, in the sense that firms not receiving any comment letter reduce their complexity if the securities commission has commented on the industry leader or a close rival. Collectively, this paper, on the one hand, provides related evidence for the international debate on whether securities commissions could provide beneficial effects; and on the other hand, contributes to the literature on the complexity and its reducing factors that are among the most important issues in the context of international financial reporting.
Keywords: Securities commissions, Complexity, Opportunistic managerial behavior, Information-processing costs, Spillover effect, Information obfuscation.
JEL classification: G32, M42, M48
¿La supervisión de la Comisión de Valores reduce la complejidad de los informes financieros?
RESUMEN
En este trabajo se investiga si la supervisión de la Comisión de Valores reduce la complejidad de los informes financieros. Para ello se utilizan las cartas de opinión (comment letters) de la Comisión de Valores de Irán. Además, para medir dicha complejidad, se emplea el índice de Fog. Usando un diseño de diferencia en diferencias con la aproximación propensity score matching, se encuentra que la supervisión de la Comisión de Valores reduce esta complejidad. Además, se muestra que el impacto de la supervisión de las comisiones de valores en la complejidad de los informes financieros es mayor para las empresas con mayor calidad de gobierno corporativo. También se documenta que este impacto (1) no se limita a un año y persiste al menos dos años después, y (2) no es mayor para las empresas que reciben más cartas de opinión (comment letters). Además, se constata el efecto indirecto de la supervisión de la comisión de valores, en el sentido de que las empresas que no reciben ninguna carta de opinión (comment letters) reducen la complejidad de sus informes financieros si la comisión de valores ha hecho comentarios sobre la empresa líder del sector o sobre un competidor cercano. En definitiva, este artículo proporciona, por un lado, evidencia relacionada con el debate internacional sobre si las comisiones de valores podrían tener efectos beneficiosos en la información financiera que elaboran las empresas y, por otro, contribuye a la literatura sobre la complejidad de los informes financieros y los factores que reducen la misma, lo cual ocupa un lugar destacado entre los temas más importantes en el contexto de la información financiera internacional.
Palabras clave: Comisiones de Valores, Complejidad, Comportamiento gerencial oportunista, Costes de procesamiento de la información, Efecto indirecto, Confusión de la información.
Códigos JEL: G32, M42, M48
1 Introduction
Complexity of financial reporting generally refers to the complexity of explanatory language surrounding company’s financial reporting (Guay et al., 2016). Based on processing fluency theory from psychology (Hafner and Stapel, 2010; Shah and Oppenheimer, 2007) and incomplete revelation hypothesis from financial literature (Bloomfield, 2002), existing literature (e.g., Li, 2008; Guay et al., 2016; Lo et al., 2017) argue that managers have incentives to increase the complexity of financial reporting (complexity). To clarify, since markets under-react to information that is too cognitively difficult or costly to analyze, managers have incentives to obfuscate poor performance, irregularities or bad news by complicating the financial reporting through writing unnecessarily long sentences and using complicated language (Bloomfield, 2002; 2008). For this reason, in recent years, securities commissions have more closely monitored the managers to reduce the complexity. For example, in the United States of America, the Securities and Exchange Commission (SEC) has devoted major resources in oversight processes and has begun scrutinizing managers’ financial reporting behavior (Lewis, 2012).
Theoretically, on the one hand, some prior research concludes that securities commissions’ oversight is not effective (La Porta et al., 2006; Djankov et al., 2008). For example, La Porta et al. (2006) and Djankov et al. (2008) suggest that a securities commission’s role is best in setting rules as opposed to enforcing them. Therefore, the incremental effect of securities commissions’ oversight on the complexity could not be significant. On the other hand, if the detection of poor performance, irregularities or bad news is difficult due to the complexity of a company, the securities commissions could impose penalties against the company (Robinson et al., 2011). To the extent that the current costs and future costs—such as additional scrutiny by stakeholders—of these penalties are sufficiently high, managers should reduce the complexity. Thus, the securities commissions’ oversight may reduce the complexity.
These evidences are raising the question of whether the securities commissions’ oversight is beneficial, especially in reducing complexity. Thus, our research question is that whether securities commissions’ oversight reduces the complexity. We theoretically discuss that securities commissions’ oversight may (1) increase the perceived cost of opportunistic behavior; (2) lead to additional scrutiny by auditors, investors and other stakeholders; (3) lead to negative outcome for managers, (4) lead to demanding higher audit quality, and (5) lead to better corporate performance. In these conditions, managers/firms reduce the complexity.
Our research focuses on the financial reporting oversight procedures provided by the Securities and Exchange Organization of Iran (SEO). The SEO regularly review financial reports and it sends the company a comment letter and request for managers to provide written responses and relative additional information. Thus, following past research (e.g. Cassell et al., 2013; Connelly et al., 2010), to measure the securities commission oversight, we employ comment letters from the SEO. Following prior research (e.g., Miller, 2010; Lehavy et al., 2011; Guay et al., 2016; Cassell et al., 2019; Lo et al., 2017; Dyer et al., 2017; Bozanic et al., 2019; Chen et al., 2018; Chychyla et al., 2018), we measure the complexity using the Fog index. To ensure that our findings are not attributable to general time trends in complexity, and to address selection issues related to which companies are more likely to oversight, we employ a difference-in-differences design with a propensity score matching approach. Briefly, we compare the Fog index, pre- and post- SEO comment letter receipt between the comment letter companies and matched no-comment letter companies.
Our findings reveal that there is an inverse relationship between the securities commission oversight and complexity. In other words, our findings show that securities commission oversight reduces the complexity. This finding is generally consistent with the theoretical evidence indicating that the securities commission oversight restricts the opportunistic managerial behavior. Furthermore, our findings reveal that the impact of securities commission oversight on the complexity is stronger for firms that have high quality corporate governance, as compared to firms that have low quality corporate governance. In supplemental analyses, we show that the impact of securities commission oversight on the complexity, (1) is not limited to one year and persists through at least two years later; and (2) is not higher for firms that receive multiple comment letters, as compared to firms that only receive one comment letter. We further show firms that did not receive any comment letter tend to reduce their complexity if the SEO has commented on their industry leader or close rival.
Generally, since practitioners and academics in different countries often focus on the oversight role in terms of evaluating its benefits and creating/reforming regulations, our findings are important. Furthermore, since our study, in contrast to some prior studies (La Porta et al., 2006; Djankov et al., 2008; Jackson and Roe, 2009), are based on exploring the actual oversight activities undertaken by a securities commission, the findings are probably more important.1
Regardless, our study contributes to two major streams of research. First, it complements prior studies that examine the consequences of securities commission oversight on financial reporting quality. Therefore, (a) generally it provides related evidence for the international debate on whether securities commissions could provide beneficial effects. (b) Particularly, it provides evidence on the consequences of securities commission oversight in a (non-U.S. and) developing capital market. Thus, this study contributes to the literature by extending the literature to a developing capital market. To clarify the importance of this contribution, it is worth mentioning that (1) to the best of the authors’ knowledge, almost all of the studies on securities commission oversight (comment letter observations) are from U.S capital market, and therefore, generalizability of the studies to other capital markets, especially developing capital markets, is probably an open question. (2) Prior research suggest that in developing capital markets, relying on conventional corporate governance mechanisms is not sufficient in reducing agency conflicts and therefore finding other effective mechanisms is very necessary. In this regard, our findings about the impact of securities commission oversight on the managerial misbehavior and complexity would be very useful and extend the literature on the effective corporate governance mechanisms in developing capital markets.
Second, our study complements prior studies that examine the factors that reduce complexity, which is the most important issues in the context of international business and financial reporting (KPMG, 2011). To clarify the importance of this contribution, it is worth mentioning that recent literature (e.g., Guay et al., 2016) suggests that the complexity and its related information processing costs are growing rapidly and therefore it is very essential to find effective mechanisms in reducing complexity.
2 Background and hypothesis development
As previously mentioned, this paper investigates whether securities commission oversight reduces the complexity. Hence, in this section, first, we start by reviewing the literature on complexity. Then, we briefly describe the SEO’s oversight process. Finally, we theoretically explain why we expect securities commission oversight reduces the complexity.
2.1 Complexity
Processing fluency theory (Hafner and Stapel, 2010) suggest that higher complexity reduces the ease with which information is processed, namely processing fluency. This lower processing fluency weakens information recipients’ beliefs about information reliability (Shah and Oppenheimer, 2007), leads to less favorable evaluations of the messenger and reduces the ability to extract information (Oppenheimer, 2006).
In the context of financial reporting, these conditions increase the information-processing costs. In this regard, incomplete revelation hypothesis (Bloomfield, 2002; 2008) suggests that information with higher processing costs drives less trading interest and therefore less completely revealed by market prices, resulting to less price efficiency and higher uncertainty (Grossman and Stiglitz, 1980; Kim and Verrecchia, 1991; Guay et al., 2016). That is why the securities commissions have long voiced concerns about the complexity.
Particularly, in the context of managers’ financial reporting behavior, incomplete revelation hypothesis (Bloomfield, 2002; 2008; Li, 2008) predicts that to the extent that complexity increases information-processing costs for investors, managers can use complexity to obfuscate poor performance, irregularities or bad news. For this reason, securities commissions have more closely monitored the managers to reduce the complexity.
Recently, the regulators concern over the complexity has spawned a surge in empirical research investigating the complexity. In financial literature, researchers often use the Fog index as a measure of complexity (e.g., Miller, 2010; Lehavy et al., 2011; Guay et al., 2016; Cassell et al., 2019; Lo et al., 2017; Dyer et al., 2017; Bozanic et al., 2019; Chen et al., 2018; Chychyla et al., 2018). The Fog index that was first brought into the financial literature by Li (2008), is defined as a linear combination of two metrics: average sentence length and proportion of complex words.
In this regard, Li (2008) found a negative relationship between profitability and complexity, concluding that managers try to hide bad news by complicating the financial reporting. Further, Lo et al. (2017) find that firms most likely to have managed earnings to beat the prior year's earnings have more complex reports. The current literature research also displays that the higher complexity is associated with lower forecast accuracy (Bozanic et al., 2019), fluctuation of credit rating (Bonsall and Miller, 2017), increased idiosyncratic volatility (e.g., Loughran and McDonald, 2016), lower trading volume (Lawrence, 2013), and lower information efficiency (Lee 2012).
2.2 SEO’s oversight process
In Iran, the SEO has an oversight role of financial reporting through its review of company filings (Islamic Consultative Assembly, 2005). Generally, the SEO’s review process is relatively comparable to the SEC review process, as the key source to frame oversight process in Iran’s capital market, is the SEC oversight process. The SEO selectively reviews filings made under the Securities Market Act. The reviews aim to increase transparency and expresses the SEO’s willingness to discuss disclosure deficiencies with companies. Much of these reviews involve evaluating the corporate repotting from an investor’s view. If the reviews identify potential deficiencies, the SEO sends the company a comment letter seeking clarification, additional information, and oftentimes revision of the filing or future filings. The initial comment letter includes a request for managers to submit a written response within ten business days or to propose an alternative time frame. The response of managers must include new or additional disclosures in the financial reports. The SEO consider response of managers and their new or additional disclosures and then, may issue new comment letters until all potential deficiencies are resolved. The review process varies in duration to resolution and the number of rounds of formal questions and answers between the SEO and the managers. Ultimately, the process may terminate with the SEO recommending the cases of financial reporting irregularities to the process of regulatory enforcement and sanctions. Notable, the potential sanctions on the information obfuscation are very heavy for managers/firms and may include disqualification of managers, unlimited fines, or suspension of listing (SEO, 2008).
2.3 Hypothesis development
Generally, as Johnston and Petacchi (2017) detailed, securities commissions’ oversight role may avoid substantive issues, thus creating no economic benefits. Since, for example, given that public companies’ financial statements are audited, it seems reasonable to question whether any significant benefit could arise from a securities commission review. Unlike an audit, a review begins simply with the securities commission staff reading the corporate filings. Moreover, regulated firms may manipulate the agency regulating them (see Dal Bo, 2006 for a review). Further, La Porta et al. (2006) and Djankov et al. (2008) suggest that a regulator’s role is best in setting rules as opposed to enforcing them. Nevertheless, the concerns of limited economic effect of securities commissions’ oversight role may be offset by several factors and therefore the economic impact of the role could be substantial. Since, for example, companies have the freedom to select from differing auditor types, auditing is inherently imperfect, and auditor incentive problems may magnify the problem (Antle, 1982; Imhoff, 2003; Lawrence et al., 2013). Further, the securities commissions’ oversight is institutionally the last line of defense in policing reporting quality, and has the potential to compensate for both managerial misbehavior and audit weaknesses.
Particularly, theoretical evidence indicates that companies decrease their complexity following the receipt of a comment letter. Since, first, the receipt of a comment letter provides a signal that SEO (as well as other supervisory mechanisms such as board of directors or auditors) closely monitors the company (Connelly et al., 2010). This signal psychologically increases the perceived cost of opportunistic managerial behavior (Cassell et al., 2019).2 The perceived cost of opportunistic managerial behavior will be sufficiently high because the close monitoring of the company may draw the attention of regulator to other significant problem, and reveal new deficiencies (Brown et al., 2018; Francis, 2011). Consequently, the increase in the perceived cost of opportunistic managerial behavior reduces opportunistic managerial behavior (Rennekamp, 2012). For example, Bens and Johnston (2009) provide evidence of the securities commissions’ oversight role in limiting earnings management through restructuring charges. Thus, managers less likely need to mask the true consequences of their decisions (Connelly et al., 2010) and less likely need to complicate the relative reports (Li, 2008).
Second, prior studies show that the receipt of a comment letter provides significant signals to capital markets about financial reporting (Skomra, 2018). These signals really lead to additional scrutiny by auditors, institutional investors and other stakeholders (Bens et al., 2016), because it affects “information asymmetries about latent and unobservable quality” (Connelly et al., 2010) of financial reports. For example, Gietzmann and Pettinicchio (2014) suggest that auditors incorporate the signal from comment letter in determining the client audit risk and increase their scrutiny and audit quality and adjust fees upwards in the period during which the comment letter is received. This additional scrutiny, in additional to restricting the opportunistic behavior, directly increases the financial reporting precision and reduces complexity (Johnston and Petacchi, 2017).
Third, prior studies show that the receipt of a comment letter may lead to undesirable outcome for managers (Francis, 2011; Brown et al., 2018). For example, Gietzmann and Isidro (2013) provides evidence that the receipt of a comment letter serve as a negative signal of financial reporting quality and find evidence that shareholder negatively react to comment letter by sailing their shares. Further, Goldstein and Sapra (2013) provide evidence that the receipt of a comment letter causes market participants to impose “market discipline”. Therefore, managers attempt to find ways to improve their reputation and image (Guay et al., 2016) or to reduce market discipline (Duro et al., 2018). Under this situation, they have stronger incentives to revive the lost trust and to provide positive signals thought decreasing their opportunistic behavior. This decreasing opportunistic behavior may increase the financial reporting quality and reduce the complexity.3
Fourth, comment letters provide a valuable signal to managers to demand higher quality audits. To clarify, as SEO review is majorly performed on the audited financial reporting, which is the joint product of management and auditors, managers after taking corrective action will demand a higher quality work from their auditors to remediate issues addressed by the SEO (Skomra, 2018), to avoid comment letters in the future (Cassell et al., 2013), and to provide a positive signal to the markets (Skomra, 2018). This higher quality audits, in additional to restricting the opportunistic behavior, directly increases the financial reporting precision and reduces complexity (Johnston and Petacchi, 2017).
Fifth, the receipt of a comment letter may lead to better corporate performance. To clarify, prior research (e.g., Chen et al., 2007; Harford et al., 2017) shows that oversight pressures provide a valuable signal to managers to exert greater effort in managing the firm. Further, prior studies (e.g., Bertrand and Mullainathan, 2003; Baghdadi et al., 2018) argue and find that the effort—rather than skill— is the real driver of managerial and corporate performance. Thus, oversight pressures may lead to greater effort and therefore higher corporate performance. Similarly, receipt of a comment letter as a sign of oversight pressures may provide a signal to managers to exert greater effort and therefore improve corporate performance. Under this situation, managers not only no longer need to/motivated to complicate the financial reports, but also have stronger incentives to increase the transparency and to reduce complexity (Li, 2008). As an alternative view, the receipt of a comment letter may decline corporate performance. To clarify, comment letters may lead to the release of negative information that managers was withholding (e.g. Kothari et al., 2009), and therefore based on this negative information, revised earnings could be declined. In this situation, managers cannot easily complicate the financial reports as the securities commission directly reviews the released negative information, and more importantly, managers have lower need to complicate the financial reports as the some part of negative information is revealed.4
Based on the theoretical discussion above, we state our first hypothesis in the alternative form as follows:
H1: Companies reduce their complexity following the receipt of a comment letter.
Theoretically, prior studies (e.g., GAO, 1991; Johnston and Petacchi, 2017; Baugh et al., 2019) suggest that corporate governance quality may affect the economic consequences of securities commission oversight. Particularly, GAO (1991) and Baugh et al. (2018) state that corporate governance is essential for a successful regulatory oversight. This is because higher corporate governance quality speeds up and improves the corrective action of managers. For clarity, the higher corporate governance quality may increase the negative outcome of comment letters for managers resulting prompt effort from the managers to resolve the issues. Hence, the higher corporate governance quality may speed up the corrective action of managers (Mishkin, 1997) in response to comment letters.
In addition, higher corporate governance quality may also complement the securities commission oversight by incorporating the signal from comment letter in determining other oversight process such as the oversight process of institutional investors, directors, audit committees or external auditors (GAO, 1991; Bens et al., 2016). Further, higher corporate governance quality may draw directors and auditors attention to new major problems, and reveal new deficiencies (e.g., Ryans, 2019; Brown et al., 2018). Thus, the higher corporate governance quality may improve the corrective action of managers (Mishkin, 1997) in response to comment letters and beyond the scope of comment letters.
Based on the theoretical discussion above, we state our second hypothesis in the alternative form as follows:
H2: The impact of comment letters on complexity is stronger for firms having higher corporate governance quality.
3 Research design
3.1 Measuring securities commission oversight and complexity
In this paper, we investigate whether and how securities commission oversight reduces the complexity. Thus, our main independent variable is the securities commission oversight and our dependent variable is the complexity.
Following relevant studies (see for example, Cassell et al., 2013; Cassell et al., 2019; Cunningham et al., 2019), we proxy for the securities commission oversight with SEO comment letter. Specifically, our measure of securities commission oversight, CommentLetter, is a dichotomous variable set equal to one if a firm receives an SEO comment letter in year “t”, and zero otherwise.
Further, following the extensive recent literature (Guay et al., 2016; Cassell et al., 2019; Lo et al., 2017; Dyer et al., 2017; Bozanic et al., 2019; Chen et al., 2018; Chychyla et al., 2018), we measure complexity using the Fog index. The Fog index, developed by Robert Gunning, is a well-known and simple formula for measuring complexity (Li, 2008). Assuming that the text is well formed and logical, the Fog index captures text complexities as a function of sentence length plus the intensity of complex words, (words with three or more syllables). This sum is multiplied by 0.4 such that the Fog index reflects the number of formal education years which required to understand the text (e.g., Lo et al., 2017). Technically, for measuring complexity, we rely on calculation below:
Fog = 0.4 × [number of words / number of sentences + 100× (number of words with more than two syllables / number of words)]
The FOG suggests that, ceteris paribus, texts having greater average of words per sentence or percent of complex words are more complex. The Fog index is widely used in social science studies to investigate the relationship between the complexity of written information and diverse outcomes or decisions such as consumer drug use, consumer warranties, medical error, mutual fund prospectuses, jury instructions, and academic research prestige (Lehavy et al., 2011). This index (or its components) is (are) usually used to measure the complexity of English and non-English texts such as Spanish (e.g., San Norberto et al., 2014; Moreno and Casasola, 2015), French (e.g., Zurel, 2014), Persian (e.g., Kolahi and Shirvani, 2012), and Korean (e.g., Jang and Rho, 2016) texts. While the Fog index has limitations (Loughran and McDonald, 2016), it has several important advantages. For example, it allows the study of a large sample of firms, it provides an objective measure, and it allows one to directly examine the overall complexity of firms’ written narrative disclosures (Lehavy et al., 2011), which is probably why recent studies often use the Fog index as a measure of complexity constructs (see for example, Guay et al., 2016; Cassell et al., 2019; Lo et al., 2017; Dyer et al., 2017; Bozanic et al., 2019; Chen et al., 2018; Chychyla et al., 2018).
To measure FOG, this paper focuses on financial statement notes as a key component of financial reports (Lawrence, 2013). Following past studies (e.g., Lehavy et al., 2011; Lee, 2012), we exclude the non-text information and all sections having more than 50% of non-alphabetic characters.5
3.2 Difference-in-differences design
The SEO may pay particular attention to certain types of companies, and these companies will be reviewed more often than other companies. For example, because the oversight consumes valuable resources, it is reasonable that securities commissions apply a risk-based model to choose the companies for oversight each year (Cassell et al., 2019). Therefore, it is probable that certain types of companies are more likely to receive a comment letter. This issue suggests that there may be systematic differences between companies that receive an SEO comment letter and companies that do not.
Moreover, it is likely that complexity influenced by time trends. For example, prior studies (e.g., Brown et al., 2018) indicate securities commission oversight in a given year could create a spillover or positive externality effect on other companies in following years. If spillover results in changes to no-comment letter companies’ behavior that better aligns with the intent of requirements, the changes in complexity, go beyond comment letter companies.
For these reasons, i.e., to address selection issues related to which companies are more likely to oversight and also to ensure that our findings are not attributable to general time trends in complexity; following prior studies (e.g., Eshleman et al., 2014; Shipman et al., 2017; Connelly et al., 2010; Johnston and Petacchi, 2017) we employ a difference-in-differences design with a propensity score matching approach. Further clarification follows.
First, we identify all companies that receive a comment letter in a given year t, and propensity-score match the comment letter companies and no-comment letter companies, using a one-to-one match and the nearest neighbor. We propensity-score match following Cunningham et al. (2019). A company’s propensity score is the probability of receiving an SEO comment letter conditional on the company’s observable criteria. Theoretically, our criteria include those identified by papers examining the determinants of the receipt of a comment letter (Cassell et al., 2013; Johnston and Petacchi, 2017; and Cheng et al., 2014; Connelly et al., 2010).
Technically, to generate propensity-score, we rely on the estimation in Equation (1):
CommentLetterit = β0 + β1Complexit +β2AEMit+ β3REMit + β4M_Weakit + β5Restateit + β6HVolit + β7lnMCapit + β8Ageit + β9Lossit + β10Zscoreit+ Industry fixed effects + Year fixed effects + εit (1)
Where CommentLetter is a dichotomous variable set equal to “one” (zero) for the company (not) received a comment letter on the financial statements in year t; and Complex is “0.4× (average of words per sentence + percent of complex words). Table 1 provides descriptions of all variables.
Table 1. Descriptions of variables (alphabetic)
| Variable | Description |
|---|---|
| AEM | The accrual earnings management computed exactly as in Ball and Shivakumar (2006) |
| AudTenure | Auditor tenure in years |
| Big | A dichotomous variable coded 1 if the auditor is a big audit firm, and 0 else |
| σCFO | The standard deviation of cash flow from operations from year t−4 to year t, divided by the average total assets |
| Close rival | A dichotomous variable coded 1 for firms with the closest total assets within their industry at the end of fiscal year t and 0 else; computed exactly as in Brown et al. (2018) |
| Comment Letter | A dichotomous variable coded 1 if the firm received an SEO comment letter in year t, and 0 else; computed exactly as in Cunningham et al. (2019) |
| Age | The number of years the firm has been listed on TSE |
| Complex | 0.4×(average of words per sentence + percent of complex words) computed exactly as in Li (2008) |
| Corporate governance quality | The governance index determined following Lopes et al. (2016). Consequently, high (low) corporate governance quality refers to higher (lower) than median corporate governance quality. |
| HVol | Volatility of daily stock returns that is a dichotomous variable equals to 1 if the volatility of daily returns for the year is in the quartile four in year t, and 0 else |
| Industry leader | A dichotomous variable coded 1 for firms with at least 20% of the market share of sales within their industry in year t and 0 else; computed exactly as in Brown et al. (2018) |
| Inst | The percentage of shares owned by institutional investors |
| MCap | Natural logarithm (shares outstanding at × the share price at the end of year) |
| Loss | A dichotomous variable coded 1 if earnings before extraordinary items is negative in year t |
| M_Weak | A dichotomous variable coded 1 if the audit reports is revealed an internal control weakness in year t and 0 else |
| MTB | Market value of equity plus total liabilities divided by total assets |
| NegEarn | Proportion of losses (negative earnings) for the company over year t−4 to year t. |
| OperCycle | Natural logarithm of the average trade receivables period plus the average stockholding period. The trade receivables period is 360/(Sales/Average trade receivables) and the stockholding period is 360/(Cost of goods sold/average inventory). |
| Performance | A portion of firm performance that is affected by managerial actions; computed exactly as in Demerjian et al. (2012) |
| Post | A dichotomous variable coded 1 in the year (and its following years) that a comment letter receipt, for both treatment group (99 comment letter observations) and matched control group (99 no-comment letter observations), and 0 else (for 198 observations); computed exactly as in et al. (2018) |
| REM | The real earnings management computed exactly as in Roychowdhury (2006) |
| Restate | A dichotomous variable coded 1 if the company restate its financial statement in year t and 0 else |
| ROA | Income before extraordinary items divided by total assets |
| σSale | The standard deviation of sales revenues from year t−4 to year t, divided by the average total assets |
| Size | Natural logarithm of total assets (Million Rials) |
| Treatment-ControlGroup | A dichotomous variable coded 1 for treatment group (comment letter companies, i.e., 99 comment letter observations ×2 year=198 observations), and 0 for control group (no-comment letter companies, i.e., 99 matched no-comment letter observations ×2 year=198 observations); computed exactly as in Cunningham et al. (2019) |
| TEM | The principal component of AEM and REM |
| Zscore | A dichotomous variable coded 1 if the company’s Z score is greater than median and 0 else. Z score= [(1.4 × Retained earnings + Sales + 3.3 × Pre-tax income + 1.2 × (Current assets– Current liabilities)) ÷ Total assets] |
This table defines the main variables.
Following Eshleman et al. (2014), after obtaining the fitted values from estimating Equation (1), we match each comment letter company, to the no-comment letter company with the closest fitted value in the same year and same industry.
Second, we compare the changes in complexity pre- and post-comment letter receipt between the treatment group, i.e., comment letter companies, and control group, i.e., no-comment letter companies. To do this, we rely on the estimation in Equation (2):
Complexi,t = γ0 + γ1 Treatment-ControlGroupi,t + γ2Posti,t + γ3(Treatment-ControlGroupi,t ×Posti,t) + γ4Size + γ5σSale+ γ6σCFO + γ7NegEarn + γ8OperCycle + γ9MTB + γ10ROA + γ11HVol + γ12Age+ γ13Big + γ14AudTenure + γ15Inst + Industry fixed effects + Firm fixed effects + μi,t (2)
Where Complex is as defined under Equation (1); and Treatment-ControlGroup is set equal to one for the treatment group — i.e., comment letter companies— and zero for the control group— i.e., no-comment letter companies. The coefficient of interest is γ3, which represents the differential change in complexity between the treatment group and the matched control group. Other variables are our control variables, that following earlier studies (e.g., Li 2008; Guay et al., 2016; Lo et al., 2017; Connelly et al., 2010) we expect they affect complexity. Notable, to mitigate this concern that complexity may be driven by firm fundamentals, rather than managerial choices, following Francis et al. (2005), Hesarzadeh and Bazrafshan (2018), and Hesarzadeh et al. (2019) we use summary indicators of the firm’s fundamental as control variables.6 Table 1 provides descriptions of all variables.
Our second hypothesis predicts that the impact of comment letters on complexity is stronger for firms having higher corporate governance quality. To empirically examine this hypothesis, consistent with the previous analysis in this section, after estimation of Equation (1), we rely on the estimation of Equation (2) for two groups of firm-years (subsamples): firm-years having low corporate governance quality versus firm-years having high corporate governance quality. To measure corporate governance quality, following Lopes et al. (2016), we scores the quality of corporate governance at the firm-year level using 15 questions that cover four dimensions of corporate governance, including board composition & performance; control & ownership structure; disclosure; and shareholder rights (see questions 1 to 15 in Exhibit 1 of Lopes et al. (2016)).
3.3 Sample and data
Table 2 describes our sample selection procedure. Our sample consists of all companies listed on the Tehran Stock Exchange (TSE) from 2010-2016, where the data on comment letter is available for this research.7, 8 We obtain our data from the Rahavard-e-Novin.9 Following prior studies (e.g., Baghdadi et al. 2018; Demerjian et al. 2012), we exclude all financial or utility industry companies due to the dissimilarity in the nature of the various metrics and the regulations rendering the characteristics of their financial information incomparable to those in other industries (Jiraporn et al., 2009). Furthermore, we exclude observations without the necessary data to compute our variables. These constraints reduce our observations to 467. We use these observations to estimate the Equation (1).
We obtain the comment letter data from the SEO’s Division of Auditing and Financial Reporting. Consistent with prior literature (e.g., Cunningham et al. 2018) and our research question, we only consider the comment letters on financial statements including 99-comment letters observations.10 As previously mentioned, we propensity-score match these 99 observations to 99 no-comment letter companies, using a one-to-one match and the nearest neighbor. Moreover, to compare the changes in complexity of pre- and post-comment letter receipt, we use the aforementioned 198 (99 + 99) companies for the year following a comment letter receipt. This procedure yields 396 observations. We use these observations to estimate the Equation (2).
Table 2. Sample selection procedures
| Observations | |
|---|---|
| All companies listed on the TSE from 2010 to 2016 | 2,219 |
| Financial or utility industry companies | (966) |
| Company-years with low trade levels | (503) |
| Company-years with insufficient information | (283) |
| Final sample used for the Equation (1) | 467 |
| Comment letter observations in a year t [1] | 99 |
| Propensity-score matched no-comment letter observations in a year t [2] | 99 |
| The aforementioned (row [1]) comment letter companies in year t+1, i.e., after receiving comment letter [3] | 99 |
| The aforementioned (row [2]) no-comment letter companies in year t+1, i.e., after receiving comment letter [4] | 99 |
| Final sample used for the Equation (2) | 396 |
This table describes the sample selection procedure.
Note for more clarification about the descriptions of some variables in Table 1:
CommentLetter = 1 for [1], and CommentLetter = 0 for other (467-99 =) 368 observations.
Treatment-ControlGroup = 1 for [1] & [3], and Treatment-ControlGroup = 0 for [2] & [4].
Post = 1 for [3] & [4]; and Post = 0 for [1] & [2].
It is worth stating that TSE setting are comparable to large developing capital markets. To clarify, at a macro view, starting in the late 1980s, similar to the large developing capital markets (see for example, Torre and Schmukler, 2006; Chow et al., 2016; International Monetary Fund, 2016; Subramaniam et al., 2016) government of Iran implemented macro stabilization programs and liberalized their financial systems, leading to the proper market infrastructure and institutions for capital markets to flourish (Mashayekhi and Mashayekh, 2008). Further, since the 2000s, similar to many of the countries, government of Iran has reduced inflation, brought external debts under control, and improved on most of the key economic and social performance indexes. These reforms gradually, for instance, increased the average ratio of total market capitalization to Iran’s GDP to about 30% (TSE, 2016). At a micro view, comparable to most of large developing capital markets (see for example, Torre and Schmukler, 2006), the number of companies in capital market of Iran is about 300 and these companies are characterized by relatively high concentrated ownership structures. Over the last decades, institutional investors have significantly increased their participation in the Iran’s capital market and consequently helped to create a more stable demand for securities. In the context of financial reporting, a basis to formulate some important regulations, such as regulations on financial reporting (annual reporting, interim reporting, M&D reporting, etc.) is large capital markets regulations, such as U.S. capital market regulations. Moreover, in the last three decades, Iran has employed international accounting/auditing standards — namely, “IASs/IFRSs” and “ISAs”— as a basis for developing its national accounting standards.11 For this reason, the national accounting standards are similar to the international accounting standards (Hesarzadeh et al., 2019).12 Notable, (large) Iranian listed companies are (required) permitted to apply international accounting standards since (2016) 2012 (IFRS Foundation, 2017).
4 Findings
4.1 Descriptive statistics
Table 3 displays the basic features of main variables. Of the sample of 467 observations, 21 percent (99 observations) receive a comment letter. The table displays that the average of Complex is approximately 14.8 that is lower compared to studies that examine the English version of financial statements. For example, the average of Complex in Li (2008) and Lo et al. (2017) is approximately 18 to 19, respectively. Theoretically, this difference in the Complex is reasonable. Since, in the Persian language, the length of sentence is 15% shorter compared to English (KhazaeeFarid and Fathollahi, 2010). Further, the operational environments of the companies in our sample are less complex compared to the U.S. capital market; therefore, as noted by Bloomfield (2008), lower complex words suffice to convey information. Nevertheless, the standard deviation of Complex is approximately 1.6, which is close to that reported in the past research (see, for example, Lo et al., 2017).
Table 3. Descriptive statistics for sample firms
| Variables | Mean | Standard deviation | First quartile | Median | Third quartile |
|---|---|---|---|---|---|
| CommentLetter | 0.210 | 0.408 | 0.000 | 0.000 | 0.000 |
| Complex | 14.772 | 1.597 | 14.675 | 13.846 | 15.638 |
| AEM | 0.000 | 0.097 | 0.005 | -0.050 | 0.062 |
| REM | 0.000 | 0.621 | -0.030 | -0.195 | 0.134 |
| M_Weak | 0.089 | 0.285 | 0.000 | 0.000 | 0.000 |
| Restate | 0.081 | 0.273 | 0.000 | 0.000 | 0.000 |
| HVol | 0.246 | 0.431 | 0.000 | 0.000 | 0.000 |
| MCap | 13.369 | 1.818 | 13.242 | 12.342 | 14.197 |
| Age | 22.452 | 12.194 | 19.000 | 13.000 | 30.000 |
| Loss | 0.108 | 0.311 | 0.000 | 0.000 | 0.000 |
| Zscore | 0.510 | 0.500 | 1.000 | 0.000 | 1.000 |
| Size | 14.028 | 1.942 | 13.830 | 12.936 | 14.643 |
| σSale | 0.271 | 0.253 | 0.159 | 0.113 | 0.329 |
| CFO | 0.131 | 0.154 | 0.086 | 0.062 | 0.136 |
| NegEarn | 0.082 | 0.205 | 0.000 | 0.000 | 0.000 |
| OperCycle | 5.658 | 0.523 | 5.687 | 5.429 | 5.992 |
| MTB | 0.594 | 0.236 | 0.586 | 0.457 | 0.727 |
| ROA | 0.148 | 0.165 | 0.139 | 0.066 | 0.221 |
| Big | 0.257 | 0.437 | 0.000 | 0.000 | 1.000 |
| AudTenure | 2.858 | 2.221 | 2.000 | 1.000 | 4.000 |
| Inst | 72.107 | 24.299 | 79.740 | 64.240 | 90.390 |
This table presents the descriptive statistics for the main variables.
The variable CommentLetter is a dichotomous variable coded 1 if the firm received an SEO comment letter in year t, and 0 else. Complex equals 0.4×(average of words per sentence + percent of complex words). AEM is the accrual earnings management computed exactly as in Ball and Shivakumar (2006). REM is the real earnings management computed exactly as in Roychowdhury (2006). M_Weak is a dichotomous variable coded 1 if the audit reports is revealed an internal control weakness in year t and 0 else Restate is a dichotomous variable coded 1 if the company restates its financial statement in year t and 0 else. HVol is a dichotomous variable equals to 1 if the volatility of daily returns for the year is in the quartile four in year t, and 0 else. MCap is the Ln (shares outstanding at × the share price at the end of year). Age is the number of years the company is listed on TSE. Loss is the a dichotomous variable coded 1 if earnings before extraordinary items is negative in year t. Zscore is a dichotomous variable coded 1 if the company’s Altman’s Z score computed exactly as in DeFond and Hung (2003) is higher than median and 0 else. Size is the Ln (total assets). σSale is the standard deviation of sales revenues from year t−4 to year t, divided by the average total assets. CFO is the standard deviation of cash flow from operations from year t−4 to year t, divided by the average total assets. NegEarn is the proportion of losses (negative earnings) for the company over year t−4 to year t. OperCycle is the Ln (the average trade receivables period plus the average stockholding period). MTB is the Market value of equity plus total liabilities divided by total assets. ROA is the Income before extraordinary items divided by total assets. Big is a dichotomous variable coded 1 if the auditor is a big audit firm, and 0 else. AudTenure is the auditor tenure in years. Inst is the percentage of shares owned by institutional investors.
Table 4 presents correlation matrix for main variables. Bold reflects statistical significant correlations at the 10% level. The correlation of CommentLetter and Complex is positive (0.216) and significant, representing that the higher complexity may associate higher comment letter. The correlations of variables are lower than 60%, thus, multicollinearity would not be a serious issue in our results. Untabulated VIF scores are all less than 3 showing that multicollinearity is not a serious issue.
Table 4. Correlation matrix
| 1 | 2 | 3 | 4 | 5 | 6 | 7 | 8 | 9 | 10 | 11 | 12 | 13 | 14 | 15 | 16 | 17 | 18 | 19 | 20 | 21 | |
|---|---|---|---|---|---|---|---|---|---|---|---|---|---|---|---|---|---|---|---|---|---|
| 1- CommentLetter | 1 | ||||||||||||||||||||
| 2-Complex | 0.216 | 1 | |||||||||||||||||||
| 3-AEM | 0.430 | -0.009 | 1 | ||||||||||||||||||
| 4-REM | 0.036 | 0.035 | -0.122 | 1 | |||||||||||||||||
| 5-M_Weak | 0.369 | 0.045 | 0.037 | 0.039 | 1 | ||||||||||||||||
| 6-Restate | 0.402 | 0.005 | -0.051 | 0.030 | 0.143 | 1 | |||||||||||||||
| 7-HVol | 0.044 | 0.002 | -0.023 | 0.146 | 0.007 | -0.047 | 1 | ||||||||||||||
| 8-MCap | 0.068 | 0.115 | 0.256 | -0.216 | 0.000 | 0.017 | 0.057 | 1 | |||||||||||||
| 9-Age | 0.058 | 0.082 | 0.012 | 0.079 | -0.082 | 0.020 | 0.104 | -0.030 | 1 | ||||||||||||
| 10-Loss | -0.029 | -0.071 | -0.463 | 0.226 | 0.006 | 0.076 | 0.067 | -0.263 | 0.003 | 1 | |||||||||||
| 11-Zscore | 0.027 | -0.068 | -0.266 | 0.160 | 0.044 | 0.004 | 0.096 | -0.091 | -0.089 | 0.257 | 1 | ||||||||||
| 12-σSize | 0.085 | 0.070 | 0.131 | -0.138 | 0.052 | 0.011 | 0.085 | 0.658 | -0.055 | -0.115 | 0.134 | 1 | |||||||||
| 13-σSale | 0.018 | 0.021 | 0.006 | 0.102 | -0.046 | 0.032 | 0.084 | -0.004 | 0.050 | -0.042 | -0.066 | 0.015 | 1 | ||||||||
| 14-CFO | 0.059 | 0.092 | -0.061 | -0.060 | 0.044 | 0.078 | 0.021 | -0.089 | -0.018 | 0.083 | -0.090 | 0.053 | 0.095 | 1 | |||||||
| 15-NegEarn | -0.063 | -0.094 | -0.41 | 0.162 | -0.045 | 0.039 | -0.018 | -0.262 | -0.051 | 0.685 | 0.296 | -0.196 | -0.047 | 0.018 | 1 | ||||||
| 16-OperCycle | 0.091 | 0.058 | -0.119 | 0.124 | -0.046 | 0.095 | 0.035 | -0.171 | 0.088 | 0.072 | 0.116 | -0.081 | 0.005 | 0.066 | 0.040 | 1 | |||||
| 17-MTB | -0.027 | -0.013 | -0.328 | 0.306 | 0.048 | -0.036 | 0.072 | -0.185 | 0.034 | 0.307 | 0.324 | 0.040 | -0.025 | 0.063 | 0.188 | 0.028 | 1 | ||||
| 18-ROA | -0.018 | 0.082 | 0.526 | -0.307 | -0.035 | -0.049 | -0.108 | 0.443 | 0.071 | -0.527 | -0.467 | 0.162 | 0.065 | 0.031 | -0.574 | -0.182 | -0.374 | 1 | |||
| 19-Big | -0.065 | -0.014 | 0.023 | 0.006 | 0.026 | 0.013 | 0.104 | 0.096 | 0.006 | -0.025 | 0.084 | 0.180 | 0.128 | -0.074 | -0.053 | -0.143 | 0.102 | 0.054 | 1 | ||
| 20-AudTenure | -0.029 | -0.019 | 0.000 | 0.014 | 0.060 | 0.000 | 00.02 | 0.054 | -0.031 | 0.037 | 0.031 | 0.050 | 0.005 | -0.080 | 0.051 | -0.092 | 0.032 | -0.002 | 0.390 | 1 | |
| 21-Inst | -0.006 | 0.159 | 0.086 | -0.097 | 0.060 | -0.047 | 0.033 | 0.205 | -0.234 | -0.129 | 0.104 | 0.221 | -0.011 | -0.109 | -0.151 | -0.097 | -0.036 | 0.078 | 0.059 | 0.071 | 1 |
This table presents Spearman correlations between the main variables. Bold denotes significant correlation coefficients at the 10%.
The variable CommentLetter is a dichotomous variable coded 1 if the firm received an SEO comment letter in year t, and 0 else. Complex equals 0.4×(average of words per sentence + percent of complex words). AEM is the accrual earnings management computed exactly as in Ball and Shivakumar (2006). REM is the real earnings management computed exactly as in Roychowdhury (2006). M_Weak is a dichotomous variable coded 1 if the audit reports is revealed an internal control weakness in year t and 0 else Restate is a dichotomous variable coded 1 if the company restates its financial statement in year t and 0 else. HVol is a dichotomous variable equals to 1 if the volatility of daily returns for the year is in the quartile four in year t, and 0 else. MCap is the Ln (shares outstanding at × the share price at the end of year). Age is the number of years the company is listed on TSE. Loss is the a dichotomous variable coded 1 if earnings before extraordinary items is negative in year t. Zscore is a dichotomous variable coded 1 if the company’s Altman’s Z score computed exactly as in DeFond and Hung (2003) is higher than median and 0 else. Size is the Ln (total assets). σSale is the standard deviation of sales revenues from year t−4 to year t, divided by the average total assets. CFO is the standard deviation of cash flow from operations from year t−4 to year t, divided by the average total assets. NegEarn is the proportion of losses (negative earnings) for the company over year t−4 to year t. OperCycle is the Ln (the average trade receivables period plus the average stockholding period). MTB is the Market value of equity plus total liabilities divided by total assets. ROA is the Income before extraordinary items divided by total assets. Big is a dichotomous variable coded 1 if the auditor is a big audit firm, and 0 else, and 0 else. AudTenure is the auditor tenure in years. Inst is the percentage of shares owned by institutional investors.
4.2 Multivariate tests
As previously mentioned, our research design is based on a difference-in-differences design. The difference-in-differences design captures the change in the information environment of the treatment group, i.e., comment letter companies, relative to that of the matched control group, i.e., no-comment letter companies. This approach controls for changes that occur for reasons outside our scope of interest, and thus, provides a better measure of the treatment effect of comment letters. To perform difference-in-differences analyses, using propensity score matching, we match each of the comment letter companies to a company that does not receive a comment letter in the same period. A company’s propensity score is the probability of receiving an SEO comment letter conditional on the company’s observable criteria. We estimate each company’s propensity score based on the Equation (1). Table 5 and 6 detail evidence on the propensity score matching. Specifically, Table 5 provides results from estimating Equation (1). The results suggest that Complex (p-value=0.000), AEM (p-value=0.028), M_Weak (p-value=0.000), Restate (p-value=0.000), HVol (p-value=0.098), Age (p-value=0.015), and Loss (p-value=0.035) generally have a significant effect on CommentLetter. The explanatory power of variables is approximately 28%.
Table 5. Propensity-score matching model
Regression model: CommentLetterit = β0 + β1Complexit +β2AEMit+ β3REMit + β4M_Weakit + β5Restateit + β6HVolit + β7lnMCapit + β8Ageit + β9Lossit + β10Zscoreit+ Industry fixed effects + Year fixed effects + εit | |||
|---|---|---|---|
| Independent variable | Exp. sign | Coef | p-value |
| Complex | + | 0.499*** | 0.000 |
| AEM | -3.609** | 0.028 | |
| REM | + | 0.162 | 0.170 |
| M_Weak | + | 2.987*** | 0.000 |
| Restate | + | 3.362*** | 0.000 |
| HVol | + | 0.442* | 0.098 |
| MCap | + | 0.085 | 0.216 |
| Age | + | 0.029** | 0.015 |
| Loss | + | -1.186** | 0.035 |
| Zscore | + | 0.189 | 0.302 |
| Constant | -12.408*** | 29.281 | |
| Industry fixed effects | Yes | ||
| Year fixed effects | Yes | ||
| Observations | 467 | ||
| Pseudo R Square | 28% | ||
*p < 0.10; **p < 0.05; ***p < 0.01.
This table presents the logistic regression results of Equation (1) used for propensity score matching comment letter companies and no-comment letter companies.
The variable CommentLetter is a dichotomous variable coded 1 if the firm received an SEO comment letter in year t, and 0 else. Complex equals 0.4×(average of words per sentence + percent of complex words). AEM is the accrual earnings management computed exactly as in Ball and Shivakumar (2006). REM is the real earnings management computed exactly as in Roychowdhury (2006). M_Weak is a dichotomous variable coded 1 if the audit reports is revealed an internal control weakness in year t and 0 else Restate is a dichotomous variable coded 1 if the company restates its financial statement in year t and 0 else. HVol is a dichotomous variable equals to 1 if the volatility of daily returns for the year is in the quartile four in year t, and 0 else. MCap is the Ln (shares outstanding at × the share price at the end of year). Age is the number of years the company is listed on TSE. Loss is the a dichotomous variable coded 1 if earnings before extraordinary items is negative in year t. Zscore is a dichotomous variable coded 1 if the company’s Altman’s Z score computed exactly as in DeFond and Hung (2003) is higher than median and 0 else.
An important assumption of the difference-in-differences methodology is that shocks contemporaneous with the comment letters affect the treatment and control groups similarly (Johnston and Petacchi, 2017). Table 6 provides evidence on this concern. The table shows that the means for both treatment and matched control groups. Briefly, paired sample t test shows p-values are all bigger than 10% and thus the difference between means are insignificant indicating the effectiveness of matching process. Thus, the concern above is not a significant issue.
Table 6. Test of the difference in means between the matched pairs
| Variable | Comment letter companies | Matched no-comment letter companies | p-value |
|---|---|---|---|
| Complex | 14.882 | 14.630 | 0.157 |
| AEM | 0.001 | -0.015 | 0.143 |
| REM | -0.035 | 0.082 | 0.108 |
| M_Weak | 0.117 | 0.089 | 0.405 |
| Restate | 0.092 | 0.096 | 0.900 |
| HVol | 0.230 | 0.277 | 0.313 |
| MCap | 13.466 | 13.315 | 0.454 |
| Age | 22.847 | 22.523 | 0.474 |
| Loss | 0.096 | 0.126 | 0.372 |
| Zscore | 0.474 | 0.556 | 0.127 |
| Observations | 99 | 99 |
This table presents the results of the paired sample t tests for the matched sample of comment letter companies and no-comment letter companies.
The variable Complex equals 0.4×(average of words per sentence + percent of complex words). AEM is the accrual earnings management computed exactly as in Ball and Shivakumar (2006). REM is the real earnings management computed exactly as in Roychowdhury (2006). M_Weak is a dichotomous variable coded 1 if the audit reports is revealed an internal control weakness in year t and 0 else Restate is a dichotomous variable coded 1 if the company restates its financial statement in year t and 0 else. HVol is a dichotomous variable equals to 1 if the volatility of daily returns for the year is in the quartile four in year t, and 0 else. MCap is the Ln (shares outstanding at × the share price at the end of year). Age is the number of years the company is listed on TSE. Loss is the a dichotomous variable coded 1 if earnings before extraordinary items is negative in year t. Zscore is a dichotomous variable coded 1 if the company’s Altman’s Z score computed exactly as in DeFond and Hung (2003) is higher than median and 0 else.
4.2.1 Test of H1
In this section, we provide test of H1 that predicts companies reduce their complexity following the receipt of an SEO comment letter. For doing this test, we compare the changes in complexity pre- and post-comment letter receipt between the treatment group and control group; and rely on the estimation in Equation (2). Table 7 presents our results. The interaction of Treatment-ControlGroup and Post allows us to determine whether the changes in Complex, following the receipt of a comment letter, are different between the treatment group and the control group. We find a significant (p-value = 0.005) and negative coefficient (-0.895) on Treatment-ControlGroup×Post. This suggests that companies reduce their complexity in the year receiving a comment letter, consistent with our first hypothesis.
The coefficient on Post is negative (-0.302) and relatively significant at 11% (p-value = 0.105), indicating that in the year comment letter receipt, generally complexity is reduced. This reduction may be results of spillover effect of SEO comment letters. To clarify, Brown et al. (2018) show that companies not receiving any comment letter modify their subsequent year’s disclosures largely if the securities commission has commented on the disclosure of a close company. In the section “Supplemental analyses”, we provide relevant empirical evidence on the spillover effect of SEO comment letters. On the control variables, generally, Size, σSale, σCFO, OperCycle, Big, and Inst can statistically explain the complexity. The explanatory power of variables is approximately 8% that is comparable to prior relative studies (For example see Li, 2008; Connelly et al., 2010; Johnston and Petacchi, 2017).
Table 7. Difference-in-differences analysis for complexity
Regression model: Complexi,t = γ0 + γ1 Treatment-ControlGroupi,t + γ2Posti,t + γ3(Treatment-ControlGroup i,t×Posti,t) + ∑φ(Control) + Industry fixed effects + Firm fixed effects + μi,t | |||
|---|---|---|---|
| Independent variable | Exp. sign | Coef | p-value |
| Treatment-ControlGroup | − | 0.244 | 0.258 |
| Post | − | -0.302† | 0.105 |
| Treatment-ControlGroup×Post | − | -0.895*** | 0.005 |
| Size | + | -0.082*** | 0.000 |
| σSale | + | 0.495* | 0.072 |
| σCFO | + | 0.678† | 0.145 |
| NegEarn | + | 0.236 | 0.326 |
| OperCycle | + | 0.196† | 0.147 |
| MTB | + | 0.084 | 0.425 |
| ROA | + | 0.559 | 0.283 |
| HVol | + | -0.103 | 0.306 |
| Age | + | 0.001 | 0.456 |
| Big | − | 0.159** | 0.025 |
| AudTenure | − | 0.000 | 0.498 |
| Inst | + | 0.011*** | 0.002 |
| Constant | 13.716*** | 0.000 | |
| Industry fixed effects | Yes | ||
| Firm fixed effects | Yes | ||
| Observations | 396 | ||
| Adjusted R-squared | 8% | ||
†p < 0.15; *p < 0.10; **p < 0.05; ***p < 0.01
This table shows how comment letter receipt affects complexity. Specifically, this table presents the OLS regression results of Equation (2) using the difference-in-differences research design where each comment letter company is propensity-score matched with a no comment letter company in the same year, and all company years for t+1 are included in the model for both treatment and control groups.
The variable Complex equals Complex equals 0.4×(average of words per sentence + percent of complex words). We set Treatment-ControlGroup equal to 1 for all company-years from the treatment group and Treatment-ControlGroup equal to 0 for all company-years from the control group. Post is coded 1 for both the treatment group and the matched control group in the year following the receipt of a comment letter, and 0 else.
The variable Size is the Ln (total assets). σSale is the standard deviation of sales revenues from year t−4 to year t, divided by the average total assets. CFO is the standard deviation of cash flow from operations from year t−4 to year t, divided by the average total assets. NegEarn is the proportion of losses (negative earnings) for the company over year t−4 to year t. OperCycle is the Ln (the average trade receivables period plus the average stockholding period). MTB is the Market value of equity plus total liabilities divided by total assets. ROA is the Income before extraordinary items divided by total assets. Big is a dichotomous variable coded 1 if the auditor is a big audit firm, and 0 else. AudTenure is the auditor tenure in years. Inst is the percentage of shares owned by institutional investors.
Recent evidence suggests that complexity measures used in the prior literature can be affected by underlying firm performance (Loughran and McDonald, 2016; Guay et al., 2016). Thus, as a sensitivity test, we re-estimate our two primary analyses related to Complex, in Equations (1) and (2), after replacing Complex with Complex _PM, a performance-matched complexity. To construct Complex _PM, we match each Complex with the closest firm-year observation return on assets (ROA) and within the same industry as the benchmark. Further, we also use size and market share as performance-matched benchmarks. Table 8 reports the results. Briefly, the results show that there is a significant (p-value = 0.001; 0.003; 0.018) and negative coefficient (-0.930; -0.0914; -0.871) on Treatment-ControlGroup×Post, for all of performance-matched benchmark, i.e., ROA, Size, and Market share. This suggests that Complex_PM is reduced in the year receiving a comment letter. Thus, after replacing Complex with Complex _PM, these results, similar to the main results, indicate that companies reduce their complexity in the year receiving a comment letter. As such, underlying firm performance does not appear to have a significant influence on the results in our study.
Table 8. Difference-in-differences analysis for performance-matched complexity
Regression model: Complexi,t_PM = γ0 + γ1Treatment-ControlGroupi,t + γ2Posti,t + γ3(Treatment-ControlGroup i,t×Posti,t) + ∑φ(Control) + Industry fixed effects + Firm fixed effects + μi,t | |||||||||
|---|---|---|---|---|---|---|---|---|---|
| Performance-matched benchmark | ROA | Size | Market share | ||||||
| Independent variable |
|
|
|
|
|
|
|
|
|
| Treatment-ControlGroup i,t×Post | − | -0.930*** | 0.001 | − | -0.914*** | 0.003 | − | -0.871** | 0.018 |
| Base variables | Yes | Yes | Yes | ||||||
| Control variables | Yes | Yes | Yes | ||||||
| Constant | Yes | Yes | Yes | ||||||
| Industry fixed effects | Yes | Yes | Yes | ||||||
| Firm fixed effects | Yes | Yes | Yes | ||||||
| Observations | 396 | 396 | 396 | ||||||
| Adjusted R-squared | 7% | 7% | 5% | ||||||
*p < 0.10; **p < 0.05; ***p < 0.01.
This table, similar to table 7, shows how comment letter receipt affects complexity. Specifically, this table presents the OLS regression results of Equation (2) after replacing Complex with Complex _PM, a performance-matched Complex.
To construct Complex _PM, we match each Complex with the closest firm-year observation “ROA/size/market share” within the same industry as a performance-matched criterion. We set Treatment-ControlGroup equal to 1 for all company-years from the treatment group and Treatment-ControlGroup equal to 0 for all company-years from the control group. Post is coded 1 for both the treatment group and the matched control group in the year following the receipt of a comment letter, and 0 else.
Base variables are Treatment-ControlGroup and Post. All of other variables are the same as those in Equation (2) and Table 7 (Difference-in-differences analysis for complexity).
Our theoretical discussion about why we expect that securities commission oversight reduces the complexity, majorly suggests that commission oversight may (1) restrict the opportunistic managerial behavior; and (2) motivate managers to exert greater effort and therefore improve firm performance. In these conditions, managers no longer need to/motivated to complicate the financial reports. In this section, we directly examine the two aforementioned issues, i.e., whether the SEO’s oversight affects (1) the opportunistic managerial behavior and (2) firm performance.
We proxy for the opportunistic managerial behavior with total earnings management (TEM). In this regard, prior recent studies demonstrate that companies can manage earnings using two primary methods including accrual-based earnings management (AEM), such as using “cookie jar” reserves, and real activities-based earnings management (REM), such as the opportunistic timing of discretionary expenses (Connelly et al., 2010). Prior research (e.g., Cohen at al. 2008; Zang 2012) provides evidence of a cost-benefit trade-off between these two primary methods. To capture both of the methods, we measure TEM thought aggregation of AEM and REM by statistical principal components of AEM and REM. Then, to explore the effect of the securities commission oversight on TEM, following Cunningham et al. )2018(, we regress the TEM on independent variables in Equation (2). Table 9 reports the results. The coefficient on Treatment-ControlGroup×Post is negative (-0.247) and significant (p-value = 0.005). Thus, briefly, the results indicate that, as expected and consistent with prior research (e.g., Connelly et al., 2010), managers reduce their misbehavior following the receipt of an SEO comment letter. This finding suggests that securities commission oversight restricts the opportunistic managerial behavior.
Table 9. Difference-in-differences analysis for opportunistic behavior
Regression model: TEMi,t = γ0 + γ1 Treatment-ControlGroupi,t + γ2Posti,t + γ3(Treatment-ControlGroup i,t×Posti,t) + ∑φ(Control) + Industry fixed effects + Firm fixed effects + μi,t | |||
|---|---|---|---|
| Independent variable | Exp. sign | Coef | p-value |
| Treatment-ControlGroup×Post | − | -0.247*** | 0.005 |
| Base variables | Yes | ||
| Control variables | Yes | ||
| Constant | Yes | ||
| Industry fixed effects | Yes | ||
| Firm fixed effects | Yes | ||
| Observations | 396 | ||
| Adjusted R-squared | 12% | ||
†p < 0.15; *p < 0.10; **p < 0.05; ***p < 0.01.
This table shows how comment letter receipt affects earnings management. Specifically, this table presents the OLS regression results of Equation (2) after replacing Complex with TEM, total earnings management.
The variable TEM is the principal component of AEM and REM. AEM is the accrual earnings management computed exactly as in Ball and Shivakumar (2006). REM is the real earnings management computed exactly as in Roychowdhury (2006). We set Treatment-ControlGroup equal to 1 for all company-years from the treatment group and Treatment-ControlGroup equal to 0 for all company-years from the control group. Post is coded 1 for both the treatment group and the matched control group in the year following the receipt of a comment letter, and 0 else.
Base variables are Treatment-ControlGroup and Post. All of other variables are the same as those in Equation (2) and Table 7 (Difference-in-differences analysis for complexity).
We proxy for the firm performance (performance) with managerial ability-score developed in Demerjian et al. (2012).13 This is because the score reflects a portion of firm performance that is affected by managerial effort. Following Demerjian et al. (2012), we use a two-step process to estimate the score. First, using data envelopment analysis, we estimate corporate efficiency by solving an optimization model where sales is the output and there are seven inputs: net property, plant, and equipment; net operating leases; net R&D; purchased goodwill; other tangible assets; cost of inventory; and selling, general and administrative expenses. Second, since the corporate efficiency reflects both firm-level as well as managerial effort, we separate the two by estimating by industry, a regression of corporate efficiency on six firm characteristics that affect corporate efficiency: firm size, firm market share, cash availability, firm age, business segment concentration, and foreign operations. The residual from this regression is our proxy of interest, performance. Finally, to explore the effect of the securities commission oversight on performance, we replace Complex with performance in Equation (2). Table 10 reports the results. The coefficient on Treatment-ControlGroup×Post is not significant (p-value = 0.273). Thus, briefly, the results indicate that the receipt of an SEO comment letter does not influence the firm performance. Notable, the insignificant coefficient is not surprising. This is because, as previously mentioned, on the one hand, comment letter may force managers to exert greater effort in managing the firm and therefore improving firm performance; and on the other hand, comment letter may reduce firm performance if comment letters could result in the release of negative information that managers was withholding (e.g. Kothari, et al., 2009).
Table 10. Difference-in-differences analysis for firm performance
Regression model: Performancei,t = γ0 + γ1 Treatment-ControlGroupi,t + γ2Posti,t + γ3(Treatment-ControlGroup i,t×Posti,t) + ∑φ(Control) + Industry fixed effects + Firm fixed effects + μi,t | |||
|---|---|---|---|
| Independent variable | Exp. sign | Coef | p-value |
| Treatment-ControlGroup×Post | ? | -0.062 | 0.273 |
| Base variables | Yes | ||
| Control variables | Yes | ||
| Constant | Yes | ||
| Industry fixed effects | Yes | ||
| Firm fixed effects | Yes | ||
| Observations | 396 | ||
| Adjusted R-squared | 41% | ||
†p < 0.15; *p < 0.10; **p < 0.05; ***p < 0.01.
This table shows how comment letter receipt affects firm performance. Specifically, this table presents the OLS regression results of Equation (2) after replacing Complex with Performance, firm performance.
The variable Performance is a portion of firm performance that is affected by managerial actions; computed exactly as in Demerjian et al. (2012). We set Treatment-ControlGroup equal to 1 for all company-years from the treatment group and Treatment-ControlGroup equal to 0 for all company-years from the control group. Post is coded 1 for both the treatment group and the matched control group in the year following the receipt of a comment letter, and 0 else.
Base variables are Treatment-ControlGroup and Post. All of other variables are the same as those in Equation (2) and Table 7 (Difference-in-differences analysis for complexity).
Regarding the two analyses above and to provide a more casual analysis about the impact of SEO’s oversight on complexity through the restriction of opportunistic managerial behavior and improving firm performance, we follow Gow et al. (2016) and employ a structural equation modeling approach. Figure 1 presents the structural model.14 Control variables are included in the model but not reported.15 As shown in the model, the path from Treatment-ControlGroup×Post to TEM and also the path from TEM to Complex is significant (p-values = 0.009 & 0.026). In addition, the coefficient in the former path is negative (-0.357) representing that securities commission oversight restricts the opportunistic managerial behavior. Further, the coefficient in the later path (1.902) is positive representing that firms with lower opportunistic managerial behavior have lower complexity. This point is consistent with Lo et al. (2017) who show that firms with higher levels of earnings management have financial reports that are more complex. The path from Treatment-ControlGroup×Post to performance is not significant (p-value= 0.426) that is consistent with previous analysis. Further, the path from performance to Complex is significant (p-value= 0.055) and its coefficient (-0.247) is negative suggesting that better financial performance leads to lower complexity. This finding is comparable to results of Li (2008) showing that the financial reports of firms with lower earnings are more complex. Overall, the model indicates that the association of SEO’s oversight and complexity through the restriction of opportunistic managerial behavior is negative (-0.357×1.902= -0.679) and significant. However, the association of SEO’s oversight and complexity through the changing firm performance is not significant. Thus, the results suggest that securities commission oversight significantly reduces the complexity through restriction of opportunistic managerial behavior.
Figure 1. Causal diagram for the association of securities commission oversight and complexity
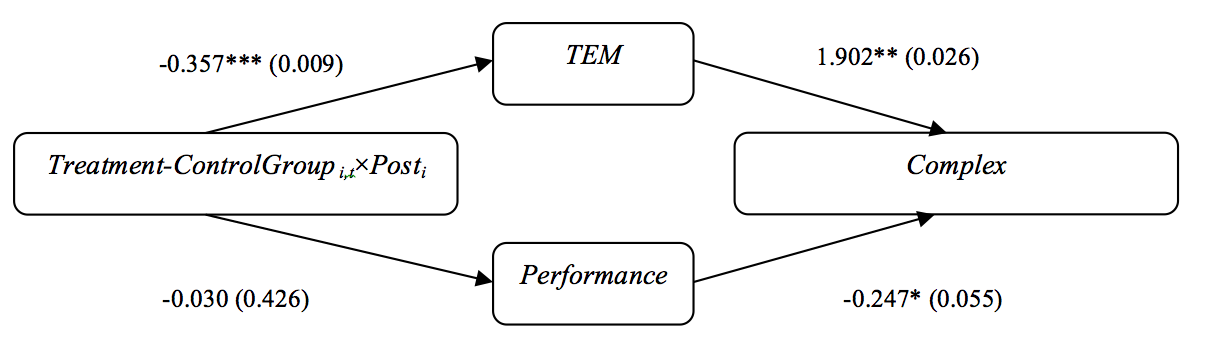
*p < 0.10; **p < 0.05; ***p < 0.01 (parentheses reflect p-values).
This diagram shows the mechanisms underlying the association between securities commission oversight and complexity. Specifically, this diagram shows whether comment letter receipt affects complexity (Complex) through restriction of opportunistic managerial behavior (TEM) and changing firm performance (Performance). Control variables are included in the model but not reported.
We set Treatment-ControlGroup equal to 1 for all company-years from the treatment group and Treatment-ControlGroup equal to 0 for all company-years from the control group. Post is coded 1 for both the treatment group and the matched control group in the year following the receipt of a comment letter, and 0 else. The variable TEM is the principal component of AEM and REM. AEM is the accrual earnings management computed exactly as in Ball and Shivakumar (2006). REM is the real earnings management computed exactly as in Roychowdhury (2006). Performance is a portion of firm performance that is affected by managerial actions computed exactly as in Demerjian et al. (2012). Complex equals 0.4×(average of words per sentence + percent of complex words).
All of other variables are the same as those in Equation (2) and Table 7 (Difference-in-differences analysis for complexity).
4.2.2 Test of H2
Consistent with second hypothesis, we predict that the impact of comment letters on complexity is stronger for firms having higher corporate governance quality. To test this hypothesis, we investigate the impact of corporate governance quality, as captured by the governance index determined following Lopes et al. (2016), on the association of securities commission oversight and complexity. Specifically, as previously mentioned, we estimate Equation (2) in two groups of firm-years: firm-years having low quality corporate governance versus firm-years having high quality corporate governance.
Table 11 reports the results. We find significant coefficients on Treatment-ControlGroup i,t×Post for both firms with high quality corporate governance (p-value=0.002) and firms with low quality corporate governance (p-value=0.011). More importantly, there is significant different between the coefficients on Treatment-ControlGroupt, for full sample (-0.895), firms with high quality corporate governance (-0.960) and firms with low quality corporate governance (-0.704). Statistically, the untabulated F-test for the null hypothesis of no difference in the coefficients on the aforementioned variables indicates that the difference between these coefficients is significant at the 0.01 level. This suggests that the complexity reduction is significantly greater for firms that have high quality corporate governance, as compared to firms that have low quality corporate governance.
Table 11. Difference-in-differences analysis for complexity: Firms with high and low corporate governance quality
Regression model: Complexi,t = γ0 + γ1Treatment-ControlGroupi,t + γ2Posti,t + γ3(Treatment-ControlGroup i,t×Posti,t) + ∑φ(Control) + Industry fixed effects + Firm fixed effects + μi,t | |||||||||
|---|---|---|---|---|---|---|---|---|---|
| Full sample | Firms with high corporate governance quality | Firms with low corporate governance quality | |||||||
| Independent variable |
|
|
|
|
|
|
|
|
|
| Treatment-ControlGroup i,t×Post | − | -0.895*** | 0.005 | − | -0.960*** | 0.002 | − | -0.704** | 0.011 |
| Base variables | Yes | Yes | Yes | ||||||
| Control variables | Yes | Yes | Yes | ||||||
| Constant | Yes | Yes | Yes | ||||||
| Industry fixed effects | Yes | Yes | Yes | ||||||
| Firm fixed effects | Yes | Yes | Yes | ||||||
| Observations | 396 | 198 | 198 | ||||||
| Adjusted R-squared | 8% | 10% | 6% | ||||||
*p < 0.10; **p < 0.05; ***p < 0.01
This table shows the impact of comment letter receipt on complexity for firms with high corporate governance quality and for firms with low corporate governance quality.
The variable Complex equals 0.4×(average of words per sentence + percent of complex words). We set Treatment-ControlGroup equal to 1 for all company-years from the treatment group and Treatment-ControlGroup equal to 0 for all company-years from the control group. Post is coded 1 for both the treatment group and the matched control group in the year following the receipt of a comment letter, and 0 else.
Base variables are Treatment-ControlGroup and Post. All of other variables are the same as those in Equation (2) and Table 7 (Difference-in-differences analysis for complexity).
4.3 Supplemental analyses
In this section, we perform a number of tests to provide greater understanding of association between securities commission oversight and complexity. Specifically, we examine (1) whether the companies’ awareness of increased scrutiny from the SEO is limited to year t; (2) whether complexity reduction for both firms that receive more than one comment letter and firms that only receive one comment letter are the same; (3) whether spillover effect would occur if any industry leader or a close rival received a comment letter. These examinations are as follows.
Theoretically, comment letter companies may anticipate that their next review will occur some years later (Connelly et al., 2010), and therefore we expect to observe no complexity reduction in year t+1 and t+2, for comment letter companies. In this condition, the impact of comment letters on complexity will be limited to just year t. Thus, to determine whether the companies’ awareness of increased scrutiny from the SEO is limited to year t, we re-estimate Equations (1) and (2), after developing appropriate additional variables of CommentLetter, Post and Treatment-ControlGroup for year t-1 and t-2.16 The control variables are the same as those in Equations (1) and (2), respectively, and all variables are as previously defined. Table 12 reports the results. We find significant coefficients on both Treatment-ControlGroupt-1 (p-value=0.005) and Treatment-ControlGroupt-2 (p-value=0.006). Furthermore, there is not significant different between the coefficients on Treatment-ControlGroupt (-0.895), Treatment-ControlGroupt-1 (-0.899) and Treatment-ControlGroupt-2 (-0.886). Statistically, the untabulated F-test for the null hypothesis of no difference in the coefficients on the aforementioned variables indicates that the difference between these coefficients is not significant at the 0.05 level. Collectively, these findings suggest that the comment letters have an immediate impact in year t and the impact persists through at least t+1 and t+2.
Table 12. Difference-in-differences analysis for complexity: Timing of comment letter receipt
Regression model:
| |||||||||
|---|---|---|---|---|---|---|---|---|---|
Regression Model (1) Year t | Regression Model (2) Year t-1 | Regression Model (3) Year t-2 | |||||||
| Independent variable |
|
|
|
|
|
|
|
|
|
| Treatment-ControlGroup i,t×Post | − | -0.895*** | 0.005 | − | -0.899*** | 0.005 | − | -0.886*** | 0.006 |
| Base variables | Yes | Yes | Yes | ||||||
| Control variables | Yes | Yes | Yes | ||||||
| Constant | Yes | Yes | Yes | ||||||
| Industry fixed effects | Yes | Yes | Yes | ||||||
| Firm fixed effects | Yes | Yes | Yes | ||||||
| Observations | 396 | 336 | 284 | ||||||
| Adjusted R-squared | 8% | 8% | 7% | ||||||
This table shows how timing of comment letter receipt affects complexity. Specifically, this table presents the OLS regression results of Equation (2) and also OLS regression results of Equation (2) after replacing Posti,t with Posti,t-1 and Posti,t-2.
The variable Complex equals 0.4×(average of words per sentence + percent of complex words). We set Treatment-ControlGroup equal to 1 for all company-years from the treatment group and Treatment-ControlGroup equal to 0 for all company-years from the control group. Post is coded 1 for both the treatment group and the matched control group in the year following the receipt of a comment letter, and 0 else.
SEO may scrutinize some companies more frequently. Hence, it is important to determine whether complexity reduction for both firms that receive more than one comment letter (repeat-letter firms) and firms that only receive one comment letter (i.e., single-letter firms) are the same. To examine this issue, we re-estimate Equations (1) and (2), after dividing our sample into the repeat-letter firms and the single-letter firms. Table 13 reports the results. We find significant coefficients on Treatment-ControlGroup i,t×Post for both repeat-letter firms (p-value=0.004) and the single-letter firms (p-value=0.005). More importantly, there is not significant different between the coefficients on Treatment-ControlGroupt, for full sample (-0.895), repeat-letter firms (-0.913) and the single-letter firms (-0.891). Statistically, the untabulated F -test for the null hypothesis of no difference in the coefficients on the aforementioned variables indicates that the difference between these coefficients is not significant at the 0.05 level. This suggests that the complexity reduction is not significantly greater for firms that receive multiple comment letters, as compared to firms that only receive one comment letter.
Table 13. Difference-in-differences analysis for complexity: Repeat-letter firms and single-letter firms
Regression model: Complexi,t = γ0 + γ1Treatment-ControlGroupi,t + γ2Posti,t + γ3(Treatment-ControlGroup i,t×Posti,t) + ∑φ(Control) + Industry fixed effects + Firm fixed effects + μi,t | |||||||||
|---|---|---|---|---|---|---|---|---|---|
| Full sample | Repeat-letter firms | Single-letter firms | |||||||
| Independent variable |
|
|
|
|
|
|
|
|
|
| Treatment-ControlGroup i,t×Post | − | -0.895*** | 0.005 | − | -0.913*** | 0.004 | − | -0.891*** | 0.005 |
| Base variables | Yes | Yes | Yes | ||||||
| Control variables | Yes | Yes | Yes | ||||||
| Constant | Yes | Yes | Yes | ||||||
| Industry fixed effects | Yes | Yes | Yes | ||||||
| Firm fixed effects | Yes | Yes | Yes | ||||||
| Observations | 396 | 104 | 292 | ||||||
| Adjusted R-squared | 8% | 6% | 9% | ||||||
*p < 0.10; **p < 0.05; ***p < 0.01.
This table shows the impact of comment letter receipt on complexity for firms that receive more than one comment letter (repeat-letter firms) and firms that only receive one comment letter (i.e., single-letter firms).
The variable Complex equals 0.4×(average of words per sentence + percent of complex words).We set Treatment-ControlGroup equal to 1 for all company-years from the treatment group and Treatment-ControlGroup equal to 0 for all company-years from the control group. Post is coded 1 for both the treatment group and the matched control group in the year following the receipt of a comment letter, and 0 else.
Base variables are Treatment-ControlGroup and Post. All of other variables are the same as those in Equation (2) and Table 7 (Difference-in-differences analysis for complexity).
Theoretically, prior studies (e.g., Bratten et al., 2016; Brown et al., 2018) suggest that no-comment letter firms may pay attention to the comment letter correspondence between the SEO and their industry peers and take a preventive action by improving financial reporting quality. Following the prior studies, we refer to this effect as “spillover effect.” To determine whether in the context of complexity, spillover effect would occur if any industry leader or a close rival received a comment letter, we re-estimate Equations (1) and (2), after developing appropriate additional variables of CommentLetter, Post and Treatment-ControlGroup. To clarify, for example, we exclude comment letter observations and re-structure our sample. Further, here, our treatment group includes no-comment letter firms that their industry leader or close rival received an SEO comment and control group includes propensity-score matched observations.17 In addition, Post is a dichotomous variable set equal to one in the year (and its following years) that the industry leader/close rival received an SEO comment, for both treatment group and matched control group, and zero otherwise. Table 14 reports the results. We find negative significant coefficients on Treatment-ControlGroup i,t×Post for both firms that their industry leader received an SEO comment (-0.105; p-value=0.039) and firms that their close rival received an SEO comment (-0.057; p-value=0.051). These findings suggest that firms not receiving any comment letter reduce their complexity if the securities commission has commented on the industry leader or a close rival, indicating the comment letters have spillover effect in year t. Notable, untabulated findings reveal that the spillover effect persists (does not persist) through year t+1 (t+2).
Table 14. Difference-in-differences analysis for complexity: Spillover effect of securities commission oversight
Regression model: Complexi,t = γ0 + γ1Treatment-ControlGroupi,t + γ2Posti,t + γ3(Treatment-ControlGroup i,t×Posti,t) + ∑φ(Control) + Industry fixed effects + Firm fixed effects + μi,t | |||||||||
|---|---|---|---|---|---|---|---|---|---|
| Main (Full) sample | Spillover effect sample | ||||||||
| Industry leader | Close rival | ||||||||
| Independent variable |
|
|
|
|
|
|
|
|
|
| Treatment-ControlGroup i,t×Post | − | -0.895*** | 0.005 | − | -0.105** | 0.039 | − | -0.057* | 0.051 |
| Base variables | Yes | Yes | Yes | ||||||
| Control variables | Yes | Yes | Yes | ||||||
| Constant | Yes | Yes | Yes | ||||||
| Industry fixed effects | Yes | Yes | Yes | ||||||
| Firm fixed effects | Yes | Yes | Yes | ||||||
| Observations | 396 | 160 | 216 | ||||||
| Adjusted R-squared | 8% | 6% | 8% | ||||||
*p < 0.10; **p < 0.05; ***p < 0.01.
This table shows the spillover effect of securities commission oversight. Spillover effect sample includes no-comment letter firms that their industry leader or close rival received an SEO comment and propensity-score matched observations. Consequently, Treatment-ControlGroup is a dichotomous variable coded 1 for treatment group (no-comment letter firms that their industry leader/close rival received an SEO comment), and 0 for control group (matched no-comment letter observations). Further, Post is a dichotomous variable coded 1 in the year (and its following years) that the industry leader/close rival received an SEO comment, for both treatment group and matched control group, and 0 else. We define the ‘industry leader’ as firms with at least 20% of the market share of sales within their industry in year t and , the ‘close rival’ as firms with the closest total assets within their industry at the end of fiscal year t. The variable Complex equals 0.4×(average of words per sentence + percent of complex words).
Base variables are Treatment-ControlGroup and Post. All of other variables are the same as those in Equation (2) and Table 7 (Difference-in-differences analysis for complexity).
5 Conclusions
In recent years, securities commissions have long voiced concerns about complexity (e.g., Lewis, 2012; Guay et al., 2016). Consequently, they have more closely monitored the managers to reduce the complexity. We investigate whether securities commission oversight reduces the complexity. Consistent with the theoretical predictions indicating that the securities commission oversight restricts the opportunistic managerial behavior (e.g., Bens and Johnston, 2009), we find that securities commission oversight reduces the complexity. Furthermore, we document that the impact of securities commission oversight on the complexity is significantly higher for firms that have higher corporate governance quality.
In addition, we document that the impact of securities commission oversight on the complexity, (1) is not limited to one year and persists through at least two years later; and (2) is not significantly higher for firms that receive more comment letters. These two points suggest that a single comment letter is sufficient in reducing complexity, as opposed to repeated warnings from securities commissions. We further document the spillover effect of securities commission oversight, in the sense that firms not receiving any comment letter reduce their complexity if the securities commission has commented on the industry leader or a close rival. Thus, our results, comparable to Brown et al. (2018), reveal the externalities of securities commission oversight in the context of complexity.
In general, this paper documents a beneficial effect of the securities commissions’ oversight in reducing complexity. Thus, on the one hand, our results provide related evidence for the international debate on whether securities commissions could provide beneficial effects. On the other hand, our results contribute the literature on the complexity and its reducing factors that are among most important issues in the context of international financial reporting.
The results have policy and practical implications. To clarify, for example, as previously mentioned, in developing capital markets, relying on conventional corporate governance mechanisms is not sufficient in reducing different agency conflicts and therefore, it is very essential to find effective mechanisms. In this regard, our findings introduce an effective mechanism — i.e., improving securities commission oversight — to reduce managerial misbehavior and complexity in developing capital markets. In addition, since our results show that the impact of securities commission oversight is higher for firms that have higher corporate governance quality, it seems the securities commissions, boards of directors and capital market participants could increase the effectiveness of securities commission oversight by increasing the corporate governance quality. Moreover, our results indicate that the impact of securities commission oversight on the complexity persists through at least three years and also is not higher for firms that receive more comment letters. Hence, the results provide insights for the concerns about resource constraint— that is a central challenge for securities commissions (e.g., Ege et al., 2018)— and suggest that the securities commissions could mitigate their resource constraints in the current period by delaying the periodic reviews of some firms that received a comment letter over the past year.
This study still has limitations. A major limitation is that this paper uses Fog index to measure securities commission oversight. While the index is the most common measure of complexity and the association of this index and the diverse financial variables are documented in the extensive prior research (Guay et al., 2016; Cassell et al., 2019; Lo et al., 2017; Dyer et al., 2017; Chen et al., 2018; Chychyla et al., 2018), as Loughran and McDonald (2016) discuss, it may contain a significant measurement error. Hence, readers need to exercise some caution when they attempt to use the findings.
Funding
This research did not receive any specific grant from funding agencies in the public, commercial or not-for-profit sectors.
Declaration of interest
The authors declare no conflict of interest.