Social Networks and Dynamic Firm Performance: Evidence from the Taiwanese Semiconductor Industry
ABSTRACT
This study examines the relationship between board interlock and firm performance. Using the Taiwanese semiconductor industry’s dataset from 2013 to 2015, this study uses centrality, structure holes, and the number of interlocking boards as proxies of board interlock. This study also evaluates firm performance over a long-term period through a dynamic data envelopment analysis model. which concluded that board interlock improves dynamic efficiency. Using a directors’ social network analysis, we also identified the top five companies with the best board interlock in terms of centrality, structural holes, and the number of interlocking directors. Overall, this paper is novel in linking board interlock to dynamic efficiency. The study enriches the extant accounting literature regarding the role of directors in influencing firm performance and evaluate firm performance from a multidimensional efficiency perspective.
Keywords: Firm performance; Board interlock; Dynamic efficiency; Directors’ social network analysis.
JEL classification: C14, C23, L25.
Redes sociales y rendimiento dinámico de la empresa: Evidencia de la industria de semiconductores de Taiwán
RESUMEN
Este estudio examina la relación entre la interconexión del consejo directivo y el rendimiento de la empresa. Utilizando datos de la industria de semiconductores de Taiwán de 2013 a 2015, este estudio utiliza la centralidad, los agujeros de la estructura y el número de interconexiones entre consejos directivos como proxies de la interconexión de los consejos directivos. Este estudio también evalúa el rendimiento de la empresa a largo plazo mediante un modelo de análisis envolvente de datos dinámicos. donde se concluye que la interconexión de los directivos mejora la eficiencia dinámica. Utilizando un análisis de la red social de los directivos, también identificamos las cinco mejores empresas con mejor interconexión del consejo directivo en términos de centralidad, agujeros estructurales, y el número de directores interconectados. En general, este trabajo es novedoso en la vinculación de la interconexión de los directivos con la eficiencia dinámica. El estudio enriquece la literatura contable existente sobre el papel de los directivos para influir en el rendimiento de la empresa y evaluar éste desde una perspectiva de eficiencia multidimensional.
Palabras clave: Desempeño de la empresa; Interacción de la junta directiva; Eficiencia dinámica; Análisis de la red social de directores.
Códigos JEL: C14, C23, L25.
1 Introduction
The recent global financial crisis has turned the spotlight again on the contributing factors of firm performance from various perspectives and one of them is corporate governance. Corporate governance, particularly board effectiveness in business organizations, is a contributing factor to financial success. Based on a previous study which discussed regulatory-related social networks for accounting and auditing standards, this paper predicts that directors’ social network or board interlock network1 would benefit firm performance. Social networks, which are applicable to many fields such as business, government, psychology, etc., have been shown to play a significant role in firms. However, there is a lack of studies examining the director’s role in influencing firm performance from the directors’ social network perspective.
This study aims to shed more light on board interlock’s impact on the Taiwanese semiconductor industry’s firm performance. The Taiwanese semiconductor industry provides us with a strong environment for examining directors’ social network. To illustrate, Taiwan’s economic development relies on its interactions with social changes. Taiwan’s economic growth rate, which averaged 11.40% over the period of 2013 to 2015, is better than that of the global average2. During the same time frame, the semiconductor industry, which played a key role in the growth of Taiwan’s economy, achieved an average of 4.63% global growth rate. Since the Taiwanese government developed the Industry Technology Research Institute (ITRI) in 1973 to promote the development of the Taiwanese semiconductor industry, the Taiwanese semiconductor industry has been a key generator of gross domestic product’s growth and the main contributor of export industries. As Taiwan increased its focus on the semiconductor industry, companies acquired tangible and intangible resources in order to enhance their competitiveness through close upstream-downstream relationships, which implies social networks as a universal practice within the semiconductor industry. Tsai, Zhang, and Zhao (2019) documented that social networks can help the semiconductor industry in sharing information and exchange/compete sources in one way or another. This is due to the fact that technology, which is particularly important to the semiconductor industry, is making relationship networks a value-added business asset.
Evaluating a firm’s performance from the accounting perspective is a crucial but complex process (Hopwood, 1972). Selvam et al. (2016) pointed out firm performance indicators from various accounting based angles, such as profitability, growth, and market value. Researchers have diverted their focuses by considering carry-over (a balance sheet item), which is accumulated from one year to another, to measure firm performance. Although the public can judge a firm’s performance by its financial statement and use financial ratios, such as return on assets, to highlight different aspects of performance, financial ratios can hardly provide a holistic view of financial performance. To overcome the problem of financial ratios, we have seen researchers applying data envelopment analysis (DEA), which can simultaneously handle multiple inputs and outputs, to evaluate firm performance. Bowlin (1998) documented two advantages of using the DEA model to measure firm performance. First of all, the DEA model is a robust and flexible methodology for estimating financial interactions between input and output variables. Secondly, the DEA model can readily identify the best firm performance as defined through the input and output variables. However, developments in literature imply that existing traditional DEA methods are limited in reporting firm performance.
On the performance measurement front, this paper applies a dynamic DEA model, which is able to explore efficiency changes over time to solve the problem of existing traditional DEA methods. Specifically, this study employs a dynamic DEA model, called dynamic slacks-based measure (DSBM) to measure firm performance, particularly efficiency over a long-term period in the Taiwanese semiconductor industry. On the board interlock front, following Ferris, Jagannathan, and Pritchard (2003), Zaheer and Bell (2005) and Badar, Hite, and Badir (2013), this study uses centrality, structural holes, and interlocking boards as the proxies of directors’ social network. The first objective of this paper is to examine whether or not board interlock plays a significant role in influencing dynamic efficiency. The second objective is to provide an overall firm network (main network and sub-network) of the Taiwanese semiconductor industry from 2013 to 2015. Moreover, from the overall firm network, we also identify the top 5 companies by centrality, structural holes, and the number of interlocking boards in the Taiwanese semiconductor industry.
This paper contributes to the social networks debate from several dimensions: First of all, no previous research has used centrality, structural holes, and number of interlocking boards together to gauge the level of directors’ social network. This paper shows that these three measures of board interlock results have consistently shown the same positive dynamic efficiency effects of our sample firms. This study thus enriches extant accounting literature regarding the directors’ role in influencing firm performance. Secondly, this research is the first to apply the DEA method in the social network–firm performance nexus. This application suggests that evaluating firm performance from a multidimensional efficiency perspective is beneficial, because the method simultaneously captures multiple financial indicators.
The remainder of this study is structured as follows. Section 2 covers hypotheses development. Section 3 describes our sample selection and research design. Section 4 presents the empirical outcomes including robustness checks. Section 5 concludes this study.
2 Literature Review and Hypotheses Development
2.1 Social Network
A social network is basically about human behavior and other related indexes. Cross, Thomas, and Light (2008) documented that social network is an important intangible asset. A company with good social networks has reputational advantages and a competitive edge, such as: learning development, firm performance, future network, information sharing benefits, access to resources, new product development and innovation, firm efficiency, and firm strategies and policies. A social network also makes a board member’s participation constraint binding, as board members can induce information gap or gather information from other companies. Social networks with strong political connection may boost innovation by facilitating the access to more tangible resources such as government subsidies (Tsai, Zhang, & Zhao, 2019).
2.2 Theoretical Discussion
The resource dependence theory has been widely used in academia to explain how organizations reduce environment interdependence and uncertainty. Based on the resource dependence theory, firms need to interact with other firms for resources that it cannot produce alone. In other words, a firm’s survival is based on its capacity to control the firm’s relationship with other firms to attain necessary resources. This theory reveals that the power of a firm relies on the degree of interdependence. With respect to social networks, if a firm has a controlling influence on its relationship network, it has power. If a firm has control in its social network, it can have information advantage, which is faster access to the latest information and control advantage, which is more central position in resources. To explore the relationship between social network and its effect on firms, we combine centrality, structural holes, and interlocking boards to demonstrate a firm’s social network position. Based on the firm’s position in the network, we could examine howa firm’s social networks structure affects its performance.
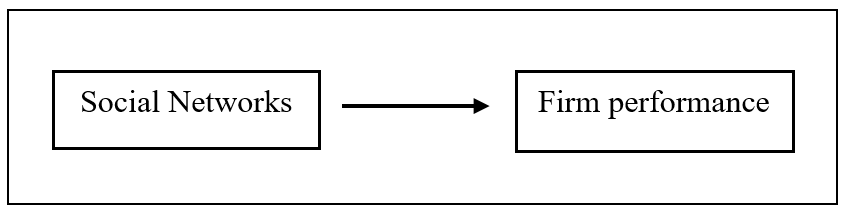
The theoretical framework evaluates social network as antecedents of Taiwanese semiconductor industry’s firm performance. Social network is measured by three indicators, namely centrality (Markóczy, Li Sun, Peng, and Ren (2013), structural holes, and number of interlocking boards (Ferris et al. (2003)). The theoretical framework is shown in Figure 1.
Figure 1. Theoretical framework
2.3 Literature Review
2.3.1 Social Network and DEA
The implication of social networks has long been identified by researchers in different fields. Parkhe, Wasserman, and Ralston (2006) highlighted that “networks are reshaping the global business architecture”. Gulati, Lavie, and Madhavan (2011) further emphasized that good networks and relational capabilities are able to connect firms by engaging and interacting across the global marketplace. Furthermore, Monaghan, Lavelle, and Gunnigle (2017) explained that the complexity of research streams, including economics, mathematics, sociology and industrial psychology, has produced an abundance of perspectives and approaches to social networks analyses.
Typically, social networks are important when discussing human-related matters. The connection of networks represents resource acquisition and information sharing. Additionally, social networks assist firms in evaluating decision-making processes and outcomes. Sparrowe, Liden, Wayne, and Kraimer (2001) and Badar et al. (2013) documented that the hierarchical levels in a social network are important elements to improve firm performance. Social network analysis provides a way for performance improvement, and thus it is important for researchers to identify how these aspects of social networks have a positive impact on firm performance.
Many studies at either the country level or cross-country level applied traditional methods for performance evaluations, which consisted of evaluation errors. The DEA was able to evaluate the performance precisely as it selected more than one variable in measurements. Furthermore, DEA computation provided weights that are useful for ensuring objectivity and provided suggestions for improvement. The application of DEA in the social network analysis is still in its infancy. Therefore, this study attempts to further investigate the relationship between social networks and firm performance with updated data and improved methodology.
2.3.2 Hypotheses Development
Prior studies documented that social networks could either be value-enhancing or value-diminishing. In other words, the results were mixed and did not show a consistent pattern. On one hand, the studies found that social networks and firm performance were positively associated. On the other hand, there was a negative relationship between social networks and firm performance. Hence, there was no clear prediction about the overall social network effect on firm performance. We intend to provide a deeper insight by investigating centrality, structural holes, and interlocking boards together as a social network measure to identify their relationships with Taiwanese semiconductor industry’s firm performance.
2.3.2.1 Centrality and Firm Performance
Freeman, Roeder, and Mulholland (1979) defined the degree of centrality as the total centrality connections to external boards at the first degree. Markóczy et al. (2013) further explained that centrality was the number of other firms that are adjacent to the focal firm within the directors’ interlocking network. Degree centrality can easily measure corporate interlock. However, its drawback is that the actors must have equal corporate interlock networks. Empirical studies on the centrality-firm performance relationship produced mixed results. Cross and Cummings (2004) supported that individual performance in knowledge-intensive works is associated with properties of both networks and ties, including centrality. Their findings confirmed that greater centrality would bring better performance. Similarly, Larcker, So, and Wang (2013) highlighted that well-connected boards (measured by centrality) made the information or resource exchange quicker and faster, thus improving the public traded companies’ performance on the NYSE, AMEX and NASDAQ.
In Pakistan, Badar et al. (2013) broke down centrality into three classical indexes, which are degree, closeness, and betweenness, to examine the association between co-authorship network centrality and academic research performance. The results consistently revealed that a higher degree of centrality in the co-authorship network is significantly and positively related to firm performance. This is in line with Nicholson and Kiel (2004), who confirmed that boardroom centrality provided economic benefits, useful business contacts, and further improved firm value. In addition, Brown, Dai, and Zur (2018) supported that boards with centrality are able to assess better target firm value, due to valuable market and industry-wide information.
On the other hand, Sparrowe et al. (2001) explained that there is a negative relationship between network centralization and firm performance. They further indicated that decentralized networks are more productive than centralized network in communication. Based on the above discussion, this study predicts that when a firm has a higher degree of centrality, it will have a higher firm performance. The hypothesis is developed as:
Hypothesis 1: Firms with higher degree of centrality have better firm performance.
2.3.2.2 Structural Holes and Firm Performance
Burt (1993) defined a structural hole as an important actor among all actors in a network. This idea came from Bonacich (1987) who developed power centrality, which not only measured how many relations an actor had, but also took into account how many connections an actor generated to outsiders. Structural hole existed when there is no redundancy between two contacts. Burt (2005) explained that the more disconnected the contacts were in a network, the more likely the network spans structural holes. Thus, a structural hole connected two people who have no connection with one another, and these two people worked together with different ideas and practices.
Moreover, structural holes provided benefits which allows firms to access information that did not overlap with their information network. Consistently, Ma, Huang, and Shenkar (2011) emphasized that structural holes created new opportunities and enhanced innovativeness. This is supported by Milliken and Martins (1996) who agreed that if a firm’s performance depended on innovativeness, which itself is associated with structural holes, structural holes should be correlated with firm performance. Furthermore, Rodan (2010) documented that managers with structural holes in their networks also have greater freedom to dissemble information. This would increase new knowledge combination, thus enhancing firm performance.
Zaheer and Bell (2005) justified that firms with good network structures will be able to develop internal capabilities, and thus enhance their firm performance. Firms that build network-enabled capabilities contribute to structural holes which would enhance firm performance. Similarly, Arya and Lin (2007) assessed the structural holes and its relationship with firm outcomes. Their study focused on the focal organization and concluded that structural holes brought positive effects on both monetary and nonmonetary outcomes. In accordance with prior studies, our hypothesis is stated as below:
Hypothesis 2: Firms with greater structural holes have better firm performance.
2.3.2.3 Interlocking Boards and Firm Performance
Apart from centrality and structural holes, the number of interlocking boards is another social networks’ main variable. Wong, Gygax, and Wang (2015) defined board interlock as a relationship created between two companies’ boards when they share at least one common director. They further explained that a board interlocking network is a collection of company boards together with all the interlocks that exist among them. A company may benefit from the appointment of a director who hold multiple positions in different boards of directorates. Holding external resources is a crucial determining factor of corporate performance, as interlocking directorates provided a channel for a company to communicate with outside companies. Moreover, past researches have shown positive impact of interlocking directorates on corporate performance.
According to Mizruchi (1996), it is reasonable to assess the capabilities of directors who serve as directors on different boards and how they can act effectively in the interest of every company. Some scholars supported the busyness hypothesis, which discussed the relationship between the number of directors’ interlocks and firm performance. If directors served larger firms and sat on larger boards, they are more likely to attract directorships. Phan et al. (2003) found that the inter-industry board interlock is a tool for resource acquisitions, which has a positive and significant impact on firm performance. The same conclusion is drawn by Yeo, Pochet, and Alcouffe (2003) who found a positive relationship between the number of links and profitability.
On one hand, Ferris et al. (2003) argued that corporate directors would shirk their responsibility if they overcommit on multiple boards. This may decrease firm performance and market value. The result is in line with Jiraporn et al. (2006) who proved that directors’ busyness is negatively related to firm value. Van Van Ees et al. (2003) suggested that directors who have at least two directorships resulted in a negative firm performance effect. Drago et al. (2015) explained that managers hired interlocking directors in order to have a higher degree of freedom, and thus moved away from their fiduciary duties toward shareholders. Companies that relied on interlocking directors had a performance decrease. Therefore, this study attempts to further investigate this relationship between interlocking boards and firm performance for the Taiwanese semiconductor industry. We hypothesize the following:
Hypothesis 3: Firms with greater number of interlocking boards have better firm performance.
3 Data and Model Specification
3.1 Data Collection and Description
The main purpose of this study is to examine the association between social networks and Taiwanese semiconductor industry’s firm performance from 2013 to 2015. All financial data were obtained from the Taiwan Economic Journal (TEJ) database. The initial dataset is comprised of 418 companies in the Taiwanese semiconductor industry. We then screened the data using the following methods: (i) The selected firms have completed 3-year period data from 2013 to 2015. (ii) For the efficiency analysis, we eliminated companies that did not have the required financial input and output data from the TEJ database. Having a balanced panel dataset allows us to have meaningful results, since the DEA approach is a relative measure. Moreover, data related to social networks are collected by hand from the annual report. (iii) We refer to a company’s annual report to identify the number of other firms that are adjacent to the focal firm within the directors’ interlocking network and the number of directorships held by a firm’s board members and CEO. After using the above three methods to screen the sample database, this study has a final sample of 381 Taiwanese semiconductor firms.
3.2 Dependent Variable
3.2.1 Dynamic production process of a company
In the business world, accounting periods which continue for more than one year is known as “long-term” in accounting. This study employs a dynamic DEA to measure long-term firm performance, taking into consideration the dynamic production process of a semiconductor company. Figure 2 illustrates the dynamic production process, whereby each term t is an operating year. To capture the dynamic production process, this study includes a carry-over variable, viz. fixed assets, in addition to typical input and output variables. Specifically, fixed assets is a permanent account that is accumulated and used throughout accounting periods. This carry-over concept is also in line with the going-concern argument, which suggested that a company will exist forever. As a comparison, cost of goods sold is a temporary account that is written off at the end of an operating year and recalculated in a new operating year.
Figure 2. The dynamic production process of a semiconductor company
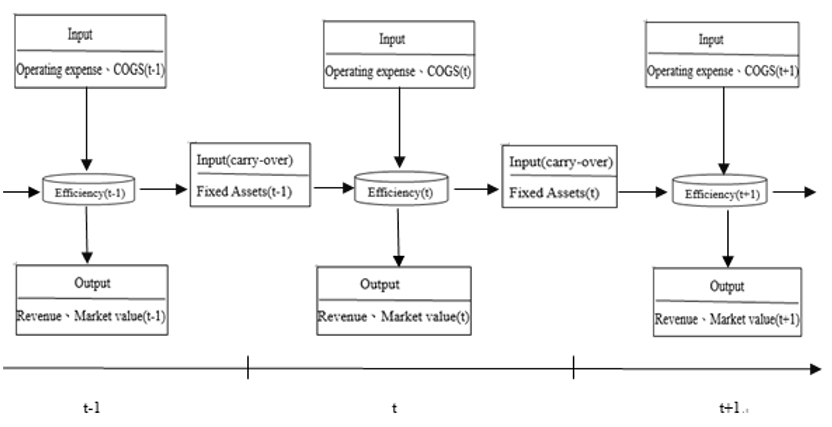
Figure 2 shows that the input variables are cost of goods sold and operating expenses, while the output variables are revenue and market value. The input carry-over variable in Figure 2 is fixed assets. It is important to note the accounting concept of the manufacturing process. During an accounting year, a semiconductor company incurs (i) manufacturing cost, which is recognized as cost of goods sold and (ii) nonmanufacturing cost, which is recognized as operating expenses on its income statement. The semiconductor company generates (i) sales or revenue, which is an accounting-based measure of firm performance and (ii) market value, which is a market-based measure of firm performance. Furthermore, our selection of the input and output variables are in line with prior studies. The variables are explained in Table 1.
Table 1. Definition of input and output variables in the dynamic DEA model
| Variables | Description |
|---|---|
| Input variables | |
| Fixed Assets (FAt-1) | The sum of land, property, equipment, etc. in the previous year. |
| Cost of Goods Sold (COGS) | Cost of sales less depreciation, amortization and research and development expenses. |
| Operating Expenses (OE) | The sum of administrative expenses, advertising expenses, and research and development expenses. |
| Output variables | |
| Revenue (Rev) | The gross income made by all divisions of the firm. |
| Market Value (MV) | The multiplication of the market price per share and the total number of common shares. |
3.2.2 Efficiency evaluation-dynamic DEA approach
This study applies the dynamic DEA model of Tone and Tsutsui (2010). The dynamic DEA model, which considers the carry-over concept, has advantages over traditional DEA models. Specifically, the dynamic DEA model is able to assess long-term efficiencies by taking into account desirable (good) links and undesirable (bad) links. In this study, the undesirable links or input carry-over are carried from one term to another.
The dynamic DEA model deals with \(n\) firms (\({j=1,...n}\)) over \(T\) terms (\({t=1,...,T}\)). At each term, firms have \(m\) common inputs (\({i=1,...,m}\)) and \(S\) common outputs (\({r=1,...,s}\)). Let \({x_{ijt}}\) and \({y_{rjt}}\) denote the input and output values of \({firm_{j}}\) at term \({t}\), respectively. This study denotes the carry-over variables as \({z_{hjt}(h=1,...nbad)}\), \({s^{-}_{it}}\), \({s^{+}_{rt}}\), and \({s^{bad}_{ht}}\) are slack variables denoting, respectively, input excess, output shortfall, and link excess (Tone, 2001).
A non-oriented overall dynamic efficiency (ODE) of the target \({firm_{o}\ (o=1,...,n)}\) can be derived by solving the following:
\[\begin{equation}\label{eq1} ODE_{o} = min \frac{(1/T)\sum^{T}_{t=1} \left [ 1- \left ( 1/(m+nbad) \right ) \left ( \sum^{m}_{i=1} (s^{-}_{it}/x_{iot}) + \sum^{nbad}_{h=1}(s^{bad}_{ht}/z_{hot} \right ) \right ] } {(1/T)\sum^{T}_{t=1} \left [ 1+(1/s)\sum^{S}_{r=1} \left ( s^{+}_{rt}/y_{rot} \right ) \right ] } \end{equation} \ \ \ (1)\]
\[\begin{equation}\label{eq2} x_{iot} = \sum_{j=1}\nolimits^{n} x_{ijt} \lambda^{t}_{j} + s^{-}_{it} (i=1,...,m;j=1,...,n;t=1,...,T), \end{equation} \ \ \ (2)\] \[\begin{equation}\label{eq3} y_{rot} = \sum_{j=1}\nolimits^{n} y_{rjt} \lambda^{t}_{j} + s^{+}_{rt} (r=1,...,s;j=1,...,n;t=1,...,T), \end{equation} \ \ \ (3)\] \[\begin{equation}\label{eq4} z_{hot} = \sum_{j=1}\nolimits^{n} z_{hjt} \lambda^{t}_{j} + s^{bad}_{ht} ( h=1,...,nbad;j=1,...,n; \end{equation} \ \ \ (4)\] \[\begin{equation}\label{eq5} \sum_{j=1}\nolimits^{n} \lambda^{t}_{j} = 1 (t=1,...,T), \end{equation} \ \ \ (5)\] \[\begin{equation}\label{eq6} \sum_{j=1}\nolimits^{n} z_{hjt} \lambda^{t}_{j} = \sum_{j=1}^{n} z_{hjt} \lambda^{t+1}_{j}\ (\forall h;t=1,...,T-1), \end{equation} \ \ \ (6)\]
\[\begin{equation*} \lambda^{t}_{j} \geq 0,\ s^{-}_{it} \geq 0,\ s^{+}_{rt} \geq 0,\ s^{bad}_{ht} \geq 0. \end{equation*}\]
The constraint (6) is critical for the dynamic model, since it connects term \({t}\) and term \({t+1}\) activities. The constraint (5) assumes the variable returns-to-scale for production. That is, the production frontiers are spanned by the convex hull of the existing firms. The constraints (2) and (3) are the input and output constraints. The constraint (4) is the carry-over constraint. The production possibility set for the objective \({firm_{o}\ (o=1,...,n)}\) is expressed by (2), (3), (4), (5) and (6).
Let an optimal solution (1) subject to (2), (3), (4), (5) and (6) be \[\begin{equation*} \{ \lambda^{t^*}_{j},\ j=1,2,..,n; \ s^{-^*}_{it},i=1,...,m;\ s^{+^*}_{rt},r=1,...,s; s^{bad^*}_{ht}, h=1,...,nbad,t=1,...,T \} \end{equation*}\]
The present study derives the overall dynamic efficiency (ODE), which ranges from zero to unity, by solving the non-oriented function in terms of T for the objective \({firm_{o}}\) as follows:
\[\begin{equation}\label{eq7} ODE_{o}^* = \frac{(1/T)\sum^{T}_{t=1} \left [ 1- \left ( 1/(m+nbad) \right ) \left ( \sum^{m}_{i=1} (s^{-^*}_{it}/x_{iot}) + \sum^{nbad}_{h=1}(s^{bad^*}_{ht}/z_{hot} \right ) \right ] } {(1/T)\sum^{T}_{t=1} \left [ 1+(1/s)\sum^{S}_{r=1} \left ( s^{+^*}_{rt}/y_{rot} \right ) \right ] } \end{equation} \ \ \ (7)\]
The non-oriented overall dynamic term efficiency for the objective \(firm_{o}\) at time \(t\) can be defined by:
\[\begin{equation}\label{eq8} ODE_{o}^* = \frac{ 1- \left ( 1/(m+nbad) \right ) \left ( \sum^{m}_{i=1} (s^{-^*}_{it}/x_{iot}) + \sum^{nbad}_{h=1}(s^{bad^*}_{ht}/z_{hot} \right ) } {1+(1/s)\sum^{S}_{r=1} \left ( s^{+^*}_{rt}/y_{rot} \right ) }, \quad (t=1,...,T) \end{equation} \ \ \ (8)\]
The non-oriented dynamic DEA model under variable returns to scale evaluates the non-oriented overall dynamic efficiency of the observed firm by solving the above fractional program. The fractional program can be transformed into LPs. See Tone (2001) for detailed discussions.
3.3 Independent Variables
3.3.1 Centrality
Centrality is defined as the number of other firms that are adjacent to the focal firm within the directors’ interlocking network. Following Markóczy et al. (2013), we measure the degree of centrality as follows:
\[\begin{equation*} C_{D}(P_{K})= \sum_{i=1}^{m}a(p_{i},p_{k}) \end{equation*}\]
The degree of centrality \(C_{D}(P_{K})\) for an actor is equal to the number of ties and the actor is \(P_{K}\) adjacent to all other actors within the network. \(a(p_{i},p_{k})=1\) if and only if an actor and another actor are connected by a line, and 0 otherwise.
3.3.2 Structural holes (SH)
SH exists when there is no redundancy between two contacts. Following Burt (2004), we measure structural holes as follows:
\[\begin{equation*} C_{i,j} = \left [ P_{i,j} + \sum\nolimits_{q} P_{j,q} P_{q,j} \right ]^{2} \, q \neq i,j \end{equation*}\]
\(C_{i,j}\): The score of is limited by.
\(P_{i,j}\): The connection of to the connection of .
\(P_{j,q}\): The percentage of connecting to others.
\(P_{q,j}\): The percentage of all others connecting to.
3.3.3 Number of interlocking boards (InNo)
This variable is defined as the maximum number of directorships held by a firm’s board members and executives (CEO). There are several different measures of interlocking boards numbers. To match firm-level data for the Taiwanese semiconductor industry, this study follows Ferris et al. (2003) by combining two measures of multiple directorships. The first measure is the maximum number of directorships held by any of a firm’s board members, while the second measure is the maximum number of directorships held by any executive (usually the CEO) of the firm.
3.4 Control Variables
In addition, this study also controls for firm characteristics based on previous studies to enhance our regression models. As documented by Strandskov (2006) “firm specific advantages” comprised of explanatory variables with the strongest effects on business strategy and performance. Therefore, in this study three control variables are included in the multiple regression models to account for the impact of social networks on dynamic firm performance. They are leverage, sales growth, and firm size, all of which are explained below:
Leverage (LER). Leverage represents the gearing level of a firm. Following Maury (2006), we measure LER as the ratio of total debt to total assets.
Sales growth (SG). Sales growth represents the firm’s opportunity in generating revenue. Following Doyle and Wong (1998), we calculate sales growth as the ratio of current year sales to previous year sales.
Firm size (Size). Companies with bigger size have more operational advantage. Following Ting and Lean (2011), we measure size as the number of sales.
4 Empirical Findings and Discussion
4.1 First Stage – Efficiency Analysis
4.1.1 Descriptive statistics – Input and output variables
Table 2 shows the descriptive statistics of the DEA variables used. On average, the input variables (cost of goods sold and operating expenses) and carry-over variable (fixed assets) have increased from 2013 to 2015. In terms of the output variables during the observation period, while revenue had a positive growth rate, market value decreased significantly. Moreover, all the variables show substantial disparity in the Taiwanese semiconductor industry, which indicates the need to for simultaneous examination.
Table 2. Descriptive statistics of the DEA variables
| Mean | Sth. Dev. | Median | Max | |
|---|---|---|---|---|
| Panel A: Year 2013 | ||||
| FAt-1 | 11,230 | 57,941 | 372 | 617,529 |
| COGS | 10,246 | 34,123 | 1,824 | 316,058 |
| OE | 2,056 | 7,441 | 413 | 71,516 |
| Rev | 14,973 | 58,540 | 2,504 | 597,024 |
| MV | 8867 | 33,983 | 1,156 | 259,286 |
| Panel B: Year 2014 | ||||
| FAt-1 | 12,592 | 72,769 | 453 | 792,666 |
| COGS | 11,559 | 40,869 | 2,037 | 385,113 |
| OE | 2,426 | 9,208 | 417 | 81,852 |
| Rev | 18,112 | 74,601 | 2,669 | 762,806 |
| MV | 7,271 | 27,154 | 1,088 | 259,297 |
| Panel C: Year 2015 | ||||
| FAt-1 | 13,256 | 75,382 | 453 | 818,199 |
| COGS | 12,195 | 45,799 | 1,868 | 433,118 |
| OE | 12,186 | 45,801 | 1,868 | 433,118 |
| Rev | 18,641 | 81,642 | 2,472 | 843,497 |
| MV | 7,255 | 27,178 | 1,054 | 259,304 |
Note: *, **, *** Significantly different from zero at the β = 0.1, 0.05, 0.01 level, respectively (Two-tailed). FAt-1: The sum of land, property, equipment, etc. in the previous year). COGS: Cost of sales less depreciation, amortization and research and development expenses. OE: The sum of administrative expenses, advertising expenses, and research and development expenses. Rev: The gross income made by all divisions of the firm. MV: The multiplication of the market price per share and the total number of common shares.
4.1.2 Correlation analysis – Input and output variables
The Pearson correlation analysis of the input and output variables used in the DEA process is shown in Table 3. All the reported coefficients are overall significantly positive, indicating that the DEA variables are highly correlated among each other. More importantly, the results support the use of the variables for our dynamic DEA model.
Table 3. Pearson correlation coefficients for inputs and outputs
| FAt-1 | COGS | OE | Rev | MV | |
|---|---|---|---|---|---|
| FAt-1 | 1 | ||||
| COGS | 0.926*** | 1 | |||
| OE | 0.723*** | 0.797*** | 1 | ||
| Rev | 0.962*** | 0.983*** | 0.791*** | 1 | |
| MV | 0.880*** | 0.856*** | 0.621*** | 0.851*** | 1 |
>Note: *, **, *** Significantly different from zero at the β = 0.1, 0.05, 0.01 level, respectively (Two-tailed). FAt-1: The sum of land, property, equipment, etc. in the previous year). COGS: Cost of sales less depreciation, amortization and research and development expenses. OE: The sum of administrative expenses, advertising expenses, and research and development expenses. Rev: The gross income made by all divisions of the firm. MV: The multiplication of the market price per share and the total number of common shares.
4.1.3 Test of differences – Input and output variables
Table 4 shows the mean efficiency scores of all sample semiconductor companies and by sub-industries over the period of 2013 to 2015. In this study, we divide the semiconductor companies into three categories: (i) integrated circuit, (ii) packaging and testing, and (iii) others. Over the sample period, the average efficiency scores of the total sample are 0.508, 0.499 and 0.355, respectively. The mean efficiency scores of all semiconductor companies gradually declined from 2013 to 2015. Consistently, the mean efficiency scores of sample companies producing integrated circuit are 0.543, 0.535 and 0.393. Similarly, companies producing packaging and testing semiconductor products, and those producing others also experienced decreases of 41% and 44% in their efficiency levels, respectively. In addition, the Kruskal-Wallis tests in the Panel B of Table 4 indicate that there are significant differences with p-values less than 0.1 in the mean efficiency scores among the three categories of the Taiwanese semiconductor industry throughout the observation period.
Table 4. Test of differences for efficiency scores
| Industry | 2013* | 2014* | 2015* | Total* | ||||
|---|---|---|---|---|---|---|---|---|
| Panel A | ||||||||
| Total sample (Mean) | 0.508* | 0.499* | 0.355* | 0.454* | ||||
| Panel B | ||||||||
| Integrated circuit (Mean) | 0.543* | 0.535* | 0.393* | 0.490* | ||||
| Packaging and Testing (Mean) | 0.423* | 0.407* | 0.250* | 0.360* | ||||
| Others (Mean) | 0.309* | 0.319* | 0.174* | 0.267* | ||||
| Kruskal-Wallis test (p-value) | <0.001* | <0.001* | <0.000* | <0.000* | ||||
Note: *Statistically significant at 0.1 level.
4.2 Second Stage – Regression Analysis
4.2.1 Regression Model
In a DEA-application study involving multivariate analysis to find the effects of basic factors on firm performance, the use of ordinary least squares (OLS) is an appropriate method Banker and Natarajan (2008). According to Banker and Natarajan (2008), consistent estimators of the regression coefficients could be obtained through OLS even though efficiency scores ranged between zero and one. McDonald (2009) argued that OLS was better than Tobit regression. Comparing truncated regression and bootstrap to OLS, Banker, Natarajan, and Zhang (2019) also concluded that OLS is a better estimation method following DEA analysis, because of its lower mean absolute deviation and median absolute deviation. Therefore, after using the DEA modeling in the first stage to obtain the firm efficiency value, this study employs OLS to explore the relationship between social networks and dynamic firm performance. This choice is also in line with prior studies, such as Wang et al. (2014). To examine the impacts of centrality, structural holes and number of interlocking boards on dynamic firm performance, we establish Equations , and , respectively, as follows:
\[\begin{equation}\label{eq9} Efficiency_{i,t} = \ \beta_{0} + \beta_{1}Centrality_{i,t} + \beta_{2}LER_{i,t} + \beta_{3}SG_{i,t} + \beta_{4}Size_{i,t} + \varepsilon_{i,t} \end{equation}\ \ \ (9)\] \[\begin{equation}\label{eq10} Efficiency_{i,t} =\ \beta_{0} + \beta_{1}SH_{i,t} + \beta_{2}LER_{i,t} + \beta_{3}SG_{i,t} + \beta_{4}Size_{i,t} + \varepsilon_{i,t} \end{equation}\ \ \ (10)\] \[\begin{equation}\label{eq11} Efficiency_{i,t} =\ \beta_{0} + \beta_{1}InNo_{i,t} + \beta_{2}LER_{i,t} + \beta_{3}SG_{i,t} + \beta_{4}Size_{i,t} + \varepsilon_{i,t} \end{equation}\ \ \ (11)\]
where \(\beta_{0}\) is the intercept, while \(\varepsilon_{i,t}\) represents the error terms. Efficiency is the efficiency score derived from the dynamic DEA model. \(Centrality_{i,t}\) is the degree of firm \(i\)’s social networks in year \(t\). \(SH_{i,t}\) is firm \(i\)’s structural holes in year \(t\). \(InNo_{i,t}\) is logged number of firm \(i\)’s interlocking boards in year \(t\). \(LER_{i,t}\) is total liability to total equity of firm \(i\) in year \(t\). \(SG_{i,t}\) is the sales this year to sales previous year of firm \(i\) in year \(t\). \(Size\) is calculated based on log of the sales of firm \(i\) in year \(t\).
4.2.2 Descriptive statistics – Explanatory variables
Table 5 presents the descriptive statistics of the explanatory variables used in the regression analysis. The results show that the centrality, structural holes, and number of interlocking boards were at an average increasing trend. Meanwhile, the sample leverage dropped from 2013 to 2014 and then increased in 2015. The results on sales growth show a monotonic decrease over the three-year period. Meanwhile, the mean values of firm size (7.590, 6.240 and 6.442) indicate that total sales of the sample companies decreased and then increased during the observation period.
Table 5. Descriptive statistics of the explanatory variables
| Mean | Sth. Dev. | Median | Max | |
|---|---|---|---|---|
| Panel A: Year 2013 | ||||
| Centrality | 1.093 | 1.435 | 1.000 | 6.000 |
| SH | 1.154 | 1.550 | 1.000 | 6.750 |
| InNo | 1.100 | 1.464 | 1.000 | 7.000 |
| LER | 0.482 | 0.924 | 0.344 | 5.408 |
| SG | 73.131 | 190.275 | -3.840 | 1,075.310 |
| Size | 7.590 | 1.246 | 6.321 | 8.926 |
| Panel B: Year 2014 | ||||
| Centrality | 1.183 | 1.478 | 1.000 | 6.000 |
| SH | 1.322 | 1.655 | 1.000 | 7.045 |
| InNo | 1.214 | 1.579 | 1.000 | 7.000 |
| LER | 0.442 | 0.822 | 0.344 | 5.408 |
| SG | 55.522 | 164.638 | -4.730 | 1,075.310 |
| Size | 6.240 | 0.891 | 6.338 | 8.926 |
| Panel C: Year 2015 | ||||
| Centrality | 1.339 | 1.560 | 1.000 | 8.000 |
| SH | 1.703 | 1.647 | 1.000 | 7.375 |
| InNo | 1.496 | 1.479 | 1.000 | 7.000 |
| LER | 0.559 | 0.711 | 0.356 | 5.418 |
| SG | 14.159 | 134.573 | -4.640 | 1,075.310 |
| Size | 6.442 | 0.772 | 6.393 | 8.926 |
Note: The unit for variables is thousand NT dollars. Efficiency represents firm performance in terms of the efficiency value calculated from the DEA model’s score. Centrality is the degree of centrality for a firm’s interlock network by using the command Network Centrality Degree in UCIENT6. It is estimated by counting the number of other firms that arc adjacent to the focal firm within the director interlocks network. SH acts as a constraint using the command Network Effsize in UCIENT6. InNo is measured as the maximum number of directorships held by any one member of a firm’s board and any CEO of the firm. LER is total liability to total equity of firm in year . SG is the sales this year to sales previous year of firm in year . Size is calculated based on log of the sales of firm in year.
4.2.3 Correlation analysis – Explanatory variables
The Pearson correlation test is consistently applied to examine the relationship among the explanatory variables. The results of the correlation analysis are shown in Table 6. The results reveal that the three main testing variables: Centrality, SH, and InNo are positively correlated with efficiency. However, the coefficient of InNo is not significant at the conventional level. Besides, no multicolinearity problem is noticed as the other correlation coefficients are all less than 0.4. The significantly high correlation coefficients among the three social network measures support our regression models building, in which we perform three separate regression analyses one at a time.
Table 6. Pearson correlation analysis – explanatory variables and efficiency
| Efficiency | Centrality | SH | InNo | LER | SG | Size | |
|---|---|---|---|---|---|---|---|
| Efficiency | 1 | ||||||
| Centrality | 0.123** | 1 | |||||
| SH | 0.094* | 0.866*** | 1 | ||||
| InNo | 0.068 | 0.620*** | 0.799*** | 1 | |||
| LER | -0.091* | -0.056 | -0.066 | -0.067 | 1 | ||
| SG | 0.100* | -0.010 | -0.041 | -0.008 | 0.007 | 1 | |
| Size | -0.001 | 0.306*** | 0.290*** | 0.211*** | -0.065 | 0.012 | 1 |
Note: *, **, *** Significantly different from zero at the = 0.1, 0.05, 0.01 level, respectively (Two-tailed). Efficiency represents dynamic firm performance in terms of the efficiency value calculated from the DEA model. Centrality is the degree of centrality for a firm’s interlock network by using the command Network Centrality Degree in UCIENT6. It is estimated by counting the number of other firms that arc adjacent to the focal firm within the director interlocking network. SH acts as a constraint using the command Network Effsize in UCIENT6. InNo is measured as the maximum number of directorships held by any one member of a firm’s board and any CEO of the firm. LER is the ratio of total liability to total equity of firm in year . SG the ratio of the sales of this year to the sales of last year of firm in year . Size is calculated based on log of the sales of firm in year .
4.2.4 Regression Analysis
Table 7 presents the regression results of pooled OLS. The empirical evidence of Model 1 depicts a significantly positive relationship between the degree of centrality and dynamic firm performance (Centrality:\(\beta\)=0.025, p-value=0.006). The finding is consistent with prior studies, which showed that a higher degree of centrality would bring higher relations and ultimately improved firm performance. Marsden (2002) highlighted that centrality is the most applicable element in social network as centrality helps firms to form direct ties with other firms, particularly in easily obtaining critical resources. In other words, firms with higher centrality were able to get various resources through their social networks, resulting in better performance .
Table 7. Regression Analysis
| Model 1 | Model 2 | Model 3 | |
|---|---|---|---|
| Coefficient | Coefficient | Coefficient | |
| Intercept | 0.543*** | 0.521*** | 0.496*** |
| Centrality | 0.025*** | ||
| SH | 0.017** | ||
| InNo | 0.012* | ||
| LER | -0.015* | -0.015* | -0.017** |
| SG | 0.000** | 0.000** | 0.000** |
| Size | -0.018 | -0.014* | -0.008 |
| R-squared | 0.035 | 0.028 | 0.023 |
| Adj. R-squared | 0.024 | 0.018 | 0.012 |
| Standard error | 0.270 | 0.271 | 0.272 |
Note: *, **, *** Significantly different from zero at the =0.1, 0.05, 0.01 level, respectively (Two-tailed). Efficiency represents dynamic firm performance in terms of the efficiency value calculated from the DEA model. Centrality is the degree of centrality for a firm’s interlock network by using the command Network Centrality Degree in UCIENT6. It is estimated by counting the number of other firms that arc adjacent to the focal firm within the director interlocking network. SH acts as a constraint using the command Network Effsize in UCIENT6. InNo is measured as the maximum number of directorships held by any one member of a firm’s board and any CEO of the firm. LER is the ratio of total liability to total equity of firm in year . SG the ratio of the sales of this year to the sales of last year of firm in year . Size is calculated based on log of the sales of firm in year .
From the structural holes perspective, the empirical evidences of Model 2 also depict a significantly positive relationship between structural holes and dynamic firm performance at the 5 per cent significance level (SH:\(\beta\)=0.017, p-value=0.026). Our findings are in line with those of Zaheer and Bell (2005) and Arya and Lin (2007) who find that the higher the structural holes, the higher the firm performance. Structural holes brings additional access resources, opportunities and threats. Structural holes are an important characteristic of social networks as it defines the communications element. The structural holes represent a blank space among clusters. As time goes on, the gap may become more obvious, meaning that fewer companies can get information to make more profit. In other words, if fewer firms occupied the network, those in the loop are able to control and constrain other firms for their own benefits. However, a company that is not well connected to others still has a chance to obtain competitive advantages by occupying key position(s) in the network.
In terms of interlocking boards numbers, we found that model 3 also shows a significantly positive coefficient between the number of interlocking boards and dynamic firm performance (InNo= 0.012, p-value = 0.098). This implies that the directors who hold more than one directorship in different companies may bring better reputational capital and greater experience diversity for the Taiwanese semiconductor industry. In other words, interlocking directorates does improve firm performance.
4.3 Social Network Analysis
4.3.1 Main network and sub-network of the Taiwanese semiconductor industry
A good social network is able to help companies manage their suppliers and buyers well. Tsai and Wang (2001) pointed out that a good social network enabled companies to acquire new knowledge and develop new products. Moreover, social networks have been proven to be a good mechanism for building reputational advantages and creating a competitive edge, particularly in terms of corporate strategies and policies. Although findings in this study are supported by regression analysis, we further conducted a social network analysis.
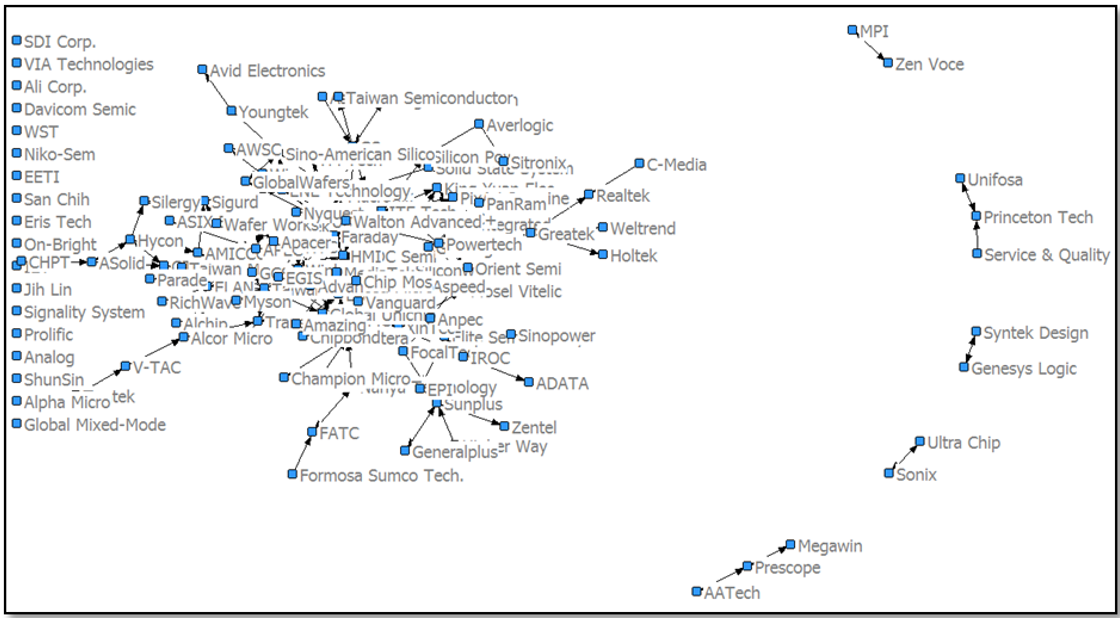
Figure 3 depicts the mapping and measuring of companies’ social structures in the Taiwanese semiconductor industry from 2013 to2015, after accounting for Centrality, SH, and InNo. To illustrate, square points in Figure 3 represent the sample companies and the lines linking them represent relations. The left side of the diagram indicates companies with no social network (independent network), while the right side of the diagram shows companies with a low degree of social network (subnetwork). The middle part is the main network consisting of majority companies. These companies have multiple and overlapping social network.3
Figure 3. Social networks of the Taiwanese semiconductor industry for 2013-2015
4.3.2 The top 5 Taiwanese semiconductor companies in social networks
To analyze the visual data more precisely, accurately, and scientifically according to the social network indexes, we further prepare Table 8 to show only the top 5 companies by centrality, structural holes, and the number of interlocking boards in the Taiwanese semiconductor industry. Different companies are found to have different strength in terms of social networks. Among all, ITE Tech. Inc. is the only one company which is listed on the three measures.
Table 8. The top 5 companies by centrality, structural holes and the number of directors
| No | Centrality | Structural hole | The number of directors |
|---|---|---|---|
| 1 | ITE Tech. Inc. | Winbond | Winbond |
| 2 | Global Communication Semiconductors, LLC | Global Communication Semiconductors, LLC | ITE Tech. Inc. |
| 3 | Walton Advanced Engineering, Inc. | United Microelectronics Corporation | Silicon Integrated Systems |
| 4 | Faraday Technology Inc. | Walton Advanced Engineering, Inc. | International Semiconductor Corporation |
| 5 | Global Unichip Corp. | ITE Tech. Inc. | United Microelectronics Corporation |
4.4 Findings Discussion
There are 3 main hypotheses developed to test the effects of social networks and firm leverage decision. Based on the findings, firms with higher degrees of centrality tend to have better performance. This supports hypothesis H1 by explaining the positive centrality-performance relationship, where on average firms experiences better performance from having a relatively well-connected board. Having a higher degree of centrality allows firms to leverage social relationships and reduce asymmetric information when developing business opportunities. Furthermore, the centrality of boards represents a way of communication or resources exchange among closely linked companies which would bring accounting benefits to the companies involved. The results are in line with those of Cross and Cummings (2004) and Larcker et al. (2013) who confirmed that greater centrality would bring about better performance. Moreover, centrality provided economic and social benefits and further improved firm performance.
Findings from this study also support the hypothesized relationship (H2) between structural holes and firm performance. Based on the results in Table 7, firms with greater structural holes have better firm performance. This implies that a firm’s structural hole position creates new opportunities and enhance innovativeness, as there will be no overlapping information when there is no redundancy between two contacts. The new innovative ideas enhance Taiwanese semiconductor industry’s firm performance. Our findings are consistent with the study of Milliken and Martins (1996), Rodan (2010) and Ma et al. (2011) who argued that structural holes created new opportunities, new knowledge, enhanced innovativeness and thus enhanced performance.
The study also supports the hypothesized relationship (H3) between number of interlocking boards and firm performance. The capabilities of directors who serve as multi-director on different boards can act effectively in the interest of every company. Additionally, the interlock network improves a firm’s reputation, create more business opportunities, and improve firm performance. The finding of this study supports the studies conducted by Wong et al. (2015), which indicated that interlocking directorates provided a channel for companies to communicate and act effectively in the interest of every company. However, the result is contrary to the result of Drago et al. (2015) explained that managers hired interlocking directors in order to have a higher degree of freedom, and thus moved away from their fiduciary duties toward shareholders.
Overall, the results appear to support the concept of resource dependency theory, which views the social networks as determinant of firm performance. In other words, this study supports the theory which suggests that increased centrality, structural holes and number of interlocking boards from social networks results in higher performance, thus generating better strategic choices.
5 Conclusion
Extant studies show that the Taiwanese semiconductor industry is characterized by good directors’ social networks. Whether or not such a network would help to improve firm’s performance remains an empirical issue. This study thus examines the association between board interlock and dynamic efficiency using a sample of Taiwanese semiconductor industry firms from 2013 to 2015. The findings are summarized as follows. The degree of centrality, structural holes, and the number of interlocking boards have significantly positive impacts on the Taiwanese semiconductor industry’s dynamic firm performance, all of which are consistent with prior studies. This study highlights the fact that board interlock brings positive impacts on dynamic efficiency. This study shows that directors’ social network’s positive effect on dynamic efficiency provides new insights into how directors can further help improve firm performance through their social networks.
Nevertheless, this study has an interesting new finding, which is that directors’ social network helps increase firm performance, because well-connected networks push firms for a better reputational advantage, a competitive edge. These findings have managerial implications with regard to transitional economies companies and to Taiwanese companies in particular. The findings imply that firms with good directors’ social networks outperform other firms. Therefore, it may be beneficial for firms to recruit directors who centralize their network rather than work individually, as centrality brings about benefits for improving firm performance over long-term periods. The Taiwanese semiconductor industry should revisit their relevant policies and procedures related to board members’ selection. It is advisable to select directors who hold more than one directorship in different companies as it may bring better reputational capital and greater accountability to the firms.
With respect to investors, we suggest that risk averse investors could invest in firms with higher degree of directors’ social networks when there is a higher degree of centrality, structural holes, and number of interlock boards. This is due to the fact that higher degree of centrality, structural holes, and number of interlock boards improve firm performance. In other words, it would enhance shareholders’ control rights especially in investing decision, thus increasing investor’s return in the firm.
Like most studies, this study is subject to limitations. First of all, the measurement of directors’ social networks may come with shortcomings. Although defining directors’ social networks has been found to be relatively difficult, this study adopts the methods of prior studies and uses the centrality, structural holes, and number of interlocking boards as measures of social networks. In any case, more direct measurements may be considered in the future. Future studies may consider examining the social networks and firm performance using primary data, as this study purely uses historical data from the TEJ database and company annual reports to identify social networks. Secondly, due to the constraints of getting data from semiconductor industry firms that have directors’ social networks in the intra- and inter-industry contexts, our final sample is made up of only 381 Taiwanese semiconductor companies. Further studies may consider adding semiconductor firms in other countries as comparisons and this could result in a more robust conclusion. Other aspects such as non-monotonic relationship between social networks and firm performance could be considered in future studies.