Financial Transparency in the Web 2.0 Era. An Analysis of the use of Websites and Social Media by Spanish Municipalities
ABSTRACT
The objective of this paper is to evaluate the role of websites and social media (SM) in increasing local government financial transparency. The research includes 60 Spanish municipalities classified into 4 population levels and combines quantitative and qualitative analyses: a website content examination; an exploration of the use of SM platforms; and an in-depth study of the content published in Facebook and Twitter over a one-year period. Results show that Spanish municipalities still have to make important efforts to increase their levels of financial transparency. Disclosures are mainly focused on budgetary information. The use of Facebook and Twitter by municipalities has become commonplace. However, their use for financial disclosures is underdeveloped. Most of the biggest cities have created open data portals although the disclosure of budgetary and financial datasets is limited. Municipalities have to make important efforts to comply with new demands and requirements for financial transparency. Measures should be taken to enhance transparency, particularly among medium and small municipalities. A definition of clear, structured, understandable and reusable information is needed in order to provide a common disclosure framework for public sector entities.
Keywords: Financial transparency; Internet financial reporting (IFR); municipalities; social media (SM); Web 2.0.
JEL classification: G38, H72, M48.
Transparencia Financiera en la era Web 2.0. Un Análisis del uso de las Páginas Web y Medios de Comunicación Social en Municipios Españoles
RESUMEN
El objetivo de este trabajo es evaluar el papel de las páginas web y medios de comunicación social en el aumento de la transparencia de tipo financiero en las entidades locales. Esta investigación analiza 60 ayuntamientos clasificados en 4 niveles de población y combina análisis cuantitativos y cualitativos: un análisis del contenido de páginas web; una exploración del uso de medios de comunicación social; y un estudio en profundidad de los contenidos publicados en Facebook y Twitter durante un año. Los resultados muestran que los municipios españoles todavía tienen que realizar esfuerzos significativos para aumentar sus niveles de transparencia financiera. La información publicada se centra principalmente en cuestiones de tipo presupuestario. El uso de Facebook y Twitter por parte de los municipios está generalizado. Sin embargo, la utilización de estas plataformas para la revelación de información de tipo financiero está muy poco desarrollada. La mayor parte de los municipios de mayor tamaño han creado portales de datos abiertos, aunque la apertura de conjuntos de datos de tipo presupuestario o financiero es muy limitada. Los municipios tienen que realizar esfuerzos importantes para cumplir con las nuevas demandas y requerimientos de transparencia financiera. Deberían tomarse medidas para mejorar la transparencia, particularmente entre los municipios de pequeño y mediano tamaño. Asimismo, también se hace necesario definir qué se entiende por información clara, estructurada, comprensible y reutilizable para proporcionar un marco de revelación común para las entidades del sector público.
Palabras clave: Transparencia financiera; divulgación de información financiera a través de Internet; municipios; medios de comunicación social; Web 2.0.
Códigos JEL: G38, H72, M48.
1 Introduction
Recent advances in Information and Communications Technologies (ICTs), based on the use of Web 2.0 and social media (SM), have created great expectations for the improvement of government-to-citizen relations because of their potential to improve transparency, communication, collaboration and citizen engagement (Bertot et al., 2012; Bonsón et al., 2012; Haro-de-Rosario et al., 2018). Analyzing the use of these technologies to present financial information to citizens in a proactive, user-friendly, dynamic and understandable way is an interesting challenge that deserves further research (Cohen et al., 2017).
Governmental financial reports are key tools to satisfy public sector financial transparency because information about a government’s financial position, financial performance and service performance is crucial to determine the sustainability of service delivery and value for money issues (Mack & Ryan, 2006; Peters, 2007; Pina et al., 2010; Torres et al., 2006). Cucciniello et al. (2015) show that citizens consider service performance information and financial transparency as more important than institutional or political transparency although the two former dimensions obtain the lowest scores when local government websites are analyzed. Furthermore, survey data (ICAEW, 2014) shows that European citizens demand greater transparency and have a limited understanding of public sector financial information.
The focus of this research is on downward transparency, which takes places when citizens can observe the actions and results of public institutions (Heald, 2006) and, more specifically, on governmental financial transparency in its broadest sense, including the disclosure of information about a government’s approved and executed budget, financial position and service performance. Financial transparency is a sine qua non of modern democracies: the public should be able to scrutinize public expenditure as part of the accountability process (Shaoul et al., 2010). However, public sector reporting has been criticized for not properly addressing the needs of the different users and for the gap between citizen understanding and the technical details in financial statements (Cucciniello et al., 2015; Heald, 2012).
The Web 2.0 includes tools to promote the diffusion of financial information with reduced costs while offering possibilities to make it more understandable, easy to re-use and open to citizen scrutiny and feedback. Furthermore, SM have become one of the main sources of information; it is through SM that many people receive updates on the latest corporate news, market trends, investment information, and so on (Zhang, 2015). However, it is necessary to develop assessment techniques to empirically test the relationship between the tools and outcomes, namely, transparent and open government (Bertot et al., 2012).
Previous studies have analyzed the use of websites for financial reporting (e.g. Caba et al., 2008; Pina et al., 2010) and the use of SM to promote citizen engagement (e.g. Agostino, 2013; Bonsón et al., 2015; Haro-de-Rosario et al., 2018), especially among big local governments. However, the use of SM and advanced features of websites based on Web 2.0 tools (such as open data portals or RSS) for the proactive provision of financial information by public sector entities has hardly been analyzed to date. In this context, the objective of this paper is to evaluate the role of websites and SM in increasing the financial transparency of municipalities. For this purpose, a comprehensive disclosure index for the analysis of the websites is developed and some drivers of Internet Financial Reporting (IFR) are analyzed. Then, the use of SM platforms is analyzed and, lastly, an in-depth analysis of the content published in Facebook and Twitter over a one-year period is carried out.
This paper also contributes to other underexplored areas of transparency research in the public sector (Sáez-Martín et al., 2017). It broadens the analysis of regulation of access to public information beyond the Anglo-Saxon context. It analyzes levels of compliance with legislation on the proactive mandatory disclosure of financial information. It combines the analysis of mandatory (websites) and voluntary (SM) tools for disclosure, and uses a comprehensive disclosure index that includes both content and quality aspects. Finally, it adds to the existing literature by analyzing local governments of different sizes, including medium and small local governments.
Spain has been chosen for the analysis because of the increased citizen demand for public financial accountability (ICAEW, 2014), especially after the strong impact of the economic crisis, the high level of adoption of SM among citizens (IAB Spain, 2015) and local governments (Guillamón et al., 2016) and the approval of the Transparency Act (Government of Spain, 2013), which required local governments to disclose financial information on the Internet by the end of 2015. This setting is particularly interesting to investigate the use of official websites and SM to increase public sector financial transparency and provide financial information in a user-friendly way. According to Bonsón & Flores-Muñoz (2014), an entity is more likely to disclose financial information if there is an obligation, a necessity to reduce its cost of capital, and/or social pressure. All these factors come together in the Spanish public sector today. Based on our findings, practical implications are highlighted.
Results show that Spanish municipalities still have to make important efforts to increase their levels of financial transparency and promote the re-use of financial information. The use of Facebook and Twitter by municipalities has become commonplace, but their use for financial disclosures is underdeveloped. Furthermore, advanced features of websites based on Web 2.0 tools for the proactive provision of financial information (such as open data portals or RSS) show very low levels of development.
The rest of the paper is structured as follows. The second section provides the background for this paper, which deals with the role of Web 2.0 and SM in financial transparency and the Spanish context. The third section describes the research design and methodology. The results are presented in the fourth section. Section five discusses the findings and highlights their practical implications. Finally, the conclusion section brings the paper to an end.
2 Background
2.1 The Role of Web 2.0 and Social Media in Financial Transparency
Most of the definitions of transparency1 proposed in the literature share the following common elements: 1) the availability of and accessibility to the information in a timely manner, 2) the accuracy and relevance of the information disclosed, and 3) the need for the information to be understandable (Gandía et al., 2016). According to Transparency International (TI, 2015, p. 8), accurate government information shall be made available to citizens in a timely, intelligible, useful and comparable way and in an accessible format; furthermore, citizens should have opportunities to be involved in decision-making processes (p. 23). So, the mere disclosure of information (content) is not enough; information quality, stakeholder orientation and responsiveness (quality) are also necessary conditions for effective transparency (Cohen et al., 2017; Cucciniello et al., 2015).
Given the potential of ICTs for the diffusion of information, many transparency laws have embraced the adoption of ICT-based initiatives (Relly & Sabharwal, 2009) in order to make public sector financial information available to the general public. SM, open data portals and other advanced features of websites based on Web 2.0 tools (such as RSS) can improve existing approaches to transparency and foster new cultures of openness. They provide governments with new tools to promote the proactive provision of financial information and stakeholder orientation and they empower citizens to monitor governmental activities (see Bertot et al., 2012; Stamati et al., 2015). These tools can contribute greatly to transparency by increasing the visibility of and accessibility to the contents published in the official websites. They can also help to promote other qualitative characteristics of the information (Caba et al., 2008; Pina et al., 2010), such as timeliness, comparability, possibility of re-using the information and understandability, and foster a more extensive interaction with citizens (Cohen et al., 2017). According to Bearfield & Bowman (2017), the use of SM can facilitate the evolution from the old paradigm of making information available online to a newer paradigm that really engages citizens. However, citizens’ engagement levels seem to vary from platform to platform, Facebook being preferred to Twitter as a means of participating in local government issues (Haro-de-Rosario et al., 2018).
SM promote timeliness by allowing users to know immediately when new information is available. The diffusion of information is also enhanced, as direct recipients can easily re-direct the information to their networks, resulting in a multiplying effect in the diffusion of information (virality). Usability and comparability are greatly enhanced when information is provided in formats that facilitate the re-use of information (e.g. spreadsheets, XML files, or machine-readable formats using metadata) or using customizable charts. Other electronic resources can also be useful to promote the understandability of financial information, including Frequently Asked Questions, hyperlinks within the information provided and visuals. According to Cohen et al. (2017), all these features would help to keep citizens better informed and more involved. Furthermore, the possibilities of providing feedback and obtaining an answer are also increased at no cost to the users. Indeed, one main benefit of SM is that a single platform integrates the information and the comments made by the community.
Despite all the benefits that Web 2.0 and SM offer in terms of transparency and citizen participation, research shows that the use of these technologies is very often essentially ornamental (Gandía et al., 2016; Gunawong, 2015). The focus has mainly been on the provision of information (Mergel, 2013; Mickoleit, 2014), but not on its use and understanding (Gunawong, 2015). Furthermore, the information disclosed may include both neutral information (e.g. complete financial reports) and purpose-oriented messaging, such as political propaganda (e.g. selected excerpts to provoke specific action by recipients). Finally, preservation of the access to information in the long-term and user dependence on private firms may also create conflicts (Gunawong, 2015; Jaeger & Bertot, 2010).
Almost one-third of online adults use online platforms such as blogs and SM to obtain government information (Lovari & Parisi, 2015), but few empirical studies have analyzed the contribution of SM to public sector transparency, in general, and to financial transparency, in particular. Research into Facebook use by European (Bonsón et al., 2015) and Spanish (Bonsón et al., 2018) municipalities shows that the posts published only very rarely refer to financial information (0.6% and 0.8%, respectively).
2.2 The Spanish Context
Spain shares characteristics with other European countries that have a public administration style grounded in administrative law and influenced by the French legal model. In these countries, which have a very legalistic culture and highly bureaucratic structures, regulation plays a key role in the operation of public entities and in public sector reforms. This has often been referred to as “management by law” or “management by decree” (Panozzo, 2000). With respect to the financial accountability of Spanish local governments, there are two main legal backgrounds: the accounting and budgetary regulations and the Transparency Act (Government of Spain, 2013).
Spanish regulation requires local governments to elaborate a budget under cash-based principles and accrual-based financial statements, which also include the budgetary execution. Concerning performance indicators, local governments should provide a series of mandatory budgetary and financial indicators. Service performance indicators and cost-related information are required by law for the financial statements as of 2017. The Transparency Act (2013) establishes that the Internet and corporate websites are key mechanisms for the diffusion of economic and financial information. Municipalities were given two years to adapt to these information disclosure requirements. Consequently, since December 2015, municipalities have had to publish all the financial information listed above and other information related to public procurement, grants, politicians and senior managers’ retributions, among other aspects. Furthermore, the Law states that the information must be published in a clear, structured, understandable and reusable way, but no specific guidelines regarding these aspects are provided.
In Spain, most citizens do not feel well informed about the state of public finances and more than 80% of the population believe the government should improve its transparency about how public money is spent, compared to a European average of 67% (ICAEW, 2014). The percentage of individuals regularly using the Internet and SM in Spain (75% and 51%, respectively) is quite close to the EU-15 average (81.6% and 54.6%) (Eurostat, 2015). 82% of Spanish Internet users aged 18 to 55 use SM, predominantly Facebook, YouTube and Twitter (IAB Spain, 2015): 96% of Spanish SM users use Facebook, 66% YouTube and 56% Twitter. Furthermore, Alexa rankings (Alexa.com, 2017) show that Facebook, YouTube and Twitter are among the top six sites in terms of the number of visitors and page views in Spain. Moreover, the two political parties that arose during the crisis in Spain, “Ciudadanos” and “Podemos”, right and left wing respectively, owe an important part of their popularity to SM. Even though the use of SM to disclose financial information is not mandatory for Spanish public administrations, given the high number of users of these platforms in Spain and their immediacy and interactivity, they offer interesting opportunities in this context.
Various studies and international organizations -such as TI and Global Right to Information- have analyzed the use of websites for the diffusion of financial information by Spanish municipalities and/or its determining factors, though they have mainly focused on big cities (Albalate, 2013; Caba et al., 2008; Carcaba & García, 2010; Gandia & Archidona, 2008; Guillamón et al., 2011; Martí et al., 2012; Serrano-Cinca et al., 2009; Torres et al., 2006). In general terms, these studies have shown that, in Spain, local government websites have hardly been used as a channel for the diffusion of financial information and performance indicators, with some exceptions such as Barcelona (see Pina et al., 2010). Most studies show a significant evolution in recent years, but they were conducted before the approval of the Transparency Act.
Previous studies about SM use by Spanish local governments for financial disclosures are much less common. Gandía et al. (2016) analyze the use of SM by Spanish municipalities with more than 50,000 inhabitants for transparency purposes. They cover only 5 items related to financial transparency and show a very limited use of SM for financial reporting. Decisive reasons for fluctuations in levels of transparency have not been found (Bearfield & Bowman, 2017; Tavares & da Cruz, 2017), but population size, income per capita and political factors are usually significant in Spanish municipalities (Alcaide et al., 2017). A study analyzing Facebook use by the biggest local governments in Italy and Spain for information disclosure purposes (Guillamón et al., 2016) also found that population size and citizens’ income level, together with the level of e-participation and indebtedness, influence the level of municipal transparency through SM.
3 Research Design and Methodology
3.1 Sample
The sample for this study comprises 60 Spanish municipalities classified into 4 groups with different population levels. Fifteen municipalities have been analyzed in each group. The first group (big) is made up of the fifteen biggest local governments. The other 3 groups include the municipalities closest to 100,000, 50,000 and 20,000 inhabitants (large, medium and small, respectively), according to data from the Spanish Institute of Statistics (INE, www.ine.es) referring to January 1st, 2014. The minimum threshold was established at 20,000 as smaller local governments share the responsibility of e-government development with their provincial government. 50,000 inhabitants is a threshold for Spanish municipalities as they assume the greatest number of competencies and services. In Spain, there are 145 local governments with more than 50,000 inhabitants, so we decided to split this group into two to obtain an appropriate representativeness. 100,000 inhabitants was taken as the threshold because it is the one most used by the INE. Around 68% of the Spanish population lives in cities with a population of over 20,000.
Once the thresholds were established, 15 local governments per group were considered a representative sample. The only group that can be considered under-represented is that of small municipalities because, in Spain, there are 255 municipalities between 20,000 and 50,000 inhabitants (15 local governments represent only 6% of these). As the levels of disclosure obtained in this group were very low and quite homogenous, we considered that expanding the sample was not necessary.
3.2 Financial Transparency on the Official Website
Other indexes present in the literature, such as those of TI, only assess whether the information is present on the official websites (content) but not whether it is easily accessible and/or oriented to user needs. Therefore, we defined and elaborated our own transparency index, as explained below. The websites were accessed during April and May 2015 and 42 items were analyzed. The upsurge of two political parties with a strong use of SM, the municipal elections at the end of May 2015, the great focus on transparency in the political debate and the imminent entry into force of the Transparency Act made it highly interesting to study the level of financial transparency at that moment.
The items analyzed were classified on two dimensions: content (25 items) and quality (17 items). The content dimension assesses the level of the disclosure of financial and budgetary information, performance information and other economic information required by the Transparency Act (see Table 1). The items were selected based on previous studies on IFR, mainly Caba et al. (2008) and Pina et al. (2010), together with additional items required by the Spanish Transparency Act, as it is the main reference point in Spain. Spanish municipalities were required by law to prepare all but three of the documents of the content dimension (consolidated financial statements, audit report and additional performance indicators) when the analysis was carried out. These three items were included as they refer to ongoing reforms or areas where some advances in Spain have already been acknowledged (see Martí et al., 2012; Torres et al., 2011). Therefore, the disclosure of the items included in the content dimension should not represent, a priori, any problem for Spanish municipalities. All but 6 of them are also legally required to be disclosed in the official websites (see Table 1).
The quality dimension assesses the level of stakeholder orientation and covers the following aspects: accessibility to the information, relevance (in terms of timeliness, comparability and the possibility of re-using the information), understandability and the possibility of establishing a dialog between the local government and interested stakeholders (see Table 2). Most of the items were taken from previous research on the topic (Caba et al., 2008; Pina et al., 2010) or derived from the Transparency Act, whereas others refer to advanced features of websites based on Web 2.0 tools, which have not been analyzed before (open data portals and RSS).
Most items were rated “1” if they appeared in the website and “0” if not. Some items could be scored 0.5 if they partially fulfilled the coding criteria2. This method has been applied in similar assessments (e.g. Pina et al., 2010; TI Spain, 2017). Additionally, the item related to other languages was scored as “-1” for municipalities that only use their regional languages. A pre-analysis was carried out in March 2015, when the authors separately analyzed 5 of the websites to check for consistency in the application of the coding criteria. Virtually no scoring differences were found, although some additional clarifications were introduced into the coding criteria. Data collection was carried out by two of the authors, each of them analyzing municipalities in all the groups. During the analysis, the authors met several times to check their scoring and to resolve possible doubts. Three scores were obtained for each local government, one per dimension plus a total score, using an equal weighting method. Other methods would require exercising judgment or consultation with key stakeholders to determine the weights to use (da Cruz et al., 2016).
To analyze the data obtained through the website content analysis, the percentages of disclosure of each of the 42 items were calculated and a ranking of IFR by municipalities was elaborated. Furthermore, correlation analyses, Kruskal-Wallis and Mann-Whitney tests were carried out to check whether there are any differences in the IFR scores depending on the size of the municipalities, income per capita, the political party in office and political competition, as these factors have traditionally been found significant to explain IFR levels in Spanish municipalities3. Justifications for the expected relationships of these variables with IFR can be found, among others, in Alcaide et al. (2017), Caba et al. (2008), Carcaba & Garcia (2010), Gandia & Archidona (2008), Pina et al. (2010) and Guillamón et al. (2011).
3.3 Adoption of Social Media
At the end of May 2015, the official websites of the municipalities of the sample were analyzed for direct links to SM platforms by two of the authors. As results will show, Facebook and Twitter were the most widely adopted tools so, in what follows, the analysis is focused on the official corporate Facebook and Twitter accounts4.
To provide an overall view of Facebook and Twitter use by Spanish municipalities and their popularity among citizens, the following data were obtained (24th June 2015). For Facebook: average number of posts per day (retrieved from LikeAlyzer); number of fans; citizen awareness of the Facebook page (Nº fans/population); PTAT (People Talking About This, retrieved from LikeAlyzer)5 and engagement level (PTAT/Nº fans)6. For Twitter: average number of tweets per day (since the account was created); number of followers; and citizen awareness of the Twitter account (Nº followers/population). These metrics have previously been used by Agostino (2013) and Bonsón et al. (2018)7.
3.4 Use of Facebook and Twitter for Financial Disclosures
Finally, an in-depth analysis of the content published in Facebook and Twitter over a one-year period (from 1st September 2014 to 31st August 2015) was carried out to determine the level of use of these platforms for the disclosure of financial information. Research both in the private (Zhang, 2015) and the public sector (Pina et al., 2010) shows that voluntary disclosures via a new medium follow the pattern of voluntary disclosure via traditional media. Therefore, the in-depth analysis of the content published in the main SM sites was limited to the top-performing cities in IFR. We defined top-performing cities as those having a total IFR score higher than 65%8 and an open data section with financial information. These two requirements were only fulfilled by six cities: Barcelona, Madrid, Alcobendas, Málaga, Bilbao and Gijón (all of them big cities, except Alcobendas from the large group). They are the top-performing cities in IFR so, a priori, they should be the leaders in the use of SM for financial transparency.
For this analysis, that was carried out by one of the authors, the official profiles were accessed and all the posts/tweets published over the period analyzed were read. When they referred to financial transparency issues, they were saved for further analysis. Finally, the posts were coded following a similar structure to the one used for the content dimension of the websites, adding some items where necessary (for example, for the disclosure of pre-budget announcements, information about transparency rankings or other financial news/announcements).
4 Analysis of Results
4.1 Financial Reporting through Websites
Table 1 presents the results of the content dimension. As can be observed, the percentages of disclosure for all the items present a descending order from big to small local governments and there is a great level of dispersion in the average scores per item and subgroups of items. Budgetary information (49%) and the additional information required by the Transparency Act (48%) have the highest average levels of disclosure while financial information and performance indicators show the lowest levels of disclosure (36% and 31%, respectively). This may be for two reasons: the traditional prominence of budgetary information in Spain and the increasing importance given by the Transparency Act to items included in the additional information. Of the budgetary information, the most disclosed document is the approved budget (63%). The item with the greatest level of disclosure is information about public procurement (91%), whose disclosure has been legally required since 2011. The items with the lowest levels of disclosure are performance indicators and consolidated financial statements (15% and 8.3%, respectively).
Table 1. Percentages of disclosure on the content dimension
| Item | Total | Big | Large | Medium | Small | |
|---|---|---|---|---|---|---|
| Financial-economic information | 36% | 76% | 44% | 23% | 2% | |
| 1* | Statement of Financial Position | 46.7% | 93.3% | 56.7% | 36.7% | 0.0% |
| 2* | Statement of Financial Performance | 45.0% | 93.3% | 53.3% | 33.3% | 0.0% |
| 3* | Notes | 36.7% | 73.3% | 46.7% | 26.7% | 0.0% |
| 4 | Consolidated amount of municipal debt | 40.0% | 86.7% | 60.0% | 13.3% | 0.0% |
| 5 | Municipal debt variation | 40.8% | 76.7% | 56.7% | 16.7% | 13.3% |
| 6 | Consolidated financial statements | 8.3% | 23.3% | 3.3% | 6.7% | 0.0% |
| 7* | Audit report | 36.7% | 86.7% | 33.3% | 26.7% | 0.0% |
| Budgetary information | 49% | 86% | 65% | 27% | 17% | |
| 8* | Approved Budget for the year | 62.5% | 96.7% | 73.3% | 43.3% | 36.7% |
| 9 | Approved Consolidated Budget for the year | 48.3% | 86.7% | 66.7% | 20.0% | 20.0% |
| 10* | Statement of Budgetary execution | 52.5% | 93.3% | 70.0% | 33.3% | 13.3% |
| 11* | Interim data about budgetary execution (monthly or quarterly) | 28.3% | 60.0% | 40.0% | 13.3% | 0.0% |
| 12* | Budgetary stability report | 51.7% | 93.3% | 73.3% | 26.7% | 13.3% |
| Indicators | 31% | 52% | 52% | 15% | 5% | |
| 13* | Financial indicators | 48.3% | 80.0% | 73.3% | 30.0% | 10.0% |
| 14* | Budgetary indicators | 53.3% | 90.0% | 80.0% | 30.0% | 13.3% |
| 15* | Performance indicators (law) | 15.0% | 20.0% | 40.0% | 0.0% | 0.0% |
| 16 | Additional Performance indicators | 8.3% | 13.3% | 13.3% | 6.7% | 0.0% |
| 17 | Services costs and performance report | 29.2% | 56.7% | 53.3% | 6.7% | 0.0% |
| Additional information | 48% | 86% | 58% | 31% | 15% | |
| 18* | Public procurement | 90.8% | 100.0% | 100.0% | 90.0% | 73.3% |
| 19* | Percentage of contracts awarded by type | 32.5% | 76.7% | 53.3% | 0.0% | 0.0% |
| 20* | Subscribed agreements | 35.0% | 80.0% | 50.0% | 10.0% | 0.0% |
| 21* | Grants awarded | 30.0% | 73.3% | 33.3% | 13.3% | 0.0% |
| 22* | Salaries of politicians/senior managers | 55.0% | 93.3% | 60.0% | 46.7% | 20.0% |
| 23* | Compensations paid, if any, for abandonment of office | 43.3% | 100.0% | 53.3% | 20.0% | 0.0% |
| 24* | Real estate properties | 46.7% | 86.7% | 66.7% | 26.7% | 6.7% |
| 25* | Payments to suppliers information: period and/or pending bills | 46.7% | 80.0% | 46.7% | 40.0% | 20.0% |
Note: Spanish local governments were required by law to prepare all but 3 of these documents (items 6, 7 and 16) when the analysis was carried out. The asterisks indicate that these items are required to be disclosed in the official websites by the Transparency Act or other relevant legislation (e.g. item 25, required to be published by Royal Decree 635/2014).
The scores in the quality dimension (Table 2) are very low. Although, in general terms, the percentages of disclosure for the individual items also show a descending order from big to small local governments, some exceptions exist. For example, broken links are more frequent in the websites of big and large local governments, very probably because these websites are more dynamic and change more frequently. The highest average percentages are in accessibility (43%) while, in the other subgroups, the average scores are below 20%. With regards to the particular items, transparency section and no broken links obtain the highest scores (67.5% and 75%, respectively), but they are purely technical issues. Only big cities achieve percentages higher than 60% in four other items: link to the transparency section in the homepage, ease of management of the information disclosed and annual accounts and budgetary execution of previous years. Many cities have created open data portals, but the disclosure of budgetary and financial datasets is limited to 18% of the municipalities analyzed (mostly big cities). This suggests that it will take time for local governments to provide the information in a clear, structured, understandable and reusable way, as required by the Transparency Act. The item referring to the provision of financial information in other languages has a negative average because only 3 municipalities provided some financial information in English while 6 only offered the information in their regional languages. None of the cities presented interim financial information while 28% of them presented interim budgetary execution. This is another indication of the importance given to the budget in Spain. Moreover, the Transparency Act does not require the disclosure of interim financial information. Lastly, very few municipalities provide specific contact data to ask for clarifications or to send feedback.
Table 2. Percentages on the quality (stakeholder orientation) dimension
| Item | Total | Big | Large | Medium | Small | |
|---|---|---|---|---|---|---|
| Accessibility | 43% | 59% | 45% | 38% | 28% | |
| 26 | Transparency section (disclosing all the relevant financial information) | 67.5% | 93.3% | 73.3% | 50% | 53.3% |
| 27 | Link to the Transparency section in the homepage | 45% | 73.3% | 53.3% | 26.7% | 26.7% |
| 28 | Possibility of downloading the full annual report (in one file) | 30% | 53.3% | 46.7% | 20% | 0.0% |
| 29 | Financial information in other languages (additional to the official languages) | -5% | 6.7% | -13.3% | 0.0% | -13.3% |
| 30 | No broken-links | 75% | 66.7% | 66.7% | 93.3% | 73.3% |
| Relevance (timeliness, re-use of the information, comparability) | 20% | 39% | 19% | 15% | 6% | |
| 31 | E-mail alerts / RSS | 8.3% | 26.7% | 0.0% | 6.7% | 0.0% |
| 32 | Interim financial information | 0.0% | 0.0% | 0.0% | 0.0% | 0.0% |
| 33 | Open data section with financial information | 18.3% | 46.7% | 13.3% | 6.7% | 6.7% |
| 34 | Ease of management of the information supplied (xls…) | 40% | 60% | 36.7% | 33.3% | 30% |
| 35 | Comparative information | 3.3% | 3.3% | 3.3% | 6.7% | 0.0% |
| 36 | Annual accounts of previous years | 29.6% | 68.3% | 33.3% | 16.7% | 0.0% |
| 37 | Budgetary execution of previous years | 37.9% | 70% | 46.7% | 31.7% | 3.3% |
| Understandability | 12% | 19% | 11% | 7% | 12% | |
| 38 | Additional ratios, graphics or backup images | 30% | 43.3% | 26.7% | 20% | 30% |
| 39 | Information with hyperlinks | 5% | 6.7% | 6.7% | 0.0% | 6.7% |
| 40 | FAQ section | 1.7% | 6.7% | 0.0% | 0.0% | 0.0% |
| Feedback | 18% | 17% | 17% | 23% | 17% | |
| 41 | E-mail to ask for transparency-related information | 16.7% | 13.3% | 20% | 13.3% | 20% |
| 42 | Phone number or address to ask for transparency-related information | 20% | 20% | 13.3% | 33.3% | 13.3% |
Table 3 includes the averages for the total, content and quality scores of each group, showing that the averages are very low (34.6% for the total score, 41.3% for content and 24.9% for quality), especially considering the imminent entry into force of the Transparency Act. Barcelona has the best scores in the three indexes and two local governments do not disclose any of the items (the individual scores of each city can be found in the Appendix). Only 12 local governments (8 big, 3 large and 1 medium) obtain a total score higher than 60%. Only the average total score for big cities is slightly higher than 60% (see Table 3). Better results are achieved in the content index, where 23 local governments are above 60% but, again, most of them (15) are big. As regards quality, no group scores higher than 40%.
As in previous research, results show that the biggest and wealthiest municipalities show a higher level of use of their websites for financial transparency (see Table 3). Indeed, these two variables explain, on their own, around 40% of the variance in the three indexes9. Pearson correlations confirm that there is a relationship between these factors and the transparency scores. Additionally, the Mann-Whitney tests show that the differences in IFR between the biggest local governments (big and large cities) and the smallest (medium and small) are statistically significant for the three indexes. Differences between big and large municipalities are also statistically significant, but differences between medium and small cities are not. No statistical differences in IFR were found depending on the ruling party or political competition.
Table 3. Relationships between IFR and size and income per capita
| Panel A: Relationship between IFR and size | |||
|---|---|---|---|
| Average scores of each group | Content | Quality | Total |
| Big | 76.5% | 38.7% | 61.2% |
| Large | 54.3% | 25.1% | 42.5% |
| Medium | 24.7% | 21.1% | 23.2% |
| Small | 9.6% | 14.7% | 11.7% |
| TOTAL | 41.3% | 24.9% | 34.6% |
| Correlations between scores and population | Content | Quality | Total |
| Pearson Correlation | 0.530** | 0.493** | 0.515** |
| Differences between groups (Mann-Whitney tests) | Content | Quality | Total |
| Big and large | 65.40 | 31.91 | 17.44 |
| Medium and small | 17.13 | 17.89 | 51.84 |
| Z | -5.737** | -3.415** | -5.494** |
| Big | 76.53 | 38.72 | 61.23 |
| Large | 54.26 | 25.09 | 42.46 |
| Z | -2.555* | -2.372* | -2.885** |
| Medium | 24.66 | 21.07 | 23.21 |
| Small | 9.60 | 14.70 | 11.66 |
| Z | -1.358 | -1.067 | -0.1474 |
| Panel B: Relationship between IFR and income per capita | |||
| Correlations between scores and income per capita | Content | Quality | Total |
| Pearson Correlation | 0.447** | 0.559** | 0.506** |
| Panel C: Relationship between IFR and political party in office | |||
| Differences between groups (Kruskal-Wallis tests) | Content | Quality | Total |
| Right-wing | 45.3% | 26.1% | 37.5% |
| Left-wing | 32.9% | 19.2% | 27.4% |
| Nationalist | 44.5% | 33.5% | 40.0% |
| Z | 3.006 | 4.776 | 3.564 |
| Panel D: Political competition | |||
| Majority versus Minority government (Mann-Whitney test) | Content | Quality | Total |
| Majority government | 41.7% | 25.9% | 35.3% |
| Minority government | 40.9% | 24.0% | 34.1% |
| Z | 0.126 | 0.379 | 0.133 |
| Correlations between scores and percentage of councilors | Content | Quality | Total |
| Pearson Correlation | -0.019 | -0.119 | -0.047 |
Note: ** Significant at 1%; * Significant at 5%.
4.2 Social media adoption
Table 4 shows the level of adoption of SM platforms. Important differences can be found depending on the size of local governments, with the highest adoption levels in big and large municipalities. Overall results show average adoption rates higher than 75% for Twitter and Facebook. The following tools in order of importance are YouTube and RSS, with percentages of adoption of around 55%. The adoption of the other platforms is very low. The average number of SM tools used is 3.6 (with decreasing percentages of adoption from big to small local governments), and only 6 of the municipalities analyzed do not use any of these tools (all of them in the medium and small groups).
Table 4. SM adoption by Spanish municipalities (SM platforms ranked by % of adoption)
| Total | Big | Large | Medium | Small | |
|---|---|---|---|---|---|
| 76.7% | 86.7% | 93.3% | 73.3% | 53.3% | |
| 75.0% | 93.3% | 100.0% | 66.7% | 40.0% | |
| YouTube | 56.7% | 73.3% | 66.7% | 46.7% | 40.0% |
| RSS | 55.0% | 80.0% | 60.0% | 60.0% | 20.0% |
| Google + | 23.3% | 40.0% | 26.7% | 20.0% | 6.7% |
| Flickr | 21.7% | 33.3% | 26.7% | 20.0% | 6.7% |
| Blogs | 10.0% | 26.7% | 6.7% | 6.7% | 0.0% |
| 10.0% | 33.3% | 0.0% | 6.7% | 0.0% | |
| 10.0% | 6.7% | 20.0% | 6.7% | 6.7% | |
| 6.7% | 6.7% | 13.3% | 6.7% | 0.0% | |
| SlideShare | 5.0% | 13.3% | 6.7% | 0.0% | 0.0% |
| Vimeo | 3.3% | 6.7% | 6.7% | 0.0% | 0.0% |
| Tuenti | 3.3% | 0.0% | 13.3% | 0.0% | 0.0% |
| Wikipedia | 1.7% | 6.7% | 0.0% | 0.0% | 0.0% |
| Other | 13.3% | 13.3% | 20.0% | 6.7% | 13.3% |
| Average No. of tools used | 3.6 | 5.1 | 4.3 | 3.1 | 1.7 |
| LG using none of the tools (%) | 10.0% | 0.0% | 0.0% | 6.7% | 33.3% |
| Min. No. of tools used | 0 | 1 | 3 | 0 | 0 |
| Max. No. of tools used | 12 | 12 | 7 | 6 | 5 |
As Facebook and Twitter are the most widely adopted tools, subsequent analyses were focused on the official corporate Facebook and Twitter accounts. As Table 5 shows, the average levels of municipal activity usually present a descending order from big to small local governments and are much higher in Twitter than in Facebook (5.6 versus 2 publications per day, on average). This seems logical, given Twitter’s character limit. However, high levels of heterogeneity can be appreciated in the level of activity of the municipalities, with some publishing, on average, fewer than one message per day and others publishing almost 7 posts or more than 40 tweets per day.
Table 5. Activity of municipalities on Facebook and Twitter (post/tweets per day)
| Total | Big | Large | Medium | Small | ||
|---|---|---|---|---|---|---|
| Facebook: Posts per day | Mean | 2.0 | 2.6 | 1.9 | 2.3 | 1.3 |
| Min. | 0.0 | 0.0 | 0.0 | 0.9 | 0.4 | |
| Max. | 6.8 | 6.8 | 4.9 | 3.7 | 2.1 | |
| Stand. Dev. | 1.5 | 1.7 | 1.6 | 1.1 | 0.7 | |
| N | 34 | 11 | 10 | 6 | 7 | |
| Twitter: Tweets per day | Mean | 5.6 | 8.3 | 6.5 | 3.4 | 2.8 |
| Min. | 0.2 | 0.9 | 0.7 | 1.0 | 0.2 | |
| Max. | 41.6 | 41.6 | 26.3 | 9.6 | 7.2 | |
| Stand. Dev. | 7.0 | 10.6 | 6.6 | 2.4 | 2.1 | |
| N | 46 | 13 | 14 | 10 | 9 |
Note: The number of municipalities (N) in Tables 5 and 6 is different from the figures reported in Table 4 because only the official corporate accounts have been taken into account. We broadened the search to include all the official corporate accounts although they were not linked from the official website. Furthermore, some of the Facebook pages could not be analyzed with LikeAlyzer.
An important question is whether citizens are interested in and engage with the SM account of their municipalities. Results show a great variation in citizens’ activity levels (see Table 6). In general, the average number of fans/followers seems to be low and presents a descending order from big to small local governments. Awareness levels among citizens show average values of 5.4% for Facebook and 5.3% for Twitter. These percentages, despite being low, are higher than those of most of the ten most followed central government Twitter accounts (Mickoleit, 2014). The percentage of awareness is much higher in medium and small cities. Some municipalities are doing particularly well in this regard, reaching more than 10% of their inhabitants through SM. As regards engagement levels, we only have data about Facebook, and the results are low. On average, only 9.2% of the fans are really interacting on the official corporate Facebook accounts. Again, levels of heterogeneity are very high in all the groups. Only four of the accounts analyzed manage to actively engage more than 20% of their fans (all of them big and large cities).
Table 6. Activity levels by citizens
| Total | Big | Large | Medium | Small | ||
|---|---|---|---|---|---|---|
| Facebook: Number of fans | Mean | 9,809.4 | 23,467.9 | 3,744.5 | 3,992.5 | 1,996.3 |
| Min. | 576.0 | 1,423.0 | 576.0 | 932.0 | 1,054.0 | |
| Max. | 153,698.0 | 153,698.0 | 12,269.0 | 8,384.0 | 4,336.0 | |
| Stand. Dev. | 26,499.4 | 44,670.6 | 3,750.4 | 2,612.8 | 1,128.2 | |
| N | 34 | 11 | 10 | 6 | 7 | |
| Facebook: Citizen awareness | Mean | 5.4% | 3.0% | 3.8% | 7.0% | 10.0% |
| Min. | 0.0% | 0.3% | 0.6% | 0.0% | 5.2% | |
| Max. | 21.6% | 10.1% | 12.7% | 18.0% | 21.6% | |
| Stand. Dev. | 5.2% | 3.5% | 3.9% | 6.0% | 5.6% | |
| N | 35 | 11 | 10 | 7 | 7 | |
| Facebook: PTAT | Mean | 1,032.2 | 2,499.4 | 355.1 | 485.7 | 162.3 |
| Min. | 5.0 | 9.0 | 5.0 | 102.0 | 18.0 | |
| Max. | 16,886.0 | 16,886.0 | 1,719.0 | 1,662.0 | 373.0 | |
| Stand. Dev. | 2,964.9 | 5,005.8 | 502.0 | 589.0 | 157.8 | |
| N | 34 | 11 | 10 | 6 | 7 | |
| Facebook: Engagement level | Mean | 9.2% | 9.1% | 10.4% | 11.4% | 5.1% |
| Min. | 0.6% | 0.6% | 0.7% | 3.2% | 1.2% | |
| Max. | 35.6% | 23.1% | 35.6% | 19.8% | 10.8% | |
| Stand. Dev. | 8.1% | 7.7% | 10.8% | 6.9% | 3.8% | |
| N | 33 | 11 | 10 | 6 | 6 | |
| Twitter: Number of followers | Mean | 10,634.8 | 29,752.2 | 3,869.8 | 3,310.4 | 1,682.6 |
| Min. | 309.0 | 2,764.0 | 457.0 | 1,298.0 | 309.0 | |
| Max. | 121,764.0 | 121,764.0 | 11,187.0 | 5,888.0 | 4,630.0 | |
| Stand. Dev. | 21,434.6 | 33,967.5 | 3,263.9 | 1,546.4 | 1,569.3 | |
| N | 46 | 13 | 14 | 10 | 9 | |
| Twitter: Citizen awareness | Mean | 5.4% | 4.0% | 3.8% | 6.7% | 8.4% |
| Min. | 0.5% | 0.8% | 0.5% | 2.5% | 1.6% | |
| Max. | 23.1% | 10.5% | 11.5% | 11.2% | 23.1% | |
| Stand. Dev. | 4.6% | 2.8% | 3.2% | 3.2% | 7.8% | |
| N | 46 | 13 | 14 | 10 | 9 |
4.3 Case Study on Financial Reporting through Social Media
This section presents the results of the in-depth analysis of the content published on Twitter and Facebook (Tables 7 and 8, respectively) from 1st September 2014 to 31st August 2015 by Barcelona, Madrid, Alcobendas, Málaga, Bilbao and Gijón. The six cities have an official Twitter account and all but Gijón have an official Facebook account.
The use of Twitter for the disclosure of financial-related information is much higher than that of Facebook. As can be seen in Table 7, there is a strong variation in the average number of tweets published per day, ranging from 1.9 in Bilbao to 16.1 in Barcelona. However, the percentage of financial tweets over the total number of publications is more homogeneous, ranging from 0.7% in Alcobendas to 1.8% in Barcelona. These percentages are not bad, a priori, given the wide array of topics that can be covered in the corporate Twitter account of a municipality. Most of the financial tweets in Madrid, Barcelona and Bilbao contain a link to get further information. However, in most cases these links refer to a press release by the local government and, only in very few instances, is a link provided to the section of the website where an official report or data can be downloaded. The use of images or videos is much less common.
Most of the financial tweets (46.4%) refer to budgetary information, especially to the approval of the budget (11.3%) or generic pieces of news about the budget, for example, new investments (23.5%). Only very rarely do they refer to budget modifications, the execution of the budget or early stages in the preparation of the budget so that citizens can participate and give feedback. Additionally, 13.6% of the tweets refer to generic financial news or announcements and 11.3% to grants or other aids. None of the tweets refer to cost or performance-related information and only 8.5% are strictly related to financial information (annual accounts, debt or audit-related information).
As regards the use of Twitter to promote financial transparency, the case of Barcelona deserves special attention, with more than 100 tweets over the one-year period. However, a lot of repetitions have been found. For example, 21 tweets referring to financial information were identified in August 2015 but, in fact, only 4 different topics were involved: salaries of politicians/senior managers (16 tweets), grants (2), rating-related information (2) and budget allocation for schools (1). So, this local government should re-think its strategy regarding Twitter use as there is a high risk of information overload (16.1 tweets per day, on average) that could be easily reduced just by avoiding repeated tweets.
Some examples of good practice can be mentioned. In Bilbao, when the approval of the budget is announced on Twitter, a link to the url where the full budget can be downloaded is provided. In Barcelona, the tweet about the announcement of a public hearing before the approval of the budget contains a link to a website (http://ajuntament.barcelona.cat/pressupostos2015/en/) with all the related documents, tables and graphs with the key figures, videos, presentations and an email address for citizens to ask about doubts or to send suggestions. Furthermore, this website is available in Spanish, English and Catalonian (even though all the tweets are in Catalonian). However, only three tweets in all the sample refer to the approval of the annual accounts or the execution of the budget and, in these cases, no link to the approved documents is provided.
The use of Facebook to provide financial information (Table 8) is much lower. As mentioned before, Gijón had no official Facebook account and, in Madrid, it was created on the 7th July 2015, with the first post being published on the 14th July. Thus, only the posts corresponding to one and a half months could be analyzed. The level of activity in Bilbao is very low, with no posts published from the 3rd of August to the end of the month and an average of 0 posts per day. Barcelona’s official Facebook account is not used to disclose institutional information, but general events and activities. Therefore, no financial posts were found either in Bilbao or Barcelona. Although the analysis in Madrid is based on a shorter period of time, the results revealed that all the financial tweets published during the period were also published on Facebook, with a very high percentage of financial posts (5.2%). By contrast, in Málaga and Alcobendas, some contents were only published on one of the platforms. In general terms, some announcements made on Twitter were not found on Facebook, although some exceptions were found, such as the use of Facebook in Málaga to provide information about new tenders and contract awards and, in Alcobendas, to provide information about grants.
Table 7. Content analysis of tweets
| Madrid | Barcelona | Málaga | Bilbao | Gijón | Alcobendas | MEAN | |
|---|---|---|---|---|---|---|---|
| Tweets per day (average) | 3.7 | 16.1 | 9.3 | 1.9 | 2.7 | 14.4 | 8.0 |
| Nº Tweets per year | 1,338 | 5,862 | 3,383 | 688 | 979 | 5,238 | 2,915 |
| Nº Tweets related to financial information | 21 | 103 | 29 | 11 | 10 | 37 | 35.2 |
| % of financial tweets | 1.6% | 1.8% | 0.9% | 1.6% | 1.0% | 0.7% | 1.3% |
| % of financial tweets with links | 71.4% | 84.0% | 51.7% | 100.0% | 50.0% | 27.0% | 64.0% |
| % of financial tweets with images/photos | 4.8% | 45.6% | 27.6% | 0.0% | 50.0% | 35.1% | 27.2% |
| % of financial tweets with videos | 4.8% | 4.9% | 0.0% | 0.0% | 0.0% | 0.0% | 1.6% |
| Financial-economic information | 14.3% | 7.8% | 13.8% | 0.0% | 0.0% | 8.1% | 8.5% |
| Approval of the annual accounts | 1 | 0.5% | |||||
| Debt-related information / Rating-related information | 3 | 4 | 2 | 4.2% | |||
| Other financial reports | 4 | 1 | 2.3% | ||||
| Audit-related news | 3 | 1.4% | |||||
| Budgetary Information | 38.1% | 46.6% | 58.6% | 27.3% | 10.0% | 56.8% | 46.4% |
| Pre-budget news/reports/meetings/hearings | 1 | 4 | 1 | 1 | 3 | 4.7% | |
| Approval of the annual budget | 1 | 16 | 1 | 1 | 1 | 4 | 11.3% |
| Budget modifications | 6 | 1 | 1 | 1 | 4.2% | ||
| Budgetary execution | 1 | 1 | 0.9% | ||||
| Budget stability related news | 2 | 1 | 1.4% | ||||
| Other news about the budget / new investments | 6 | 21 | 12 | 11 | 23.5% | ||
| Cost/performance related information | 0.0% | 0.0% | 0.0% | 0.0% | 0.0% | 0.0% | 0.0% |
| Additional financial information | 4.8% | 29.1% | 20.7% | 54.5% | 70.0% | 0.0% | 23.7% |
| Public procurement | 1 | 2 | 1 | 1.9% | |||
| Information about public aids/grants | 10 | 2 | 5 | 7 | 11.3% | ||
| Salaries of politicians/senior managers | 18 | 1 | 8.9% | ||||
| Period of payment to suppliers / Important payments | 2 | 1 | 1.4% | ||||
| Other information | 42.9% | 16.5% | 13.8% | 18.2% | 20.0% | 35.1% | 22.3% |
| Open data | 1 | 1 | 2 | 1 | 2.3% | ||
| Information about transparency rankings | 1 | 5 | 1 | 1 | 5 | 6.1% | |
| Other financial news / announcements | 7 | 11 | 1 | 2 | 8 | 13.6% |
Table 8. Content analysis of Facebook posts
| Madrid | Barcelona | Málaga | Bilbao | Gijón | Alcobendas | MEAN | |
|---|---|---|---|---|---|---|---|
| Posts per day (average) | 2.5 | 2.0 | 3.9 | 0.0 | No official Facebook account | 2.5 | 2.2 |
| Nº Posts in the period | 116 | 729 | 1,421 | 15 | 906 | -- | |
| Nº posts related to financial information | 6 | 0 | 14 | 0 | 19 | -- | |
| % of financial posts | 5.2% | 0.0% | 1% | 0.0% | 2.1% | 1.7% | |
| % of financial posts with links | 66.7% | - | 92.9% | - | 73.7% | 77.7% | |
| % of financial posts with images/photos | 16.7% | - | 42.9% | - | 73.7% | 44.4% | |
| % of financial posts with videos | 16.7% | - | 0.0% | - | 26.3% | 14.3% | |
| Financial-economic information | 33.3% | - | 0.0% | - | - | 10.5% | 10.3% |
| Approval of the annual accounts | 0.0% | ||||||
| Debt-related information / Rating-related information | 1 | 2.5% | |||||
| Other financial reports | 1 | 2.5% | |||||
| Audit-related news | 2 | 5.0% | |||||
| Budgetary Information | 0.0% | - | 50.0% | - | - | 31.6% | 33.3% |
| Pre-budget news/reports/meetings/hearings | 2 | 5.0% | |||||
| Approval of the annual budget | 2 | 5.0% | |||||
| Budget modifications | 2 | 5.0% | |||||
| Budgetary execution | 0.0% | ||||||
| Budget stability related news | 1 | 2.5% | |||||
| Other news about the budget / new investments | 4 | 2 | 15.0% | ||||
| Cost/performance related information | 0.0% | - | 0.0% | - | - | 0.0% | 0.0% |
| Additional financial information | 33.3% | - | 50.0% | - | - | 21.1% | 33.3% |
| Public procurement | 1 | 6 | 17.5% | ||||
| Information about public aids/grants | 3 | 7.5% | |||||
| Salaries of politicians/senior managers | 1 | 1 | 5.0% | ||||
| Period of payment to suppliers / Important payments | 1 | 2.5% | |||||
| Other information | 33.3% | - | 0.0% | - | - | 36.8% | 23.1% |
| Open data | 0.0% | ||||||
| Information about transparency rankings | 4 | 10.0% | |||||
| Other financial news / announcements | 2 | 3 | 12.5% |
5 Discussion
5.1 Financial Transparency through Websites
The use of websites for financial reporting in Spanish municipalities has become commonplace. However, the amount of information and stakeholder orientation varies to a great extent. While the legislator has confirmed the importance of websites for financial transparency, municipalities differ in the importance given to IFR, particularly regarding the content dimension, where there seems to be first-class and second-class municipalities as regards information disclosure.
Results suggest that Spanish municipalities were getting ready for the imminent entry into force of the Transparency Act. In 2009, when no requirements for IFR existed, only 8% of the Spanish local governments with more than 50,000 inhabitants were providing their annual accounts in their websites (Martí et al., 2012). In 2015, our results indicate that future compliance with the regulation was a main objective, but the disclosure of additional information and stakeholder orientation were hardly developed. Results also show that the management-by-law approach to public sector reforms only becomes effective when appropriate control mechanisms are established, as is the case with the most disclosed information (public procurement). When the requirements are softer, local governments tend not to provide the information, as occurs with performance indicators, cost-related information and quality-related attributes. The lack of detailed guidance on what clear, structured, understandable and reusable information is, leaves public sector entities to interpret these issues on their own. Specific standards regarding these aspects would be useful to provide a common disclosure framework for municipalities. Moreover, the low levels of IFR suggest that transparency, in many instances, is a rhetorical concept rather than a real political/managerial objective. This confirms that enforcement is a key incentive for disclosure and that, otherwise, IFR tends to be ornamental (Bonsón & Flores-Muñoz, 2014; Gandía et al., 2016; Pina et al., 2010; Rodríguez et al., 2015).
Spanish municipalities disclose budgetary information more than financial and performance information. Additionally, the results confirm that Continental Europe gives much greater importance to the disclosure of ex-ante than ex-post budgetary information (Rodríguez et al., 2015). These results have important practical implications, as public sector managers still have to make important efforts to fulfill citizens’ demands regarding financial transparency and the regulator has to consider what measures should be taken for public sector entities to comply with transparency requirements (e.g. incentive/penalty systems, training or specific budgets). Citizens and other stakeholders may also put pressure on local politicians to make their right to downward transparency and clear, structured, understandable and reusable information to be a reality.
Previous research has concluded that political rivalry can create a favorable environment for technological reforms aimed at the improvement of government accountability and “self-reported preferences” towards the use of ICTs in municipalities (Rodríguez, 2017). However, our results indicate that neither political rivalry nor the political party in office affect real practices in IFR. Consistent with previous research (Gandia & Archidona, 2008; Serrano-Cinca et al., 2009), our findings show that the size and wealth of the municipality are related to higher levels of IFR. Even though all the cities analyzed have the same requirements, overall, only the biggest and wealthiest show high levels of disclosure, whereas municipalities with fewer than 50,000 inhabitants usually have rather low values in their disclosure indexes. This is no surprise because the use of new technologies is frequently related to citizen demand and the amount of resources and/or expertise that a municipality has to manage its online relationships. However, the reasons why the biggest and wealthiest municipalities are using new technologies more to disclose financial information (either to reduce information asymmetries or to increase their reputation) are still open to debate (see Pina et al., 2010). In any case, specific incentives or support for medium and small local governments are imperative in order to promote their levels of IFR.
5.2 Financial Transparency through SM
Most Spanish municipalities are embracing SM, but rarely using them to disclose financial information. The size of the municipality is important for SM adoption (with higher adoption rates in big and large cities). Recent research in Andalusian local governments found that all but one of the 29 biggest municipalities had an official Twitter account (Bonsón et al., 2019). Therefore, our findings justify the need to extend transparency studies beyond these municipalities in order to provide a more representative picture of the state of the art. However, awareness levels among citizens are higher in the medium and small municipalities. This finding suggests that SM use has greater potential in small local governments, which is an interesting finding that deserves further research. Previous research has found that smaller cities usually have higher levels of citizen participation, probably because of a feeling of closeness or that one’s voice matters more in smaller communities (Bonsón et al., 2019; Ma, 2013), but future research must identify and test other explanatory factors (Carr & Tavares, 2014).
Differences in the level of use of these tools by municipalities are enormous (with an average number of tweets per day ranging from 0 to 40). Communication between a local government and citizens must be frequent, but without overwhelming the audience. Guidelines on SM use by public sector entities suggest a minimum of two and a maximum of 10 tweets/posts per working day (UK Government Cabinet Office, 2009). Therefore, some municipalities should be more selective about the information they release on their SM accounts and avoid repetitions. There is a tendency in the literature towards optimism about the effect of SM on citizen trust in governments but, to regain citizen trust, municipalities need to make appropriate use of technology. Local governments should not limit themselves to just activating SM accounts. This is particularly important for Spanish municipalities because only four of the Facebook accounts analyzed manage to actively engage more than 20% of their fans. Therefore, the adoption of SM strategies seems highly necessary.
The in-depth content analysis of Facebook and Twitter was restricted to the best cases with respect to IFR and, even in these cases, the release of financial information was low, especially on Facebook. Financial disclosures, adapted to the particularities of each platform, should be promoted both in Facebook and Twitter, taking into consideration, as pointed by Haro-de-Rosario et al. (2018), that their users differ.
The low level of use of SM to promote financial transparency is not a Spanish particularity (see Bonsón et al., 2015). Previous research in the private sector (Zhang, 2015) has found that, after a new medium becomes widely adopted and more popular for disclosure, voluntary financial reporting on that medium follows the pattern of information disclosure in traditional media. However, our results are not in line with these findings because SM accounts are not being used to give visibility to the financial information which is already available in the official websites.
As with financial reporting on websites, most of the posts/tweets referred to the budget and had an ex-ante orientation. The type of financial publications found and the lack of links to the official website to expand on the information confirm that SM are mostly used ornamentally (Gandía et al., 2016), in the same way as traditional media have been used by public sector organizations: pushing general information or purpose-oriented messaging (Mergel, 2013). So, strategies of SM use by local governments should act on two aspects. First, they must define the type and frequency of information that an official corporate SM account should provide (taking into account the importance of financial information). Second, municipalities must promote the use of these platforms as two-way communication channels where citizens are not merely passive recipients of the information provided but on which their opinions are also heard.
5.3 Limitations and Future Research
This study has analyzed financial transparency from the perspective of the local government –downward transparency, as defined by Heald (2006). Whether citizens use and understand this information needs to be analyzed by future research. A common limitation of web and SM content analyses is that, while they are evolving continuously, the results show a snapshot at a specific time. Future research could analyze financial transparency levels after the entry into force of the Spanish Transparency Act. However, this law only requires disclosures through corporate websites, not through SM. Therefore, its coming into force will not, by itself, foster any change in SM use for financial transparency.
A limitation of this study is that the in-depth analysis of the contents published in Facebook and Twitter was limited to the top-performing cities in IFR. As a manual coding of the contents published in Facebook and Twitter over a 1-year period was carried out, extending the analysis to all the municipalities included in the sample was not feasible due to the time data collection took place. However, tools to automatically extract and classify content from SM platforms have proliferated and are now starting to be applied to analyze content published in SM by local governments (see Bonsón et al, 2019). Therefore, future research could analyze a higher number of municipalities to confirm whether top-performing cities in IRF also lead the way as regards disclosure via SM or not. Future research could also analyze jurisdictions (e.g. the United States and Canada) that have adopted initiatives to make public sector reporting more easily understandable by the majority of users –i.e. popular reporting (Cohen & Karatzimas, 2015). This would help to confirm whether the impact of SM in the public sector follows the common pattern found in e-government (Web 1.0) research: new technology does not automatically generate organizational changes; rather, it is organizational, cultural and/or institutional arrangements that mediate the process of change (Pina et al., 2010; Rodríguez et al., 2015).
6 Conclusions
This paper has evaluated the role of websites and SM to increase the financial transparency of municipalities. Municipalities are aware of the increasing popularity of SM. Having a corporate website is not enough, and most Spanish cities are using Facebook, Twitter or both. However, the use of these platforms for financial disclosures is underdeveloped. Furthermore, advanced features of websites based on Web 2.0 tools for the proactive provision of financial information (such as open data portals or RSS) show very low levels of development. Most of the biggest local governments have created open data portals but, again, the disclosure of budgetary and financial datasets is limited. Therefore, Spanish municipalities still have to make important efforts to increase their levels of financial transparency and promote the re-use of financial information. More pressure from citizens and other stakeholders on local politicians is needed to make their right to downward transparency and clear, structured, understandable and reusable information be a reality. This could also help to reduce the differences between first-class and second-class municipalities as regards financial transparency.
The use of websites and SM for financial transparency by Spanish municipalities is more hype than a revolution. The management-by-law approach usually adopted in Continental Europe seems to lead to a token use of ICTs in the biggest and wealthiest municipalities, while small local governments clearly fail to disclose the required information through their websites. The preeminence of ex-ante budgetary publications suggests the existence of a common disclosure trend in websites and SM, although the former are at a more advanced stage of development. The low level of use of SM to disclose financial information is particularly striking, given their popularity among Spanish citizens and the high citizen demand for increased public financial accountability (ICAEW, 2014).
Local governments are missing a good opportunity to increase financial transparency and promote citizen awareness of local governments’ finances. The regulator should consider what measures should be taken for public sector entities to comply with transparency requirements. Specific incentives or support for medium and small local governments are particularly necessary. Furthermore, a definition of clear, structured, understandable and reusable information would be a necessary starting point to provide a common disclosure framework for public sector entities.
Easy access to relevant and understandable public sector financial information is still a remote ideal. For the moment, most local governments prefer to focus on the diffusion of information that requires the lowest effort rather than improving the timeliness, comparability, re-use and understandability of public sector financial information. Linking transparency laws to the disclosure of public sector information by using ICTs is not enough. A strategy for the use of websites and SM will help to take full advantage of the possibilities offered by ICTs. This strategy should first focus on the concept of transparency, going beyond the mere provision of information to incorporate stakeholder orientation and then deal with how to use the different tools properly to reach citizens and promote their engagement.
Acknowledgements
This study has been carried out with the financial support of the Spanish National Research and Development Plan (projects ECO2015-66240-P and PID2019-106857GB-I00 MINECO/FEDER), the Regional Government of Aragón/FEDER 2014-2020 “Building Europe from Aragón” (project S56-17R), the University of Zaragoza (project UZ2019-SOC-05) and the Spanish Accounting and Business Administration Association (AECA research grant for the period 2015-2016).
Conflict of interests
The authors have no conflict of interest to declare.
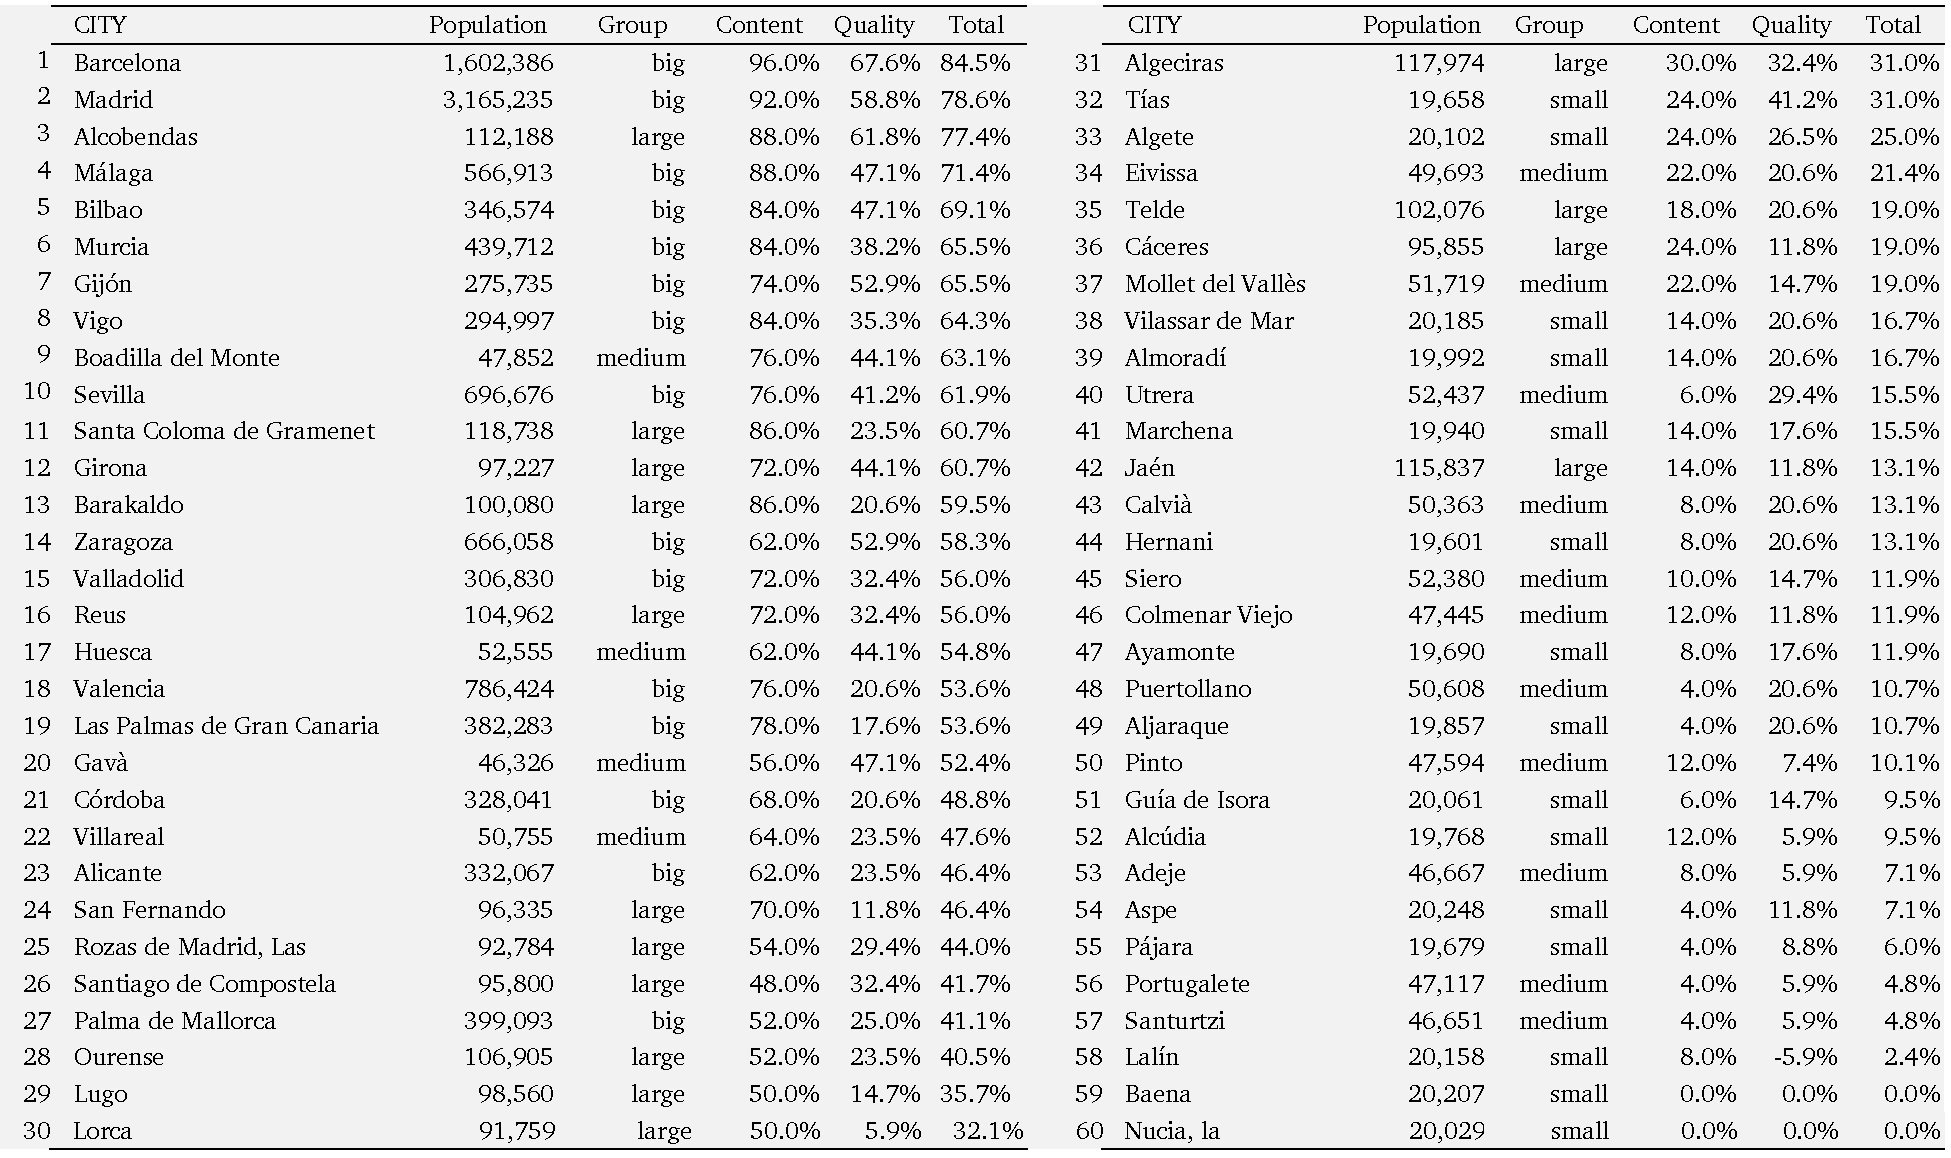
Appendix
Appendix. Financial transparency scores (municipalities ranked by total score)