Sustainability for European investors: Evidence from a sustainable ranking
ABSTRACT
Corporate sustainability implies a broad perspective that suggests the creation of value for stakeholders and requires developing some commitments at the economic, social, environmental and governance levels. Measurement of the level of corporate sustainability occurs via different tools, with sustainable rankings being one of the most popular instruments. However, the impact of these indicators on the market value is controversial. Consequently, our aim is to analyse the influence of the level of sustainability on the market value of a set of companies. To do so, we isolate the impact of the sustainability factor from other series of effects related to the general evolution of financial markets. We have used the information contained in a sustainable ranking: the medal display table provided by RobecoSAM. Our results reveal that investors do not equivalently value the different movements and marks derived from participation in a sustainability ranking.
Keywords: Sustainability, ranking, medal display table, ESG criteria, market value.
JEL classification: M14, G24.
Sostenibilidad para los inversores europeos: Evidencia desde un ranking sostenible
RESUMEN
La sostenibilidad corporativa implica una amplia perspectiva que sugiere la creación de valor para los stakeholders y requiere desarrollar algunos compromisos a nivel económico, social, ambiental y de gobierno. La medición de los niveles de sostenibilidad corporativa tiene lugar a través de diferentes herramientas, siendo los rankings de sostenibilidad uno de los instrumentos más populares. Sin embargo, el impacto de estos indicadores en el valor de mercado es controvertido. Consecuentemente, nuestro objetivo es analizar la influencia del nivel de sostenibilidad sobre el valor de mercado de un conjunto de empresas. Para ello, aislamos el impacto del factor sostenibilidad de otra serie de efectos relacionados con la evolución general de los mercados financieros. Hemos utilizado información contenida en un ranking sostenible: el medallero elaborado por RobecoSAM. Nuestros resultados revelan que los inversores no valorar por igual los diferentes movimientos y calificaciones derivadas de la participación en un ranking sostenible.
Palabras clave: Sostenibilidad, rating, medallero, criterios ESG, valor de mercado.
Códigos JEL: M14, G24.
1 Introduction
Socially responsible investment (SRI) integrates sustainable criteria (environmental, social, and governance) into investment decisions, enables investors to reflect personal values in their portfolio choices, and encourages ethical corporate behaviour (Dawkins, 2018, p.465). This term implies the adoption of a broad perspective where economic, social and, especially, environmental and governance aspects are integrated in the decision-making processes (Asif et al., 2011; Lo & Sheu, 2007). These aspects have been studied under the term corporate sustainability, which is defined as an integrated perspective in which the interdependence among stakeholders is related to management, economic and socio-environmental responsibility, results and capability to obtain consent and resources (Salvioni & Gennari, 2016). Moreover, it considers the integration of new challenges, such as planetary boundaries and sustainable development goals, into the core business model of modern organizations (Whiteman et al., 2013; Bebbington & Unerman, 2018; Schaltegger & Burritt, 2018).
This integrated perspective, known as the business case for sustainability, requires the development of different measurement instruments to assess the level of performance (Engida et al., 2018). In recent years, diverse types of organizations have developed these instruments, such as rating agencies, information providers, rankings, and sustainability indices (Paredes-Gazquez et al., 2016, p. 143). They are based on the design of inclusion (exclusion) criteria, theoretically providing market valuation about the level of corporate sustainability achieved (Amini & Bienstock, 2014). The screening criteria depend on the assessment developed by sustainability and social rating agencies, such as KLD Research and Analytics, Ethical Investment Research Services (EIRIS), RobecoSAM or Vigeo, among others (Avetisyan & Hockerts, 2017). These entities assess both the level of commitment with sustainable practices (positive screening) and the level of development of bad practices (negative screening). These scores are adopted as a reference by the investors and other agents operating in financial markets.
In this sense, financial markets and investors have been aware of the appearance and growth of SRI, demanding higher levels of sustainable commitment from companies (Cowton & Sandber, 2012; Gallego-Álvarez et al., 2018). Despite this original purpose, the empirical evidence is not conclusive about the reaction of financial markets in relation to assessments made by investors about corporate sustainability (Székely & Knirsch, 2005). Different reasons have been provided to explain these controversial results. Thus, the previous studies have considered possible explanations, such as the measurement instruments considered to proxy sustainability, heterogeneous samples and methodological standings, among others (Ortas & Moneva, 2011, p.399; Lu et al., 2014, p. 197; Gallego-Álvarez et al., 2018, p. 207; Jain et al., 2019, p. 3). However, these controversial results could also be explained by the conjunction in the identification and assessment of a company as sustainable of two elements, the level of sustainability achieved by the company itself and general evolution of the financial markets. Thus, inclusion (exclusion) in the different ratings, rankings and indices of a company would depend on both aspects, although this differentiation has not been deeply analysed by previous literature.
Therefore, our aim is to analyse the influence of the level of sustainability on the market value of a set of companies. To do so, we isolate the impact of the sustainability factor from other series of effects related to the general evolution of financial markets. In particular, in this study, we analyse the impact of obtaining a mark as sustainable on the price of an asset in a sample of European companies. This mark is based on the inclusion (exclusion) in the yearbook provided by RobecoSam. This ranking classifies the most sustainable companies in the world according to a medal display table (gold, silver, bronze and member). The specified modelling enables us to observe the effect related to the reporting of this classification isolated from the remaining noise effects linked to the indexation. This study contributes to the debate about the impact of corporate sustainability in European stock markets, considering the new challenges of corporate sustainability in relation to the planetary boundaries and sustainable development goals. Second, following other authors, we introduce a two-step approach based on space-state models, enabling the study of the level of corporate sustainability isolated from other external factors. Finally, we provide investors with relevant results for decision-making processes in relation to market value maximization derived from the implementation of sustainability practices.
The remainder of this paper is structured as follows. The following section develops a literature review and shows our working hypotheses. In the third section, data, variables, and methodology are introduced to test the proposed hypotheses. The fourth section presents the main results. The fifth section discusses the results and provides some conclusions.
2 Literature review and working hypotheses
2.1 Corporate sustainability: A business case
Currently, the term CSR is usually associated with corporate sustainability (Van Marrewijk, 2003; Lo & Sheu, 2007; Correa & Moneva, 2011; Gallardo-Vázquez et al., 2013; Larrán et al., 2018). However, it is important to consider that both terms are different. Andreu & Fernández (2011), Lozano (2011, 2015) and Amini & Bienstock (2014), Bonilla-Priego et al. (2017), among others, define corporate sustainability as the natural progress of the CSR concept, whose objective is related to value creation and the core business of each company. Under this approach, companies pursue the maximum value creation for their stakeholders that requires developing some commitments at the economic, social and environmental levels. In this sense, Schaltegger & Burritt (2018, p.242) highlight that CSR refers to a company’s voluntary social and environmental activities in societal interactions, whereas corporate sustainability also considers planetary boundaries and integrates UN Sustainable Development Goals together with complementary social and organizational boundaries (Antonini & Larrinaga, 2017; Leach et al., 2013)1.
This notion of corporate sustainability is based on stakeholder theory (Hörisch et al., 2014). Stakeholder theory postulates the influence of some agents on the organizations and that of the organizations on these agents (Freeman, 1984). This proposal has been recently updated, assessing not only the management of stakeholder relationships but the mutual interests between them (Freeman & Philips, 2002; Freeman et al., 2010). So, Hörisch et al. (2014, p.341) link the integration of mutual stakeholder interests and corporate sustainability, concluding that corporate sustainability can be approached with a stakeholder mindset, cooperation among stakeholders being underlined as the most important organizational value.
Consequently, cooperation is the core element in the business case for sustainability (Whelan & Fink, 2016; Matinato & Liu, 2017; Roca-Puig, 2019). It has “the purpose to and does realize economic success through an intelligent design of voluntary environmental and social activities” (Schaltegger et al., 2012, p.98). Three requirements are necessary to consider a business case for sustainability: a) voluntary activity with the intention to contribute to the solution of societal or environmental problems; b) positive business effect; and c) certain management activity (Lüdeke-Freund et al., 2017). However, although these requirements are a necessary condition, the value creation for their stakeholders depend on how different drivers of the business case for sustainability are addressed (Schaltegger & Burritt, 2018, p. 249). Six drivers have been considered by previous economic literature2, highlighting reputation and brand value (Rauter et al., 2017; Harjoto & Salas, 2017).
This driver requires the development of specific sustainability management tools. Generally, these tools are defined as management methods that serve the purpose of implementing corporate sustainability (Hahn & Scheermesser, 2006; Hörisch et al., 2015). Informational systems and accounting, as a sustainable management tool, allow stakeholders to be informed, compare different options and assess sustainability impacts, being a pillar in relation to the reputation and brand value of a sustainable company and improving risk and credit rating (Schaltegger et al., 2017, 2012). Then, different measurement instruments are developed, as innovations of accounting and reporting, to assess the level of sustainability performance (Álvarez Etxeberria et al., 2017; Makarenko & Plastun, 2017; Bebbington & Unerman, 2018; Schaltegger, 2018). These measurement instruments will consider economic, social, environmental and governance criteria to identify a company as sustainable, mixing science-based, societal and organizational aims (Hussain et al., 2018, p. 429).
2.2 Corporate sustainability measurement
Financial markets and investors need to develop measurement instruments to report about the levels of corporate sustainability achieved by a company. Measurement criteria related to corporate sustainability and their impact on the value of a company have been the subject of extensive research (Searcy & Elkhawas, 2012; Gray & Herremans; 2012; Delmas & Blass, 2010; Chatterji & Levine, 2006). Sustainability stock exchange indices3 are highlighted as one of the most useful instruments (Pintér et al., 2018; Ortas et al., 2013) because they provide a comparison in relation to a benchmark, immediate access to a market valuation and result in higher information quality about the economic, social, environmental and governance aspects underlying corporate sustainability (Orsato et al., 2015, p.163).
These indices are based on the indicators and rankings provided by social agencies, such as Vigeo-Eiris (FTSE4Good Indices, Euronext Vigeo-Eiris Indices), MSCI (MSCI Socially Responsible Indices) and RobecoSAM (Dow Jones Sustainability Indices), among others (Avetisyan & Hockerts, 2017, p.320). These agencies assess different aspects related to planetary boundaries but also with social and organizational sides. Table 1 shows the specific aspects together with the themes promoted by each agency.
Table 1. Planetary boundaries, sustainable development goals and social agencies
| Aspect | Planetary boundaries(*) | Sustainable Development Goals(**) | Social agencies and indicators(***) | ||
|---|---|---|---|---|---|
| RobecoSAM | Vigeo-Eiris | MSCI | |||
| Environmental | Climate change | Climate action | Environmemntal reporting Environmental policy & management systems Operational eco-efficiency Climate strategy | Environment | Climate change Natural resource Pollution & waste Environmental opportunities |
| Biodiversity loss | Life on land | ||||
| Nitrogen and phosphorus cycle | Responsible consumption and production | ||||
| Stratospheric ozone depletion | Affordable and clean energy | ||||
| Ocean acidification | Life bellow water | ||||
| Global freshwater use | Clean water and sanitation | ||||
| Change in land use | Sustainable cities and communities | ||||
| Atmospheric aerosol loading | Affordable and clean energy | ||||
| Chemical pollution | Sustainable cities and communities | ||||
| Social | Income and social equity | No poverty | Reporting Labour practices indicators Human rights Human capital development Talent attraction& retention Corporate citizenship & philanthropy Ocupational health & safety | Community involvement Human rights Human resources | Human capital Product liability Stakeholders opposition Social opportunities |
| Food and water | Zero hunger | ||||
| Health | Good health and well-being | ||||
| Gender equality | Gender equality | ||||
| Education | Quality education | ||||
| Jobs | Decent work and economic growth | ||||
| Energy | Industry innovation and infrastructure | ||||
| Voice | Peace, justice and strong institutions | ||||
| Resilience | Patnerships for the goals | ||||
| Governance | Organizational and operational impacts | Stakeholders’ participation Sustainability value creation | Corporate governance Materiality Risk Code of business conduct Costumer relationships Policy influence Brand management Tax management Cybersecurity Privacy protection | Business behavior Governance | Corporate Governance Corporate behaviour |
(*) Rockström et al. (2009), Whiteman et al. (2013), Leach et al. (2012), Antonini & Larrinaga (2017)
(**) Bebbington & Unerman (2018)
(***) MSCI ESG Ratings Methodology (2018), Vigeo Eiris’ Environmental, Social and Governance assessment methodology (2018), Measuring Intangibles: RobecoSAM’s Corporate Sustainability Assessment Methodology
It is possible to observe that planetary boundaries and sustainable development goals consider environmental, social and organizational aspects, these elements being assessed by the social agencies. However, they use different denominations and methodologies to evaluate the level of corporate sustainability. Its working is based on assessment programmes, an annual evaluation of sustainability practices in private companies (Singh et al., 2012). Each year, different companies belonging to diverse industries worldwide participate in these evaluations. The classification depends on the information provided by the companies themselves. The assessed aspects are related to the industry in which they work together with economic, social, environmental and governance factors that condition the success of a company (Escrig-Olmedo et al., 2019).
The results obtained enable these agencies to elaborate ratings and rankings. Thus, Vigeo-Eiris designs a system based on four categories (advanced, good, limited and weak), MSCI elaborates on a scale based on letter ranking (AAA-CCC), while RobecoSAM establishes a classification under the form of a medal display table (gold, silver, bronze and member). In this latter case, the classification enables the elaboration of the Sustainability Yearbook, which is the core of the development of the main DJSI indices that are also provided by this entity.
These measurement instruments allow investors to monitor the evolution of sustainable companies (Muñoz-Torres et al., 2019). At the same time, they have been key in the creation of mutual funds that develop investment policies or strategies based on participation in sustainable companies. The use of these indicators is motivated by three factors: a) individual investors and institutions who design their investment strategies to simultaneously integrate economic returns and environmental, social and governance impacts, b) the correlation between the creation of value in the long term and better risk management related to sustainability practices; and c) the elaboration of sustainability stock exchange indices depending on the assessment made by each social agency (López et al., 2007, p.289). These factors can explain the proliferation of these rankings as measurement instruments.
The implementation and use of these tools remain a challenge and their roles in the creation of market value have not been extensively analysed (Searcy & Elkhawas, 2012, p. 247). In particular, there could be differences between the level of corporate sustainability provided by a social agency and real impact that sustainable practices cause in a company in terms of value.
2.3. Working hypotheses
Different studies have analysed the effect of sustainability information on the market value of a company. The most common analysis studies the effect of inclusion, exclusion or persistence on the market return of a company included in a sustainable stock exchange index, such as DJSI4, FTSE4Good5 and DSI400. In the European context6, the results obtained are contradictory. Skare & Golja (2012) found a positive relationship between the appearance of a company in the DJSI index and financial performance in a sample of 45 multinational companies. Consolandi et al. (2009) explored the response of European stock markets when a company was included (excluded) in the DJSI index during 2001-2006. The authors obtain a positive reaction when a company is included and a negative one when the company is excluded. More recently, Luffarelli & Awaysheh (2018) examine the effects of signals from the DSI 400 index when a firm is endorsed or repudiated. Their findings show that sustainable practices have an effect on firm value. In addition, the movement (i.e., inclusion vs. exclusion) and content (i.e., specific social domain) of an announcement are important predictors of the magnitude of market reactions. Similar results, using sustainable indices, can be found in Oh & Park (2015), Wu & Shen (2013) and Boesso et al. (2013), among others. In contrast, Coombs & Gilley (2005) and Roca (2013) show a negative correlation between the appearance in a sustainable stock market index and financial performance. This same result was obtained by Oberndorfer et al. (2013) who found that financial markets tended to penalize a company for its inclusion in a sustainability index. This study was based on the DJSI Stoxx and DJSI Word sustainable indices for a sample of German-listed companies. Finally, some authors find no significant impact of sustainable practices. In this sense, Curran & Moran (2007) examined UK firms with respect to their inclusion in the FTSE4Good UK 50 Index. Their results show that positive and negative announcements have the expected effects on daily returns. Nevertheless, these movements are not significant and do not suggest that a firm’s presence on a sustainable indicator brings it any significant financial returns to signal its corporate social responsibility. Ortas & Moneva (2011) show that the information related to the inclusion (exclusion) of a company in a sustainable indicator is not assessed by financial markets, obtaining a non-significant effect. Additionally, Becchetti et al. (2008) highlight a positive effect on the market value of a company only if there is persistence over a period of time, this positive effect being an indicator of the level of effort undertaken by a company to develop sustainable practices. These results show important limitations, as some authors have underlined. Thus, some companies can be included or excluded in these indices due to changes in their market values and other financial aspects that are not related to their levels of sustainability (Kaspereit & Lopatta, 2016). Moreover, companies could be included or excluded in these indicators independent of their sustainable performance if they are part of a competitive sector in terms of the composition of sustainability measurements (Curran & Moran, 2007; Becchetti et al., 2008; Consolandi et al., 2009). The evaluation and selection processes of a sustainable indicator can also influence these results because there is no standardization (Oberndorfer et al., 2013; Ziegler & Schröder, 2010). Furthermore, the inclusion in a sustainability indicator can also be perceived by investors as a symbolic element without financial impact (Cañón-de-Francia & Garcés-Ayerbe, 2009).
However, there is limited empirical evidence on the impact of the inclusion, exclusion or persistence in a social ranking although the different sustainable stock market indices are based on them. Among these scarce studies, Liang & Renneboog (2017, p. 875) analyze the interaction between the MSCI letter rankings and market value of 23,000 companies, concluding that market valuation is not related to the level of sustainability. Cellier et al. (2016) focus on the sustainability announcement made by Vigeo on European markets and evidence that there are no effects from the announcements (inclusion, exclusion and persistence) using event study methodology. In contrast, Harjoto & Laksmana (2018) find a positive interaction between the MSCI letter rankings and market value in a sample comprising 1,718 US firms. A similar result can be found in Kespereir & Lopatta (2016). Furthermore, according to previous studies, the inclusion of a company in a ranking could have two possible effects depending on the considered term. In the short term, the inclusion should provide a positive sign to financial markets (Wang & Chen, 2017, p. 196). In this sense, the inclusion in a ranking will enhance the reputation of a company and its competitive position due to the alignment between corporate strategies and social norms and expectations (Arya & Zhang, 2009; Cheung, 2011; Cheung & Roca, 2013). However, a non-significant sign could also be possible. Oberndorfer et al. (2013) discuss that the underlying rationale of sustainability would suggest expected future profits without any effect on the short term. Similarly, the exclusion of a company in an index should negatively affect the levels of financial performance in the short term (Pineiro-Chousa et al., 2019). In this sense, Russo & Mariani (2013) highlight that exclusion has two negative meanings. First, it is perceived as a proxy of a poor reputation because investors do not perceive a reasonable level of sustainable commitment; second, it is also a sign of a bad financial performance because this aspect is assessed by social agencies. Moreover, non-inclusion could also be perceived as a limitation in the development of brand value as a driver of the sustainability business case, although this limitation could be manifested in the long term (Ortas & Moneva, 2011; Cellier et al., 2016; Liang & Renneboog, 2017). In relation to the persistence, Lima et al. (2018) underline that a high firm persistence in composing a sustainability indicator is linked to high development in the implementation of sustainable practices. Consequently, the continuous participation of a company in a sustainability index should be perceived as a positive sign by investors and financial markets, which would be related to the long-term perception as evidenced by some authors (e.g., Surroca, 2010; Endrikat et al., 2014). Finally, a negative sign related to the inclusion and persistence (positive for exclusion) would also be possible despite the evolution of financial agents to assess sustainability practices as something positive in the short and the long term (Ioannou & Serafeim, 2017). In this sense, Bhardwaj et al. (2018) highlight that “CSR programmes can be costly and also they can compete for firms' limited financial resources for marketing activities such as new product development and advertising”.
Then, as we have exposed, previous studies demonstrate and discuss opposite signs, even with similar samples, in relation to the inclusion, persistence and exclusion of a company in a sustainability index. Moreover, this effect has not been isolated from other possible causes of variation in terms of market valuation using sustainability rankings, such as the RobecoSAM medal display table. Thus, we propose the following working hypotheses7,
H1: The appearance of a company in the medal display table is associated with an abnormal return.
H1.1: The inclusion of a company in the medal display table is associated with a positive abnormal return.
H1.2: Persistence in the medal display table is associated with a positive abnormal return.
H1.3: The exclusion of a company from the medal display table is associated with a negative abnormal return.
The non-rejection of H1.1 and H1.2 implies that investors positively value the participation and persistence of a company in a sustainability indicator, as asserted by Harjoto & Laksmana (2018). Similarly, the non-rejection of H1.3 supposes that the exclusion of a company will be penalized by financial markers in line with Consolandi et al. (2009) and Russo & Mariani (2013). In contrast, the rejection of these hypotheses means that obtaining a position in the medal display table (gold, silver, bronze or member) has no positive effect (inclusion/persistence) or negative (exclusion) on market prices, being perceived as purely symbolic (Cañón-de-Francia & Garcés-Ayerbe, 2009; Cellier et al., 2016; Liang & Renneboog, 2017; Bhardwaj et al., 2018).
3 Database and methodology
3.1 Database
The identification of sustainable companies is based on the “Yearbook” annually published by RobecoSam. This ranking classifies a company as sustainable using a medal display table (gold, silver, bronze and member). The “Sustainability Yearbook 2017” catalogues 470 companies from 32 different countries as the most sustainable companies in the world. We have analysed European companies whose countries are part of the Dow Jones Sustainability Europe Index8. Table 2 shows the number of European companies that have participated in this ranking of sustainable companies during 2008-2017. These entities comprise our sample.
Table 2. Number of European companies in RobecoSAM raking (2008-2017)
| UK | FR | GE | SP | NL | SW | IT | FL | SD | NW | DK | PT | BG | LX | AU | Total | % G | %S | %B | %M | ||
|---|---|---|---|---|---|---|---|---|---|---|---|---|---|---|---|---|---|---|---|---|---|
| 2008 | Total | 63 | 26 | 23 | 17 | 15 | 14 | 7 | 7 | 6 | 5 | 4 | 3 | 2 | 0 | 0 | 193 | 22,80 | 20,73 | 18,13 | 38,34 |
| G | 8 | 4 | 10 | 5 | 5 | 5 | 2 | 1 | 1 | 2 | 1 | 0 | 0 | 0 | 0 | ||||||
| S | 11 | 6 | 2 | 6 | 4 | 2 | 1 | 3 | 1 | 1 | 1 | 1 | 0 | 0 | 0 | ||||||
| B | 17 | 2 | 5 | 4 | 2 | 3 | 1 | 0 | 0 | 0 | 0 | 1 | 0 | 0 | 0 | ||||||
| 2009 | Total | 65 | 27 | 22 | 20 | 12 | 11 | 11 | 7 | 8 | 5 | 5 | 3 | 2 | 0 | 1 | 200 | 27,00 | 14,00 | 19,00 | 40,00 |
| G | 11 | 5 | 10 | 9 | 5 | 5 | 2 | 1 | 2 | 2 | 1 | 0 | 0 | 0 | 0 | ||||||
| S | 9 | 5 | 3 | 3 | 0 | 1 | 2 | 2 | 1 | 1 | 0 | 1 | 0 | 0 | 0 | ||||||
| B | 12 | 3 | 4 | 6 | 6 | 1 | 3 | 2 | 0 | 0 | 1 | 0 | 0 | 0 | 0 | ||||||
| 2010 | Total | 57 | 32 | 27 | 22 | 13 | 14 | 14 | 8 | 8 | 6 | 4 | 4 | 2 | 1 | 0 | 213 | 28,17 | 19,25 | 18,31 | 34,27 |
| G | 12 | 5 | 14 | 8 | 6 | 5 | 3 | 1 | 1 | 1 | 2 | 1 | 0 | 0 | 0 | ||||||
| S | 9 | 8 | 3 | 4 | 3 | 2 | 4 | 3 | 2 | 1 | 1 | 1 | 0 | 0 | 0 | ||||||
| B | 13 | 5 | 5 | 4 | 0 | 4 | 4 | 1 | 0 | 2 | 0 | 0 | 1 | 0 | 0 | ||||||
| 2011 | Total | 56 | 28 | 26 | 20 | 14 | 13 | 14 | 8 | 7 | 4 | 5 | 3 | 1 | 1 | 0 | 201 | 26,87 | 23,88 | 21,39 | 27,86 |
| G | 11 | 3 | 10 | 6 | 7 | 5 | 6 | 1 | 0 | 1 | 2 | 2 | 0 | 0 | 0 | ||||||
| S | 10 | 7 | 8 | 8 | 1 | 3 | 2 | 3 | 4 | 1 | 0 | 0 | 0 | 0 | 0 | ||||||
| B | 13 | 4 | 5 | 5 | 2 | 3 | 3 | 3 | 0 | 2 | 2 | 0 | 0 | 1 | 0 | ||||||
| 2012 | Total | 53 | 30 | 28 | 19 | 16 | 12 | 15 | 8 | 8 | 4 | 5 | 4 | 2 | 1 | 1 | 207 | 24,64 | 10,63 | 19,32 | 45,41 |
| G | 10 | 5 | 10 | 5 | 6 | 3 | 6 | 1 | 1 | 0 | 3 | 1 | 0 | 0 | 0 | ||||||
| S | 5 | 1 | 3 | 3 | 1 | 2 | 1 | 2 | 0 | 1 | 0 | 1 | 0 | 1 | 0 | ||||||
| B | 8 | 9 | 6 | 5 | 2 | 2 | 4 | 1 | 2 | 0 | 0 | 0 | 1 | 0 | 0 | ||||||
| 2013 | Total | 56 | 30 | 26 | 21 | 15 | 14 | 14 | 9 | 9 | 5 | 4 | 4 | 4 | 1 | 0 | 213 | 15,02 | 15,02 | 22,07 | 47,89 |
| G | 5 | 4 | 5 | 4 | 4 | 2 | 2 | 1 | 1 | 0 | 1 | 1 | 1 | 1 | 0 | ||||||
| S | 8 | 3 | 3 | 3 | 4 | 1 | 5 | 1 | 0 | 1 | 1 | 2 | 0 | 0 | 0 | ||||||
| B | 9 | 9 | 9 | 7 | 1 | 2 | 3 | 2 | 2 | 2 | 1 | 0 | 0 | 0 | 0 | ||||||
| 2014 | Total | 52 | 35 | 24 | 19 | 18 | 14 | 14 | 10 | 7 | 5 | 3 | 4 | 4 | 1 | 0 | 210 | 14,29 | 17,14 | 19,52 | 49,05 |
| G | 4 | 5 | 7 | 1 | 2 | 4 | 2 | 1 | 1 | 0 | 1 | 1 | 1 | 0 | 0 | ||||||
| S | 9 | 5 | 3 | 4 | 5 | 2 | 2 | 2 | 0 | 2 | 1 | 0 | 0 | 1 | 0 | ||||||
| B | 8 | 5 | 4 | 5 | 4 | 3 | 4 | 3 | 1 | 1 | 0 | 3 | 0 | 0 | 0 | ||||||
| 2015 | Total | 50 | 33 | 26 | 19 | 17 | 16 | 13 | 9 | 10 | 4 | 3 | 4 | 3 | 2 | 0 | 209 | 15,31 | 13,88 | 22,97 | 47,85 |
| G | 7 | 5 | 3 | 1 | 4 | 4 | 4 | 1 | 1 | 0 | 0 | 1 | 1 | 0 | 0 | ||||||
| S | 5 | 2 | 3 | 5 | 4 | 3 | 2 | 1 | 1 | 1 | 1 | 1 | 0 | 0 | 0 | ||||||
| B | 11 | 10 | 9 | 6 | 2 | 4 | 1 | 4 | 0 | 0 | 1 | 0 | 0 | 0 | 0 | ||||||
| 2016 | Total | 46 | 35 | 25 | 19 | 19 | 13 | 12 | 9 | 9 | 3 | 3 | 3 | 3 | 0 | 0 | 199 | 17,59 | 15,08 | 24,12 | 43,22 |
| G | 6 | 9 | 2 | 2 | 6 | 5 | 1 | 1 | 2 | 0 | 0 | 0 | 1 | 0 | 0 | ||||||
| S | 4 | 7 | 5 | 3 | 1 | 3 | 4 | 2 | 0 | 0 | 1 | 0 | 0 | 0 | 0 | ||||||
| B | 14 | 3 | 8 | 6 | 6 | 3 | 3 | 0 | 0 | 1 | 2 | 1 | 1 | 0 | 0 | ||||||
| 2017 | Total | 40 | 36 | 23 | 19 | 21 | 14 | 12 | 9 | 10 | 2 | 4 | 2 | 2 | 0 | 0 | 194 | 18,56 | 24,74 | 20,62 | 36,08 |
| G | 3 | 7 | 6 | 4 | 5 | 6 | 1 | 1 | 1 | 1 | 0 | 0 | 1 | 0 | 0 | ||||||
| S | 11 | 10 | 6 | 5 | 2 | 4 | 3 | 2 | 2 | 0 | 1 | 2 | 0 | 0 | 0 | ||||||
| B | 7 | 7 | 6 | 3 | 8 | 0 | 2 | 2 | 2 | 1 | 2 | 0 | 0 | 0 | 0 |
G (Gold Class); S (Silver Class); B (Bronze Class); M (Member)
As observed in the previous table, the number of European companies varies from 193 to 213 during the analysed period. The United Kingdom, France, Germany, Spain and the Netherlands make up the “top five” European countries with the most companies in this ranking. The distribution of the medal display table is also shown. The United Kingdom, Germany and Spain have obtained the greatest number of gold medals, followed by France, the Netherlands, Italy and Sweden. In relation to the economic sector, based on Thomson Reuters Business Classification, we highlight the financial sector, followed by industrial, consumer cyclicals and basic materials.
To test our working hypotheses, we have obtained information related to market prices and other variable characteristics of each company. To do so, we have used DataStream, SSI (Sustainable Society Index) and the dimensions proposed by Hofstede (2011). These sources enable us to classify different countries according to their observed level of sustainability.
3.2 Main variables
3.2.1 Corporate sustainability
Corporate sustainability is a complex concept, whose measurement admits different alternatives (Lu et al; 2014; Soana, 2011; Moneva & Ortas, 2010). Hörisch et al. (2015, p. 244) identify four possible measurement instruments: a) accounting tools; b) product design tools; c) communication tools; and d) sustainability indicators. In this study, we propose the use of the RobecoSAM Yearbook, as a sustainability indicator, because this tool includes a public assessment made by a social agency that provides a classification about the level of sustainability achieved by a set of companies. This instrument has some advantages in relation to the other alternatives. In this sense, accounting tools suppose the design of a specific system of information for a company in which diverse flows are measured. Although this is the objective criterion, information disclosed by these tools is only a proxy and may be insufficient to study this element in its entirety (Farneti & Guthrie 2009; López-Arceiz et al., 2018b). Product design tools are based on supply chain management, implying assessing the private information inherent in an organization (Qian et al., 2018). Finally, communication tools imply the elaboration and disclosure of information by the company itself without any assessment made by third parties.
RobecoSAM has annually published “The Sustainability Yearbook” since 2008. The “Yearbook” contains a ranking of 15% of the most sustainable companies in different industries. These companies are classified in the following categories:
RobecoSAM gold class: Companies with a minimum mark of 60, representing 1% of the companies with better sustainable performance.
RobecoSAM silver class: Companies with a minimum mark of 57, representing between 1% and 5% of the companies with better sustainable performance.
RobecoSAM bronze class: Companies with a minimum mark of 54, representing between 5% and 10% of the companies with better sustainable performance.
RobecoSAM member class: This category identifies those companies that are not included in the medal classification, represent 15% of companies with better sustainable performance within each industry and have improved their sustainable performance by a representative proportion in comparison to the previous year.
In this study, we have codified these levels in a categorical variable where values 1 to 4 represent gold, silver, bronze and member, respectively. This variable enables us to build a set of dummy variables) to measure the appearance, inclusion, exclusion and persistence of a company in the medal display table. Particularly, we have considered four dummy variables related to the medal display table and four others related to the gold medal. Each dummy variable takes one value in the following cases. The variable Di measures the appearance of a company in the medal display table (gold, silver, bronze or member) in the RobecoSAM Yearbook in the year t, and DEi considers the inclusion of a company in the medal display table in the RobecoSAM Yearbook (gold, silver, bronze or member). A company is considered included when it is in the medal display table in year t, but it was not in year t-1. DSiconsiders the exclusion of a company in the medal display table in the RobecoSAM Yearbook (gold, silver, bronze or member). Exclusion implies the failure to obtain a medal during year t when one had been obtained in year t-1. Finally,DPi measures the level of persistence in the analysed period in the RobecoSAM Yearbook (gold, silver, bronze or member). The persistence consists of the repeat appearance of a company in the medal display table during two consecutive periods (t, t-1). The same variables and codes have been defined in relation to the appearance, inclusion, exclusion and persistence in the gold medal category.
3.2.2 Fama & French’s factors
To answer our working hypotheses, the definition of three variables was required. The construction of these variables is based on Fama & French (1993):
RMF (excess return on the market): This variable was calculated as the value-weight return of firms listed on the stock market minus the 1-month treasury bill rate (from Ibbotson Associates).
SMB (small minus big): Average return on three small portfolios minus the average return on three big portfolios. This factor (Fama & French, 1993) was built using six value-weight portfolios, according to size and book-to-market ratio.
HML (high minus low): Average return on two value portfolios minus the average return on two growth portfolios. This factor (Fama & French, 1993) was built using four value-weight portfolios, according to the price-to-earnings ratio.
3.2.3 Control variables
Different studies have shown the existence of certain characteristics of firms that can influence the level of return of a company. This study, based on Ortas & Moneva (2011), Adetunji & Owolabi (2016), Rani & Zergaw (2017) and Chen et al. (2017), includes control variables related to the size of a company: industry growth rate and capital intensity. The industry growth rate has been computed as the annual increase of sales during the year of analysis, while the capital intensity has been defined by the assets to sales ratio. Capital intensity has been included as an indicator for size considering that large companies will obtain higher levels of return (Audretsch et al., 2004, p.338). The industry growth rate based on sales could also have a positive effect in terms of return according to Soytas et al. (2016).
Moreover, we have considered the different cultural origins of the companies in the sample. Based on López-Arceiz et al. (2018a), Ortas et al. (2012), Reaz & Hossain (2007), La Porta et al. (1997, 1998), we have identified four groups: Scandinavian (G1), German (G2A), Anglo-Saxon (G2B), and Mediterranean (G3). The composition and characteristics of each group are shown in Annex 2, this classification being consistent with the assessment developed by SSI. In this sense, those countries belonging to G1 have obtained the highest levels, countries in G2 had medium values, while countries in G3 showed the lowest values in this ranking. The cultural values of each country have also been approached through Hofstede’s classification (2011). This author distinguished six indicators: power distance, individualism, femininity, uncertainty avoidance, long-term orientation and indulgence.9 The values estimated by this author have been used in several papers in the accounting framework research (e.g., Lee & Herold, 2018; Nurunnabi, 2015; Fearnley & Gray, 2015).
Finally, we have introduced the activity as a control variable. Deegan & Gordon (1996), Archer (2003) and García-Ayuso & Larrinaga (2003) identify a strong influence of the developed activity on the level of CSR disclosure implemented by the company. In this sense, Prado et al. (2009) evidence that companies with a larger impact on the environment are those who provide more information to their stakeholders. Consequently, we have defined ten categories based on Thomson Reuters Business Classification: a) energy; b) basic materials; c) industrials; d) consumer cyclicals; e) consumer non-cyclicals; f) financial healthcare; g) technology; h) telecommunication services; and i) utilities. Table 3 shows the distribution of this variable in the whole sample and in relation to the cultural origin based on SSI Index and Hofstede dimensions.
Table 3. Cultural origin and activity
| Panel A. Cultural origin based on SSI index | |||||||
|---|---|---|---|---|---|---|---|
| Activity | Scandinavian | German | Anglo-saxon | Mediterranean | Total | ||
| Energy | 0,3% | 0,9% | 3,3% | 2,4% | 7,0% | ||
| Basic Materials | 1,5% | 3,3% | 2,7% | 3,6% | 11,2% | ||
| Industrials | 1,8% | 4,3% | 5,2% | 6,4% | 17,6% | ||
| Consumer Cyclicals | 2,7% | 3,3% | 4,3% | 5,5% | 15,8% | ||
| Consumer Non-Cyclicals | 0,9% | 1,2% | 2,7% | 2,4% | 7,3% | ||
| Financials | 2,1% | 7,6% | 6,1% | 6,7% | 22,5% | ||
| Healthcare | 1,2% | 2,1% | 0,9% | 0,9% | 5,2% | ||
| Technology | 0,3% | 0,9% | 0,6% | 1,5% | 3,3% | ||
| Telecommunication Services | 0,9% | 1,2% | 0,3% | 1,8% | 4,3% | ||
| Utilities | 0,9% | 0,9% | 1,2% | 2,7% | 5,8% | ||
| Total | 12,8% | 25,8% | 27,4% | 34,0% | 100,00% | ||
| Panel B. Cultural origin based on Hofstede’s dimensions(†) | |||||||
| Activity | Power Distance | Individualism | Masculinity | Total | |||
| Low | High | Low | High | Low | High | ||
| Energy | 4,0% | 3,0% | 2,5% | 4,5% | 2,8% | 4,2% | 7,0% |
| Basic Materials | 6,0% | 5,2% | 7,1% | 4,1% | 6,6% | 4,6% | 11,2% |
| Industrials | 11,1% | 6,5% | 10,5% | 7,1% | 7,4% | 10,2% | 17,6% |
| Consumer Cyclicals | 9,9% | 5,9% | 9,0% | 6,8% | 8,4% | 7,4% | 15,8% |
| Consumer Non-Cyclicals | 4,5% | 2,8% | 3,0% | 4,3% | 3,0% | 4,3% | 7,3% |
| Financials | 14,5% | 8,0% | 12,3% | 10,2% | 8,6% | 13,9% | 22,5% |
| Healthcare | 3,4% | 1,8% | 3,3% | 1,9% | 2,8% | 2,4% | 5,2% |
| Technology | 1,2% | 2,1% | 2,2% | 1,1% | 2,5% | 0,8% | 3,3% |
| Telecommunication Services | 1,8% | 2,5% | 1,8% | 2,5% | 2,8% | 1,5% | 4,3% |
| Utilities | 2,7% | 3,1% | 4,0% | 1,8% | 3,7% | 2,1% | 5,8% |
| Total | 59,1% | 40,9% | 55,7% | 44,3% | 48,6% | 51,4% | 100,00% |
| Panel C. Cultural origin based on Hofstede’s dimensions(†) | |||||||
| Activity | Uncertainty avoidance | Long-term orientation | Indulgence | Total | |||
| Low | High | Low | High | Low | High | ||
| Energy | 4,3% | 2,7% | 4,9% | 2,1% | 2,8% | 4,2% | 7,0% |
| Basic Materials | 5,6% | 5,6% | 4,9% | 6,2% | 5,3% | 5,9% | 11,2% |
| Industrials | 8,6% | 9,0% | 10,2% | 7,4% | 9,3% | 8,3% | 17,6% |
| Consumer Cyclicals | 8,1% | 7,7% | 8,1% | 7,7% | 7,8% | 8,0% | 15,8% |
| Consumer Non-Cyclicals | 3,7% | 3,6% | 3,7% | 3,6% | 3,7% | 3,6% | 7,3% |
| Financials | 11,7% | 10,8% | 10,5% | 12,0% | 11,1% | 11,4% | 22,5% |
| Healthcare | 3,4% | 1,8% | 1,9% | 3,3% | 1,9% | 3,3% | 5,2% |
| Technology | 1,8% | 1,5% | 1,4% | 1,9% | 1,8% | 1,5% | 3,3% |
| Telecommunication Services | 2,1% | 2,2% | 1,8% | 2,5% | 2,4% | 1,9% | 4,3% |
| Utilities | 1,8% | 4,0% | 3,6% | 2,2% | 4,0% | 1,8% | 5,8% |
| Total | 51,1% | 48,9% | 51,1% | 48,9% | 50,1% | 49,9% | 100,00% |
(†) The distinction between high and low has considered the median criterion.
3.3 Methodology
The traditional approach to test the informative effect of the inclusion (exclusion) of a company in a sustainability indicator is the identification of abnormal returns using event study methodology10. The inclusion (exclusion) of a company in the RobecoSAM Sustainability Yearbook occurs each year at the same time when this report is published. This type of reporting causes an event clustering effect that needs to be considered to avoid possible estimation biases (Henderson, 1990). Binder (1985), Malatesta (1986) and, more recently, Ortas & Moneva (2011) have proposed different solutions based on Multivariate Regression Models. This methodology is only suitable when there are guarantees about the absence of any other events arising from contemporary news that may affect different stock prices (Ortas & Moneva, 2011, p. 403). We propose an alternative solution based on two steps to lead this limitation. In the first step, the mean abnormal return is estimated by each company for the entire studied period of 2008-2017. This estimation consists of a firm by firm time series estimation, allowing us to avoid the impact of the existence of other events. In a second step, we consider the effect (inclusion, exclusion and persistence in the display medal table) that we want to analyse.
To test our working hypotheses, we have specified both a static and a dynamic model. The first one provides static β parameters in time, which is a strong imposition, given the typical lack of stationarity in financial series (Bos & Newbold, 1984; Groenewold & Fraser, 1999). To overcome this limitation, a state-space specification has been proposed. This specification uses the methodological approach developed by Miralles et al. (2009), Ortas et al. (2011, 2012) and Ortas & Moseñe (2011). The models specified to determine the abnormal return are expressed by [1] and [2] for the static model and [3] and [4] for the dynamic one. Expressions [1] and [2] refer to a static specification, considering an EGARCH(1,1) regression in relation to the longitudinal errors. In contrast, expressions [3] and [4] reflect a dynamic regression based on a space-state model. In particular, expression [3] shows the observation equation, while expression [4] reflects the state evolution equation.
$$R_{i,t} = \alpha_{i} + \beta_{i1}.\text{DX}_{i} + \beta_{i2}\text{RMF}_{t} + \beta_{i3}\text{SMB}_{t} + \beta_{i4}\text{HML}_{t} + \beta_{i5}\text{IGR}_{i,t} + \beta_{i6}\text{CI}_{i,t} + u_{i,t} \ \ \ [1]$$
$$\ln\left( \sigma_{t}^{2} \right) = \ \omega + \ \alpha_{1} \cdot Z_{t - 1} + \vartheta_{1} \cdot \left| Z_{t - 1} \right| + \rho_{1} \cdot \ln{(\sigma_{t - 1}^{2})} \text{with} Z_{t} = \frac{\varepsilon_{t}}{\sigma_{t}^{2}} \ \ \ [2]$$
$$R_{i,t} = \alpha_{i} + \beta_{i1}.\text{DX}_{i} + \beta_{i2}\text{RMF}_{t} + \beta_{i3}\text{SMB}_{t} + \beta_{i4}\text{HML}_{t} + \beta_{i5}\text{IGR}_{i,t} + \beta_{i6}\text{CI}_{i,t} + u_{i,t} \ \ \ [3]$$
$$\beta_{\text{igt}} = \beta_{\text{ig}} + \gamma_{\text{ig}} \cdot (\beta_{igt - 1} - \beta_{\text{ig}})\ + \ \delta_{\text{igt}}\text{with}\delta_{\text{igt}}\ N(0,\sigma_{\delta_{\text{ig}}}^{2}) \ \ \ [4]$$
where Ri, t is the stock return of firm i on day t; DXiis a dummy variable that takes the value 1 when the Yearbook is published, and firm i is included (DEi), excluded (DSi) or persistent (DPi) at that specific moment and 0 otherwise; RMF, SMB and HML are the Fama-French factors for European firms11; IGRi is the industry growth rate of firm i; CI is the capital intensity of firm i, and ui, t is the error term. In the case of the state evolution equation, we have introduced a dynamic process in the β parameters of the different models. In line with Faff et al. (2000) and Yao & Gao (2004), the present study assumes an autoregressive process of order p = 1.
In a second step, the mean abnormal effect related to the inclusion, exclusion and or persistence (β||i1)is estimated. This parameter measures the abnormal return of company i related to the informative effect of the publication of the RobecoSAM Yearbook. As a company can be included, excluded or persistent on various occasions during the analysed period, the abnormal return is the mean abnormal return related to the studied event. The following regression summarizes the basic model for the static [5] and the dynamic parameter [6].
$$\overset{\sim}{\beta_{i1}} = c + \varepsilon_{i} \ \ [5]$$
$$\overset{\sim}{\beta_{i1t}} = \beta_{i1} + \gamma_{i1} \cdot \left( \beta_{i1t - 1} - \beta_{i1} \right) + \delta_{i1t} \ \ [6]$$
This specification enables us to isolate the effects of inclusion, exclusion and persistence in a sustainable indicator and avoid possible biases caused by the event clustering effect. Moreover, we have specified a set of regressions ([7], [8], [9], [10], [11] and [12]) including different control variables to make robust our analysis,
$$\overset{\sim}{\beta_{i1}} = c + \gamma_{iG1}DG1 + \gamma_{iG2A}DG2A + \gamma_{iG2B}DG2B + \varepsilon_{i} \ \ [7]$$
$$\overset{\sim}{\beta_{i1t}} = \beta_{i1} + \gamma_{i1} \cdot \left( \beta_{i1t - 1} - \beta_{i1} \right) + \gamma_{iG1}DG1 + \gamma_{iG2A}DG2A + \gamma_{iG2B}DG2B + \delta_{i1t} \ \ [8]$$
$$\overset{\sim}{\beta_{i1}} = c + \gamma_{iH1}H1 + \ldots + \gamma_{iH6}H6 + \varepsilon_{i} \ \ [9]$$
$$\overset{\sim}{\beta_{i1t}} = \beta_{i1} + \gamma_{i1} \cdot \left( \beta_{i1t - 1} - \beta_{i1} \right) + \gamma_{iH1}H1 + \ldots + \gamma_{iH6}H6 + \delta_{i1t} \ \ [10]$$
$$\overset{\sim}{\beta_{i1}} = c + \gamma_{iAC1}AC1 + \ldots + \gamma_{iAC10}AC10{+ \varepsilon}_{i} \ \ [11]$$
$$\overset{\sim}{\beta_{i1t}} = \beta_{i1} + \gamma_{i1} \cdot \left( \beta_{i1t - 1} - \beta_{i1} \right) + \gamma_{iAC1}AC1 + \ldots + \gamma_{iAC10}AC10 + \delta_{i1t} \ \ [12]$$
where the variables related to the Scandinavian, German and Anglo-Saxon cultural origins are represented by DG1, DG2A and DG2B, respectively. In the second regression, the Hofstede dimensions are introduced (H1: power distance, H2: individualism; H3: femininity, H4: uncertainty avoidance, H5: long-term orientation and H6: indulgence). Finally, AC terms indicate the activity sector. We have considered basic materials (AC1), industrials (AC2), consumer cyclicals (AC3), consumer non-cyclicals (AC4), financials (AC5), healthcare (AC6), technology (AC7), telecommunication services (AC8) and utilities (AC9). The basic categories are Mediterranean cultural origin (DG3) and energy sector (AC10). The remaining symbols maintain the same meaning. These regressions have been considered with the gold medal category because it is composed of those companies that develop the highest levels of sustainability (DOi: Gold appearance, DEOi: Gold inclusion, DPOi: Gold persistence, DSOi: Gold exclusion).
The estimation of the different models considered the option vce(robust) to obtain robust standard errors. The software used was Stata 14.2.
4 Empirical evidence
4.1 Descriptive Statistics
This subsection presents a first approach to the data. Table 4 shows the descriptive statistics for year (Panel A) and day (Panel B). In both cases, information about stock market return (Rm), average abnormal return (Ri-Rf) and β indicators associated with the first set of regressions is shown. This information is organized in four categories that represent the original information contained in the RobecoSAM Yearbook (D) together with the inclusion (DE), persistence (DP) and exclusion (DS) of a firm in the medal display table.
Table 4. Descriptive statistics for medal display table
| Panel A: Year | |||||||||||||
|---|---|---|---|---|---|---|---|---|---|---|---|---|---|
| D (Appearance) | DE (Inclusion) | DP (Persistence) | DS (Exclusion) | ||||||||||
| Rm | Ri-Rf | β*D | Ri-Rf | β*DE | Ri-Rf | β*DP | Ri-Rf | β*DS | |||||
| 0 | 1 | 0 | 1 | 1 | 0 | 1 | 1 | 0 | 1 | 1 | |||
| 2009 | 0.131% | 0.123% | 0.101% | 0.090% | 0.107% | 0.134% | 0.055% | 0.125% | 0.0956% | 0.040% | 0.109% | 0.116% | 0.051% |
| 2010 | 0.033% | 0.057% | 0.026% | 0.238% | 0.041% | 0.000% | 0.050% | 0.043% | 0.032% | 0.158% | 0.038% | 0.015% | 0.048% |
| 2011 | -0.039% | -0.096% | -0.084% | 0.097% | -0.087% | -0.118% | 0.011% | -0.099% | -0.081% | 0.130% | -0.085% | -0.126% | -0.016% |
| 2012 | 0.079% | 0.049% | 0.046% | 0.269% | 0.046% | 0.067% | 0.056% | 0.052% | 0.044% | 0.213% | 0.047% | 0.053% | 0.034% |
| 2013 | 0.098% | 0.077% | 0.073% | 0.105% | 0.070% | 0.122% | 0.021% | 0.086% | 0.066% | 0.084% | 0.029% | 0.078% | 0.000% |
| 2014 | -0.023% | 0.003% | -0.004% | -0.093% | -0.002% | 0.002% | -0.009% | 0.003% | -0.005% | -0.084% | -0.003% | 0.009% | -0.026% |
| 2015 | 0.003% | -0.001% | 0.001% | 0.272% | 0.000% | 0.002% | 0.052% | 0.000% | 0.001% | 0.219% | 0.000% | 0.006% | 0.127% |
| 2016 | 0.007% | -0.016% | 0.017% | -0.166% | 0.003% | 0.009% | 0.027% | -0.012% | 0.017% | -0.163% | 0.002% | 0.019% | -0.042% |
| 2017 | 0.097% | 0.028% | 0.036% | 0.000% | 0.032% | 0.038% | 0.023% | 0.029% | 0.036% | 0.001% | 0.034% | 0.018% | 0.194% |
| Pool | 0.043% | 0.024% | 0.024% | 0.091% | 0.023% | 0.028% | 0.032% | 0.025% | 0.023% | 0.066% | 0.020% | 0.020% | 0.025% |
| Panel B:Event day | |||||||||||||
| D (Appearance) | DE (Inclusion) | DP (Persistence) | DS (Exclusion) | ||||||||||
| Rm | Ri-Rf | β*D | Ri-Rf | β*DE | Ri-Rf | β*DP | Ri-Rf | β*DS | |||||
| 0 | 1 | 1 | 0 | 1 | 1 | 0 | 1 | 1 | 0 | 1 | 1 | ||
| 27/01/2009 | 0.000% | 0,178% | 0,069% | 0.072% | 0,075% | 0,485% | 0.394% | 0,235% | 0,005% | -0.057% | 0,063% | 0,741% | 0.545% |
| 26/01/2010 | -0.340% | 0,127% | 0,895% | 0.794% | 0,719% | 0,041% | -0.707% | 0,105% | 1,068% | 1.004% | 0,687% | 0,060% | -0.467% |
| 28/02/2011 | 1.130% | 0,753% | 0,723% | -0.041% | 0,733% | 0,749% | 0.044% | 0,752% | 0,721% | -0.049% | 0,768% | 0,420% | -0.311% |
| 26/01/2012 | 1.039% | 1,610% | 1,570% | -0.115% | 1,531% | 2,226% | 0.628% | 1,720% | 1,482% | -0.295% | 1,598% | 1,359% | -0.126% |
| 22/01/2013 | -0.080% | -0,153% | -0,213% | -0.054% | -0,197% | -0,147% | -0.140% | -0,152% | -0,223% | -0.004% | -0,195% | -0,175% | 0.059% |
| 21/01/2014 | 0.050% | -0,258% | -0,243% | 0.119% | -0,264% | -0,029% | 0.195% | -0,221% | -0,268% | 0.056% | -0,238% | -0,368% | -0.249% |
| 19/01/2015 | 0.730% | 0,877% | 0,919% | 0.002% | 0,879% | 1,130% | 0.363% | 0,933% | 0,879% | -0.125% | 0,844% | 1,417% | 0.728% |
| 20/01/2016 | -3.140% | -3,090% | -3,205% | 0.421% | -3,191% | -2,642% | 0.671% | -3,033% | -3,264% | 0.242% | -3,017% | -4,635% | -2.441% |
| 19/01/2017 | 0.270% | -0,262% | -0,027% | -0.468% | -0,153% | 0,422% | -0.148% | -0,185% | -0,070% | -0.433% | -0,102% | -0,423% | -0.172% |
| Pool | -0.040% | -0,217% | 0,488% | 0.081% | 0,131% | 2,236% | 0.144% | 0,154% | 0,330% | 0.038% | 0,408% | -1,602% | -0.271% |
As observed in Panel A, throughout the period analysed, the stock market return shows a positive value of 0.043%. It is possible to observe that, on average, none of the companies in the studied groups can beat this return in this period. A similar interpretation can be provided when we compare the average abnormal return obtained by companies that participate in a specific year in the RobecoSAM Yearbook with other companies that are not participating at that moment. In fact, there are identical results in terms of exclusion (Pool DS, Ri-Rf: 0.020%) and slightly different results when the effects of inclusion (Pool DE, Ri-Rf=1: 0.028% vs Pool DE, Ri-Rf=0: 0.023%) and persistence (Pool DP, Ri-Rf=1: 0.023% vs Pool DP, Ri-Rf=0: 0.025%) are analysed. These results suggest that there is no memory concerning movements related to sustainability in financial markets. These results change when the β indicators are considered. In this case, the inclusion (Pool β: 0.032%) and persistence (Pool β: 0.066%) of a company in the indicator contribute to higher levels of performance. This positive sign is also observed in relation to the exclusion (Pool β: 0.025%) although it is close to zero. These parameters imply that the entities that decide to implement sustainable practices can reduce their levels of risk during the period.
Panel B shows the results achieved on the event day when the RobecoSAM Yearbook is published. In this case, it is possible to observe how the publication of this report causes a positive abnormal average return (Pool D, Ri-Rf=1: 0.488%). This daily return is higher than the level achieved by the stock market (Pool Rm: -0.040%) and other companies that will participate in the indicator (Pool D, Ri-Rf=0: -0.217%). It is important to note that the effects related to inclusion (Pool DE, Ri-Rf=1: 2.236%), persistence (Pool DP, Ri-Rf=1: 0.330%) and exclusion (Pool DS, Ri-Rf=1: -1.602%) take the expected sign. Something similar happens when the level of performance is considered, although the differences tend to be less intense (Pool DE β: 0.144%; DP β:0.038% and DS β: -0.271%). Anyway, it is possible to observe variations when the event day is considered.
Table 5 analyses the impact related to the obtention of a gold medal, the best category in the medal display table. The descriptive statistics maintain the same structure as in Table 4 and are organized in four categories that represent the original information contained in the RobecoSAM Yearbook in relation to the gold medal (DO) together with the inclusion (DEO), persistence (DPO) and exclusion (DSO) of a firm in this specific category.
Table 5. Descriptive statistics for gold medal
| Panel A: Year Gold | |||||||||||||
|---|---|---|---|---|---|---|---|---|---|---|---|---|---|
| D (Appearance) | DE (Inclusion) | DP (Persistence) | DS (Exclusion) | ||||||||||
| Rm | Ri-Rf | β*DO | Ri-Rf | β*DEO | Ri-Rf | β*DPO | Ri-Rf | β*DSO | |||||
| 0 | 1 | 0 | 1 | 1 | 0 | 1 | 1 | 0 | 1 | 1 | |||
| 2009 | 0.131% | 0.114% | 0.086% | 1.194% | 0.109% | 0.053% | 0.019% | 0.113% | 0.088% | 0.049% | 0.108% | 0.161% | 0.009% |
| 2010 | 0.080% | 0.038% | 0.026% | 0.492% | 0.035% | 0.081% | 0.002% | 0.039% | 0.022% | 0.001% | 0.036% | 0.113% | 0.002% |
| 2011 | -0.039% | -0.097% | -0.047% | 0.981% | -0.088% | -0.093% | -0.003% | -0.097% | -0.044% | 0.042% | -0.088% | -0.176% | 0.011% |
| 2012 | 0.079% | 0.046% | 0.049% | 0.982% | 0.047% | 0.096% | 0.010% | 0.047% | 0.047% | 0.051% | 0.048% | -0.023% | -0.014% |
| 2013 | 0.098% | 0.072% | 0.098% | 0.802% | 0.073% | 0.355% | -0.006% | 0.074% | 0.081% | 0.008% | 0.075% | 0.060% | -0.004% |
| 2014 | -0.023% | -0.002% | 0.001% | 0.922% | -0.002% | -0.081% | -0.001% | -0.002% | 0.004% | -0.001% | -0.001% | -0.001% | 0.003% |
| 2015 | 0.003% | 0.000% | 0.004% | 0.605% | 0.001% | -0.026% | 0.021% | 0.000% | 0.005% | 0.066% | 0.000% | 0.114% | -0.001% |
| 2016 | 0.007% | 0.000% | 0.035% | 1.108% | 0.003% | 0.011% | -0.001% | 0.000% | 0.036% | -0.023% | 0.004% | 0.035% | -0.025% |
| 2017 | 0.097% | 0.031% | 0.048% | 1.320% | 0.033% | 0.051% | 0.001% | 0.031% | 0.048% | 0.102% | 0.033% | 0.000% | 0.002% |
| Pool | 0.043% | 0.022% | 0.033% | 0.934% | 0.023% | 0.050% | 0.005% | 0.023% | 0.032% | 0.033% | 0.024% | 0.031% | -0.189% |
| Panel B: Event day Gold | |||||||||||||
| D (Appearance) | DE (Inclusion) | DP (Persistence) | DS (Exclusion) | ||||||||||
| Rm | Ri-Rf | β*DO | Ri-Rf | β*DEO | Ri-Rf | β*DPO | Ri-Rf | β*DSO | |||||
| 0 | 1 | 1 | 0 | 1 | 1 | 0 | 1 | 1 | 0 | 1 | 1 | ||
| 27/01/2009 | 0.000% | 0.121% | 0.049% | -0.271% | 0.105% | 0.565% | 0.314% | 0.127% | 0.017% | -0.307% | 0.093% | 1.360% | 1.118% |
| 26/01/2010 | -0.340% | 0.673% | 0.508% | -0.321% | 0.652% | -0.107% | -0.824% | 0.661% | 0.554% | -0.262% | 0.643% | 0.620% | -0.039% |
| 28/02/2011 | 1.130% | 0.740% | 0.707% | -0.120% | 0.744% | 0.011% | -0.727% | 0.729% | 0.765% | -0.070% | 0.718% | 3.297% | 2.504% |
| 26/01/2012 | 1.039% | 1.606% | 1.463% | -0.159% | 1.575% | 2.937% | 1.313% | 1.616% | 1.400% | -0.232% | 1.593% | 0.159% | -1.301% |
| 22/01/2013 | -0.080% | -0.203% | -0.111% | 0.091% | -0.191% | -0.552% | -0.257% | -0.205% | -0.081% | 0.116% | -0.194% | -0.108% | 0.092% |
| 21/01/2014 | 0.050% | -0.242% | -0.309% | -0.122% | -0.248% | -0.341% | -0.119% | -0.242% | -0.308% | -0.122% | -0.249% | 0.071% | 0.115% |
| 19/01/2015 | 0.730% | 0.905% | 0.896% | -0.077% | 0.897% | 3.245% | 2.321% | 0.913% | 0.820% | -0.163% | 0.904% | 0.759% | -0.264% |
| 20/01/2016 | -3.140% | -3.200% | -2.818% | 0.576% | -3.158% | -3.338% | -0.023% | -3.201% | -2.787% | 0.611% | -3.139% | -9.796% | -6.472% |
| 19/01/2017 | 0.270% | -0.147% | 0.075% | 0.716% | -0.125% | 0.470% | 0.000% | -0.145% | 0.063% | 0.716% | -0.123% | 0.000% | 0.000% |
| Pool | -0.040% | 0.028% | 0.051% | 0.035% | 0.028% | 0.321% | 0.222% | 0.028% | 0.049% | 0.032% | 0.027% | -0.404% | -0.472% |
Panel A shows the descriptive statistic for the annual period. As observed, the appearance of a company in this category has some key implications. Those companies that obtained a gold medal showed higher returns when they appeared in the Yearbook (Pool DO Ri-Rf=1: 0.033%), although they could not beat the market reference (Rm: 0.043%). The decomposition of this effect shows how those companies that are included (Pool DEO Ri-Rf=1: 0.050%) or persisted (Pool DPO Ri-Rf=1: 0.032%) in this category have a positive abnormal return. A positive abnormal return is also observed when the company is excluded (Pool DSO Ri-Rf=1: 0.031%). The analysis of the performance level enables us to achieve similar conclusions. The most intense effects are related to exclusion (Pool DE β: -0.189%) and persistence (DP β:0.033%), while the weakest is related to inclusion (DS β: 0.005%). Thus, financial markets tend to value efforts towards sustainability, especially when the company has decreased its level of commitment to sustainable practices. In this sense, it is necessary to highlight that the exclusion of a company from the highest category does not usually mean exclusion from the whole ranking but rather its appearance in the silver category.
The event day effects are shown in Panel B. In this case, we obtained a similar effect in terms of the abnormal average return as that shown in Table 3. The presence of a company in this category provides a positive abnormal return (Pool DE Ri-Rf=1: 0.051%), both in the case of inclusion (Pool DEO Ri-Rf=1: 0.321%) and persistence (Pool DPO Ri-Rf=1: 0.049%). A negative effect is observed in the case of exclusion (Pool DSO Ri-Rf=1: -0.404%). The β indicator maintains this pattern in all three cases. These results indicate that the financial market tends to value the information provided by RobecoSAM, resulting in intense movements in terms of prices on the event day.
These same results can be observed in annex 1. Annex 1 shows the estimation for β parameters under MCO, EGARCH (1,1) and dynamic estimators. The appearance and inclusion effects maintain their density function over zero, according to the positive signs shown in Tables 3 and 4. A similar situation can be observed in relation to persistence. In contrast, the graphics for exclusion show the opposite effect, demonstrating a negative sign under the EGARCH (1,1) estimator and close to zero under space-state regressions.
These first results could indicate that financial markets value the positive effect of a sustainability policy due to the positive signs observed in relation to the inclusion and persistence of a company in this ranking. Descriptive statistics also indicate punishment when the company loosens up in the development of sustainable practices. However, we also observed that this effect tends to disappear over time. In this sense, we observed similar parameters among companies inside and outside the ranking when the level of return and performance was considered in the annual period. In any case, an empirical analysis is necessary to demonstrate the statistical significance of these preliminary results.
4.2 Results
This subsection analyses the empirical evidence related to the impact of the abnormal individual returns on the informative effect derived from the publication of the RobecoSAM Yearbook. Particularly, the abnormal return associated with this publication is studied under four possible situations related to this event (appearance, inclusion, persistence and exclusion). Table 6 shows the effects of the medal display table, whereas Table 7 contains the effects of the gold medal. In both cases, information related to the parameters, significant level and goodness-of-fit is revealed.
Table 6. Results. Effects of medal display table
| D (Appearance) | DE (Inclusion) | |||||||||||||||
|---|---|---|---|---|---|---|---|---|---|---|---|---|---|---|---|---|
| Static | Dynamic | Static | Dynamic | |||||||||||||
| Par. | Par. | Par. | Par. | Par. | Par. | Par. | Par. | Par. | Par. | Par. | Par. | Par. | Par. | Par. | Par. | |
| c | 0.006*** | 0.008** | 0.005** | 0.002** | 0.045*** | 0.044*** | 0.095** | 0.059*** | 0.011*** | 0.009** | 0.045** | 0.024** | 0.140*** | 0.132*** | 0.254* | 0.133*** |
| Scandinavian | -0.004 | 0.003 | 0.002 | -0.036 | ||||||||||||
| German | -0.004 | 0.005 | 0.004 | 0.021 | ||||||||||||
| Anglo-saxon | -0.001 | -0.001 | 0.001 | 0.035 | ||||||||||||
| Power distance | -0.001 | 0.001 | -0.001 | 0.001 | ||||||||||||
| Individualism | -0.001 | -0.001 | -0.001 | 0.000 | ||||||||||||
| Masculinity | 0.001 | 0.001 | 0.001 | 0.000 | ||||||||||||
| Uncertainty avoidance | 0.002 | -0.001 | -0.001 | -0.000 | ||||||||||||
| Long-term orientation | -0.002 | 0.001 | -0.002 | -0.001 | ||||||||||||
| Indulgence | 0.002 | -0.001 | -0.001 | -0.000 | ||||||||||||
| Basic Materials | 0.002 | -0.012 | -0.021** | -0.062 | ||||||||||||
| Industrials | 0.005 | -0.014 | -0.007 | -0.011 | ||||||||||||
| Consumer Cyclicals | 0.009* | -0.021** | -0.011 | -0.067 | ||||||||||||
| Consumer Non-Cyclicals | 0.003 | -0.009 | -0.004 | -0.026 | ||||||||||||
| Financials | 0.001 | -0.025** | -0.015 | 0.171*** | ||||||||||||
| Healthcare | -0.004** | 0.018 | -0.026** | -0.036 | ||||||||||||
| Technology | 0.010 | -0.016 | -0.016 | -0.044 | ||||||||||||
| Telecommunication Services | 0.017 | -0.017 | -0.011 | -0.105** | ||||||||||||
| Utilities | -0.001 | -0.007 | -0.019* | -0.032 | ||||||||||||
| R-squared | 0.000 | 0.006 | 0.014 | 0.018 | 0.000 | 0.004 | 0.006 | 0.055 | 0.000 | 0.001 | 0.014 | 0.028 | 0.000 | 0.009 | 0.011 | 0.095 |
| F | 0.000 | 0.365 | 0.394 | 1.680 | 0.000 | 0.691 | 0.917 | 2.500 | 0.000 | 0.928 | 1.420 | 3.090 | 0.000 | 1.060 | 0.656 | 2.600 |
| RMSE | 0.035 | 0.035 | 0.035 | 0.035 | 0.044 | 0.044 | 0.044 | 0.044 | 0.040 | 0.040 | 0.040 | 0.040 | 0.028 | 0.028 | 0.028 | 0.028 |
*pvalue<0.100; ** pvalue<0.050; *pvalue<0.010
Breusch-Pagan test (Fd:0.001; Fde: 0.001; Fdp:0.001; Fds:0.001, pvalue>0.100) suggests that pool model is preferred
Rho<0.100 (Fd: 0.960; Fde: 0.940; Fdp:0.980; Fds:0.970, pvalue>0.100)
Table 6 (continuation). Results. Effects of medal display table
| DP (Persistence) | DS (Exclusion) | |||||||||||||||
|---|---|---|---|---|---|---|---|---|---|---|---|---|---|---|---|---|
| Static | Dynamic | Static | Dynamic | |||||||||||||
| Par. | Par. | Par. | Par. | Par. | Par. | Par. | Par. | Par. | Par. | Par. | Par. | Par. | Par. | Par. | Par. | |
| c | 0.005* | 0.009* | 0.030* | 0.012** | 0.140*** | 0.132*** | 0.254* | 0.133*** | -0.049*** | -0.018* | -0.009* | -0.018* | 0.016 | -0.088 | -0.902 | 0.416 |
| Scandinavian | -0.004 | -0.037 | -0.002 | 0.0889 | ||||||||||||
| German | -0.012 | 0.022 | -0.004 | 0.165 | ||||||||||||
| Anglo-saxon | 0.001 | 0.035 | -0.003 | 0.106 | ||||||||||||
| Power distance | -0.001 | 0.001 | 0.001 | -0.015 | ||||||||||||
| Individualism | 0.001 | 0.000 | 0.009 | 0.015 | ||||||||||||
| Masculinity | -0.002 | 0.000 | -0.001 | 0.000 | ||||||||||||
| Uncertainty avoidance | -0.001 | -0.001 | 0.001 | 0.016 | ||||||||||||
| Long-term orientation | -0.001 | -0.002 | 0.001 | -0.008 | ||||||||||||
| Indulgence | -0.004* | -0.001 | -0.006 | -0.001 | ||||||||||||
| Basic Materials | -0.002 | -0.062 | 0.093 | -0.412 | ||||||||||||
| Industrials | -0.007 | -0.011 | 0.061 | -0.538* | ||||||||||||
| Consumer Cyclicals | -0.002 | -0.067 | 0.066 | -0.416 | ||||||||||||
| Consumer Non-Cyclicals | -0.003 | -0.026 | 0.057 | -0.266 | ||||||||||||
| Financials | -0.022* | 0.171*** | 0.044 | -0.430 | ||||||||||||
| Healthcare | --0.006 | -0.360 | 0.110* | -0.411 | ||||||||||||
| Technology | -0.006 | -0.044 | 0.118* | -0.407 | ||||||||||||
| Telecommunication Services | 0.006 | -0.105 | 0.117* | -0.413 | ||||||||||||
| Utilities | -0.013** | -0.032* | 0.117* | -0.415 | ||||||||||||
| R-squared | 0.000 | 0.009 | 0.011 | 0.028 | 0.000 | 0.010 | 0.010 | 0.095 | 0.000 | 0.005 | 0.022 | 0.028 | 0.000 | 0.003 | 0.014 | 0.020 |
| F | 0.000 | 1.050 | 0.960 | 1.830 | 0.000 | 1.060 | 0.690 | 2.600 | 0.000 | 0.429 | 0.165 | 2.120 | 0.000 | 0.909 | 0.857 | 0.410 |
| RMSE | 0.055 | 0.055 | 0.055 | 0.055 | 0.028 | 0.028 | 0.028 | 0.028 | 0.021 | 0.021 | 0.021 | 0.021 | 0.091 | 0.091 | 0.091 | 0.091 |
*pvalue<0.100; ** pvalue<0.050; *pvalue<0.010
Breusch-Pagan test (Fd:0.001; Fde: 0.001; Fdp:0.001; Fds:0.001, pvalue>0.100) suggests that pool model is preferred
Rho<0.100 (Fd: 0.960; Fde: 0.940; Fdp:0.980; Fds:0.970, pvalue>0.100)
The previous table shows the results related to the average informative impact caused by movements in the RobecoSAM medal display table. The parameters have been estimated using both static (EGARCH (1,1)) and dynamic estimators (space-state models)12. It is possible to observe that the informative effect is positive and significant when the appearance in the RobecoSAM Yearbook is analysed (Coef c static: 0.006; pvalue<0.010; dynamic: 0.045; pvalue<0.010). This result indicates that the incorporation of the medal display tables is perceived as a positive sign that can provide value to a company. It is necessary to highlight that this is an average effect where we do not consider either the type of medal (gold, silver, bronze or member) or specific movement (inclusion, persistence or exclusion).
The study of the specific movements allows us to separate the contribution of each effect to the general category of appearance. When the inclusion effect is studied, we observe a positive and significant parameter (Coef. c static: 0.011, pvalue<0.010; dynamic: 0.140; pvalue<0.010). In other words, financial markets tend to value the efforts of a company to develop sustainable practices, with these companies being rewarded with higher market value. The effect of persistence is also significant (pvalue < 0.100). This result means that this information provides some novelty in relation to the information anticipated by financial markets and can induce positive and significant abnormal returns. Finally, the exclusion effect has been studied. This effect could imply a negative impact because the company has decreased its levels of sustainability, evident from its not being rewarded by RobecoSAM. Although the results show a negative sign, this movement is only statistically significant under the static estimator. Therefore, we can conclude that there is no consistent average abnormal return when this effect is considered.
The addition of control variables related to the cultural context, country classification based on ISS index and Hofstede dimensions, and activity do not modify the previous conclusions. In this sense, appearance in the RobecoSAM Yearbook shows a positive effect (Coef. c static: [0.005-0.008]; pvalue<0.050; dynamic: [0.044-0.095]; pvalue<0.050) and is independent of the cultural origin of the company under study. The absence of significance of the dummy variables related to the cultural origins reveals that the effect is not significantly different between them (Coef Scandinavian static: -0.004; dynamic: 0.003; German static: -0.004; dynamic: 0.005 and Anglo-Saxon static: -0.001; dynamic: -0.001; p-value>0.100). This same result is observed when Hofstede dimensions are considered (pvalue>0.100). This effect is similar when we consider the separation between inclusion, persistence and exclusion. Therefore, the mean impact of the informative effect and the effect of cultural origin enable us to arrive at the same conclusion: the signs and significance remain stable. Consequently, the inclusion (Coef. c static: [0.011-0.009]; dynamic: [0.132-0.254]; pvalue<0.100) and persistence of a company has a positive effect (Coef. c static: [0.009-0.030]; dynamic: [0.132-0.254]; pvalue<0.100), while exclusion is not significant under the dynamic specification (pvalue>0.100). The activity control variable does not show consistent results. In this sense, although some parameters are significant, their signs are not robust to the estimation method. However, the informative effect conserves the same sign and significance in the different scenarios.
The previous results have analysed the effect of the different movements related to the medal display table, but they have not differentiated between the types of medals. Thus, we have repeated this analysis in relation to the gold class. A gold medal can have a differentiating effect because of its higher visibility because it is used in the elaboration of the DJSI index. Table 7 shows the results related to this category.
Table 7. Results. Effects of gold medal
| D (Appearance) | DE (Inclusion) | |||||||||||||||
|---|---|---|---|---|---|---|---|---|---|---|---|---|---|---|---|---|
| Static | Dynamic | Static | Dynamic | |||||||||||||
| Par. | Par. | Par. | Par. | Par. | Par. | Par. | Par. | Par. | Par. | Par. | Par. | Par. | Par. | Par. | Par. | |
| c | 0.010*** | 0.012*** | 0.020*** | 0.011*** | 0.122*** | 0.125* | 0.122* | 0.127*** | 0.014*** | 0.016*** | 0.015*** | 0.015** | 0.126*** | 0.124* | 0.121* | 0.128*** |
| Scandinavian | -0.006 | -0.047 | -0.005 | -0.046 | ||||||||||||
| German | -0.001 | -0.046 | -0.001 | -0.047 | ||||||||||||
| Anglo-saxon | 0.001 | -0.046 | -0.001 | -0.045 | ||||||||||||
| Power distance | 0.001 | 0.012 | 0.001 | 0.016 | ||||||||||||
| Individualism | -0.002 | -0.135 | -0.002 | -0.014 | ||||||||||||
| Masculinity | 0.001 | -0.005 | 0.001 | -0.004 | ||||||||||||
| Uncertainty avoidance | -0.001 | -0.210 | -0.002 | -0.020 | ||||||||||||
| Long-term orientation | -0.001 | 0.004 | -0.002 | 0.003 | ||||||||||||
| Indulgence | -0.001 | -0.007 | -0.001 | -0.006 | ||||||||||||
| Basic Materials | -0.003 | -0.033 | -0.006 | -0.033 | ||||||||||||
| Industrials | 0.004 | -0.005 | 0.004 | -0.006 | ||||||||||||
| Consumer Cyclicals | 0.001 | -0.061 | -0.001 | -0.061 | ||||||||||||
| Consumer Non-Cyclicals | 0.008 | -0.022 | 0.006 | -0.022 | ||||||||||||
| Financials | -0.003 | 0.272 | -0.001 | 0.271 | ||||||||||||
| Healthcare | -0.007 | -0.031 | -0.009 | -0.031 | ||||||||||||
| Technology | -0.006 | -0.038 | -0.008 | -0.038 | ||||||||||||
| Telecommunication Services | -0.008 | -0.112* | 0.001 | -0.116* | ||||||||||||
| Utilities | -0.002 | -0.027 | -0.003 | -0.028 | ||||||||||||
| R-squared | 0.000 | 0.006 | 0.018 | 0.014 | 0.000 | 0.042 | 0.049 | 0.021 | 0.000 | 0.003 | 0.015 | 0.033 | 0.000 | 0.042 | 0.045 | 0.022 |
| F | 0.000 | 1.450 | 0.570 | 1.460 | 0.000 | 1.530 | 0.852 | 0.652 | 0.000 | 0.672 | 0.550 | 2.050 | 0.000 | 1.531 | 0.849 | 0.760 |
| RMSE | 0.037 | 0.037 | 0.037 | 0.037 | 0.048 | 0.048 | 0.048 | 0.048 | 0.040 | 0.040 | 0.040 | 0.040 | 0.042 | 0.042 | 0.042 | 0.042 |
*pvalue: 0.100; **pvalue: 0.050; ***pvalue: 0.010
Breusch-Pagan test (Fd:0.001; Fde: 1.091; Fdp:0.001; Fds:0.001, pvalue>0.100) suggests that pool model is preferred
Rho<0.100 (Fd: 0.960; Fde: 1.090; Fdp:1.000; Fds:0.980, pvalue>0.100)
Table 7 (continuation). Results. Effects of gold medal
| DP (Persistence) | DS (Exclusion) | |||||||||||||||
|---|---|---|---|---|---|---|---|---|---|---|---|---|---|---|---|---|
| Static | Dynamic | Static | Dynamic | |||||||||||||
| Par. | Par. | Par. | Par. | Par. | Par. | Par. | Par. | Par. | Par. | Par. | Par. | Par. | Par. | Par. | Par. | |
| c | 0.013*** | 0.016*** | 0.009** | 0.012* | 0.140*** | 0.106*** | 0.052* | 0.054* | -0.063*** | -0.057* | -0.041* | -0.017* | 0.016 | -0.235 | -0.120 | 0.082 |
| Scandinavian | 0.010** | 0.047 | 0.003 | 0.293 | ||||||||||||
| German | -0.001 | 0.048 | -0.004 | 0.282 | ||||||||||||
| Anglo-saxon | 0.001 | 0.025 | -0.008 | 0.291 | ||||||||||||
| Power distance | 0.004 | 0.003 | -0.003 | -0.011 | ||||||||||||
| Individualism | -0.004 | -0.004 | 0.002 | 0.014 | ||||||||||||
| Masculinity | 0.001 | 0.001 | -0.001** | 0.002 | ||||||||||||
| Uncertainty avoidance | -0.004 | -0.005 | 0.003 | 0.015 | ||||||||||||
| Long-term orientation | -0.003** | 0.001 | 0.002** | -0.004 | ||||||||||||
| Indulgence | -0.003* | -0.001 | 0.004 | -0.001 | ||||||||||||
| Basic Materials | -0.002 | -0.007 | 0.007 | -0.105 | ||||||||||||
| Industrials | 0.003 | 0.007 | 0.005 | -0.103 | ||||||||||||
| Consumer Cyclicals | 0.001 | 0.013 | 0.003 | 0.027 | ||||||||||||
| Consumer Non-Cyclicals | 0.008 | 0.187** | 0.002 | -0.033 | ||||||||||||
| Financials | -0.001 | 0.281*** | -0.004 | -0.100 | ||||||||||||
| Healthcare | -0.006 | 0.055 | 0.007 | -0.103 | ||||||||||||
| Technology | -0.007 | 0.054 | 0.007 | -0.103 | ||||||||||||
| Telecommunication Services | 0.010 | 0.027 | 0.003 | -0.063 | ||||||||||||
| Utilities | -0.002 | 0.038 | 0.003 | -0.058 | ||||||||||||
| R-squared | 0.000 | 0.011 | 0.032 | 0.013 | 0.000 | 0.003 | 0.009 | 0.147 | 0.000 | 0.016 | 0.041 | 0.029 | 0.000 | 0.011 | 0.015 | |
| F | 0.000 | 3.130 | 1.380 | 1.510 | 0.000 | 0.550 | 0.590 | 3.730 | 0.000 | 0.078 | 1.940 | 2.870 | 0.000 | 0.620 | 0.580 | |
| RMSE | 0.040 | 0.040 | 0.040 | 0.040 | 0.029 | 0.029 | 0.029 | 0.029 | 0.023 | 0.023 | 0.023 | 0.023 | 0.010 | 0.010 | 0.010 | 0.010 |
*pvalue: 0.100; **pvalue: 0.050; ***pvalue: 0.010
Breusch-Pagan test (Fd:0.001; Fde: 1.091; Fdp:0.001; Fds:0.001, pvalue>0.100) suggests that pool model is preferred
Rho<0.100 (Fd: 0.960; Fde: 1.090; Fdp:1.000; Fds:0.980, pvalue>0.100)
As observed, the gold medal causes more intense effects. The appearance of a company in this category has positive and significant effects in terms of market value (Coef. c static: 0.010; pvalue<0.010; dynamic: 0.011; pvalue<0.010). The distinction between inclusion, persistence and exclusion has different contributions. The inclusion of a company in this category has a positive and significant effect (Coef. c static: 0.014; pvalue<0.010; dynamic: 0.126; pvalue<0.010). Thus, the entities that belong to this category obtain certain benefits. This same effect occurs when persistence is analysed (Coef. c static: 0.013; pvalue<0.010; dynamic: 0.140; pvalue<0.010). Our results then show that the gold category represents positive effects in both cases, with a company being able to obtain higher levels of performance if it achieves this category and maintains it over the long term. The exclusion of a company does not have a consistent effect (pvalue>0.100). This result arises because exclusion does not mean that a company ceases its development of sustainable practices but develops them with a lower intensity and appears in a lower class.
The consideration of control variables does not imply modification of the previous effects. In relation to the appearance and exclusion, we can observe no variation in the different cultural origins and activities (pvalue>0.100). However, there is a significant effect of control variables in relation to the inclusion and persistence effects. In relation to persistence, we can observe a positive sign in the Scandinavian category (Coef. static: 0.010; pvalue<0.050). This effect is consistent with the SSI index because Scandinavian countries have the top position in terms of sustainable practices. Hofstede dimensions related to masculinity and long-term orientation show significant parameters in relation to the exclusion (pvalue<0.050). This result could mean that societies in which female values and long-term orientation are developed particularly tend to assess the exclusion announcement. Finally, in relation to the activity, we do not observe significant signs, with the only exception of telecommunication, financial and consumer non-cyclical services. Anyway, the results related to control variables must be cautiously taken because they are not consistent when the estimation method changes.
In conclusion, the obtained results do not allow us to reject H1 because the appearance of a company in the medal display table is associated with positive abnormal returns. When this effect is split up, we observe that the inclusion of a company in the medal display table is associated with positive abnormal returns (H1.1). A similar result is observed in relation to the persistence in the medal display table (H1.2). In relation to exclusion, we observe that this scenario does not cause consistent negative abnormal returns (H1.3).
5 Discussion and conclusions
The aim of this study is to analyse the influence of the level of sustainability on the market value of a set of companies. To do so, we analyse the influence of the level of sustainability achieved by a company, isolated from the general evolution of financial markets, on the market value of a set of assets. Our results show that the level of return obtained by a company depends on the general evolution of financial markets, but there is also a significant effect related to the level of sustainability. In this sense, the appearance in the medal display table is associated with positive abnormal returns, with this effect being caused both by inclusion and persistence in the medal display table.
This result is in accordance with Consolandi et al. (2009) and Becchetti et al. (2008), who obtained a significant and positive effect in Europe in relation to the inclusion and persistence of a company in a sustainability indicator, respectively. Nevertheless, these studies were developed in the context of sustainable stock exchange indices. In relation to social rankings, Harjoto & Laksmana (2018) found a positive interaction related to the appearance in these rankings, although they focused on North American context and used the MSCI letter rankings. Our results would confirm their conclusions in a different context and ranking. Thus, the inclusion and persistence in a ranking will enhance the reputation of a company and its competitive position and would be related to the long-term perception of sustainability (Surroca et al., 2010; Cheung, 2011; Cheung & Roca, 2013; Endrikat et al., 2014). We cannot support the results obtained by Curran & Moran (2007) and Ortas et al. (2011). Although these authors obtain a positive (negative) sign in relation to the inclusion (exclusion) in an index, these signs are not statistically significant. In this sense, we are also far from the results obtained by Liang & Renneboog (2017) and Cellier et al. (2016) who obtained non-statistically significant signs using social rankings. Our results only support the lack of significance in relation to the announcement for exclusion in a social ranking although that exclusion could be perceived as a proxy of a poor reputation and bad financial performance. Finally, we cannot support those studies that defend penalization when an organization develops sustainability practices considering planetary, social and organizational boundaries (Oberndorfer et al., 2013; Coombes et al., 2011; Bhardwaj et al., 2018).
The contradictory results obtained by previous literature could have been caused by different factors, both at the theoretical and methodological levels. From a theoretical point of view, the composition of a sustainability indicator can lead to biased results. In this sense, Oberndorfer et al. (2013) and Ziegler & Schröder (2010) highlight the lack of consensus in relation to the methodological tools considered by these sustainability indicators. Székely & Knirsch (2005) suggest that arbitrary criteria are behind the sustainability agencies and evaluation techniques they use. Consequently, the level of sustainability defined by an indicator could not be representative. Moreover, some authors consider sustainability indicators to be a symbolic element without any effect on the market valuation achieved by a company (Cañón-de-Francia & Garcés-Ayerbe, 2009). Our results are based on the RobecoSAM Yearbook; this indicator works with all available information, and the techniques are public. Thus, the level of sustainability achieved could be replicated by other agents because of the level of information disclosure. This level of publicity can overcome the possible bias induced by the opacity in the design of other proposals (Paredes-Gazquez et al., 2016).
Considering the methodological level, previous studies have been based on the following hypothesis: the absence of any other events arising from contemporary news may affect different stock prices (Ortas & Moneva, 2011). However, this hypothesis has not been statistically tested because it is an explicit or implicit assumption when authors present their results. The traditional solution to this has been the improvement of the sample under study. The possible proposals range from the study of a longer period of time (Consolandi et al., 2009) to the inclusion of companies from different countries (Cheung & Roca, 2013) to the comparison of diverse sustainability indicators (Schaltegger et al., 2017). These studies have caused a process of mining data of the phenomenon under study. In this study, we propose changes in the statistical method to isolate the effect of other contemporary news. This approach, based on two steps, allows us to monitor the mean abnormal return caused by market variations and to split up those variations related to the level of sustainability. The effect of contemporary news will be absorbed by the abnormal market return, while the impact of the level of sustainability will be contemplated for by the second regression as a variation in this level of return.
After considering both aspects, we conclude that a company can obtain positive abnormal returns if it provides higher levels of sustainability both in the short and long term due to the signs evidence in inclusion and persistence effects. This result has important implications. First, we highlight that companies should try to develop sustainable practices because they could help them maximize their market value. In this sense, investors could anticipate the market reaction considering the information published by the company. Second, this study contributes to the debate about the impact of corporate sustainability in European stock markets. In this sense, the differentiation between inclusion, persistence and exclusion must be considered together with the position of a company in the indicator because the reaction of financial markets is not the same in these cases. Finally, social agencies should be careful in relation to the composition of these indicators. The design of these indicators should contemplate not only the level of sustainability achieved by a company during a year but also the evolution of this level over a longer period of time. This redefinition enables investors to know the commitment of a company in relation to the development of sustainable practices over time.
Moreover, this study provides practitioners with relevant insights for decision-making processes towards the adoption of sustainability management tools. In this sense, belonging to a sustainability ranking, as an innovation of accounting and reporting, enables a more accurate assessment of the level of sustainability performance. Consequently, our results can be translated into practices to provide information on sustainability and to promote relationships with stakeholders. In addition, this study addresses the gap between academics and practitioners by examining these measurement instruments within the sustainability business case. In this sense, sustainability rankings appear as a tool to increase the reputation and brand value. Finally, these results can also be applied by sustainability rating agencies. Thus, these instruments could increase the level of accuracy and reduce the differences between the level of corporate sustainability provided by social agencies and real impact that sustainable practices cause in a company in terms of value.
Some limitations have been detected in this study. In the measurement of the effect of sustainability, we have only used information related to the RobecoSAM Yearbook. Moreover, the results obtained are based on a sample from European countries. The results might change if other indicators are used and other contexts are studied. Furthermore, this indicator is built considering the answers provided by companies in a questionnaire. This information could be biased because it is a self-perception of the organization. For this reason, we also highlight the need for future research to compare these indicators based on perceptual information with other indicators. Similarly, the definition of sustainability should also be considered. In this case, we have focused on a definition where economic, social, environmental and governance criteria are included. However, the advancements in this field could introduce new dimensions in the future that should be tested. Finally, the usefulness of these indicators must be analysed. In this sense, this information could condition the recommendations of analysts and experts about the evolution of the market value of a company. These limitations open future research lines that can develop our understanding about sustainable practices.
Annex 1. Impact of appearance, inclusion, persistence and exclusion in medal display table and gold medal.
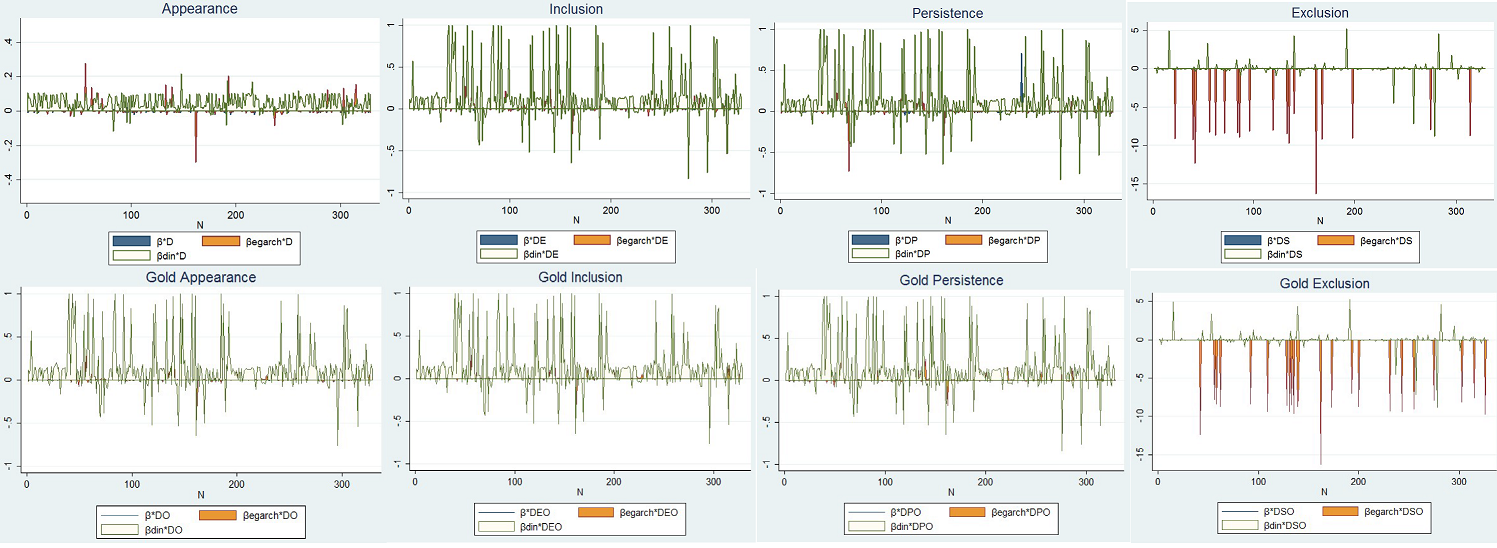
Annex 2. Classification and characteristics by cultural origin
| Group | % Group | Characteristics | Country | % Country | % Country-group |
|---|---|---|---|---|---|
| G1 | 19,453% | Common Law High stakeholders’participation Low equity concentration High minority investor protection Market/management orientation | Denmark | 2,128% | 16.667% |
| Finland | 3,951% | 30.952% | |||
| Norway | 1,824% | 14.286% | |||
| Sweden | 4,863% | 38.095% | |||
| G2A | 19,149% | Civil Law High stakeholders’participation Medium equity concentration Medium minority investor protection Market/management orientation | Austria | 0,608% | 2.353% |
| Germany | 10,638% | 41.176% | |||
| Luxembourg | 0,608% | 2.353% | |||
| Netherlands | 7,295% | 28.235% | |||
| Switzerland | 6,687% | 25.882% | |||
| G2B | 27,356% | Common Law Low stakeholders’participation Low equity concentration High minority investor protection Market orientation | Ireland | 0,304% | 1,111% |
| United Kingdom | 27,052% | 98,889% | |||
| G3 | 34,043% | Civil Law Low stakeholders’participation High equity concentration Low minority investor protection Management orientation | Belgium | 1,824% | 5,357% |
| France | 16,413% | 48,214% | |||
| Italy | 5,775% | 16,964% | |||
| Portugal | 2,128% | 6,250% | |||
| Spain | 7,903% | 23,214% |