Influence of cost systems on efficiency. An analysis of Spanish hospitals using public national databases
ABSTRACT
This paper analyzes whether the level of development of the hospital cost systems (CS) implemented by the Spanish Regional Health Services (RHS) has an effect on hospital efficiency. For this purpose, we used the public data of 159 hospitals of the Spanish National Health System (NHS) between 2010 and 2013, the period of the most stringent budgetary constraints derived from the economic crisis. We apply three methodologies: first, a conventional data envelopment analysis (DEA) model followed by a Tobit regression; second, a two-step procedure with a double bootstrap proposed by Simar & Wilson (2007), and third, the calculation of the Malmquist index and the application of logistic regression to explain the change in efficiency. We find that in the context studied there is a direct relationship between the most developed CS and the improvement of efficiency. Our findings suggest that policy makers and regulators should incentivize the development of standardized hospital CS.
Keywords: Hospital costs, Management accounting and control systems, Efficiency, Data envelopment analysis, National Health Service, Public national databases.
JEL classification: I18, M41, M48
Influencia de los sistemas de costes en la eficiencia. Un análisis de los hospitales españoles utilizando bases de datos públicas nacionales
RESUMEN
Este trabajo analiza si el nivel de desarrollo de los sistemas de costes hospitalarios (SC) implementados por los Servicios Regionales de Salud (SRS) españoles tiene algún efecto en la eficiencia de los hospitales. Para ello, utilizamos los datos públicos de 159 hospitales del Sistema Nacional de Salud (SNS) español entre 2010 y 2013, el período de mayores restricciones presupuestarias derivadas de la crisis económica. Aplicamos tres metodologías: primero, un modelo de análisis envolvente de datos (AED) convencional seguido de una regresión Tobit; segundo, un procedimiento de dos pasos con doble bootstrap propuesto por Simar y Wilson (2007), y tercero, el cálculo del índice Malmquist y la aplicación de regresión logística para explicar el cambio en la eficiencia. Encontramos que en el contexto estudiado hay una relación directa entre un SC más desarrollado y la mejora de la eficiencia. Nuestros resultados sugieren que los responsables políticos y los reguladores deberían incentivar el desarrollo de SC hospitalarios estandarizados.
Palabras clave: Costes hospitalarios, Sistemas de contabilidad y control de gestión, Eficiencia, Análisis Envolvente de Datos, Servicio Nacional de Salud, Bases de datos públicas nacionales.
Códigos JEL: I18, M41, M48
ABSTRACT
1 Introduction
The current consensus is that the primary objective of the provision of health services is to achieve a high value for patients. Since value is defined as health outcomes in relation to costs, it encompasses efficiency (Porter, 2010). Hence, while the main driver for the development of cost systems (CS) in hospitals has been the setting of prices for hospital funding systems, the use of cost data to enable operational process and cost management has become a pressing issue for providers (Chapman et al., 2014). In this context, healthcare management literature highlights the utility of advanced CS1 which provide patient specific unit costs (bottom-up costing or clinical costing) to improve the efficiency in hospitals (Busse et al., 2008; Kaplan & Porter, 2011; Chapman et al., 2016).
Nevertheless, only a few studies have investigated the relationship between CS characteristics and hospital efficiency in large hospital samples and results regarding the contribution of advanced CS to cost control are apparently inconsistent (Lawrence, 1990; Pizzini, 2006; Macinatti & Anessi-Pessina, 2014; García-Cornejo & Pérez-Méndez, 2018a; 2018b). All of these studies use as a proxy of efficiency financial measures such as total operating costs, cost per case or cost per inpatient stay. However, research in healthcare management usually measures hospital efficiency through efficiency indices obtained from frontier methods, with Data Envelopment Analysis (DEA) being the most widely used (Calzado Cejas et al., 1998; Chang et al., 2004; Gok & Altındağ, 2015; Lindlbauer et al., 2016; Pérez-Romero et al., 2017; 2019).
The aim of this paper is to analyze whether the level of development of the hospital CS implemented by the Spanish Regional Health Services (RHS) has effects on the variation of hospital efficiency. For this purpose, we study 159 hospitals of the Spanish National Health System (NHS) between 2010 and 2013, the period of the most stringent budgetary constraints derived from the economic crisis. We use the DEA technique with input orientation. First, we measure the technical efficiency. Second, through a difference-in-differences approach (Wooldridge, 2002), we analyze the effect of advanced CS on the variation in efficiency. In order to do this, we apply two methodologies: first, a conventional DEA model followed by a Tobit regression; and second, a two-step procedure with a double bootstrap proposed by Simar & Wilson (2007). The Malmquist index is also calculated and the change in efficiency is explained through the application of a logistic regression model. In contrast with previous studies that use regional explanatory variables of efficiency such as aging, wealth and public expenditure policies of each autonomous community, we instead focus on hospital management variables, including the level of development of the CS in accordance with the characteristics of the standardized CS implanted by the RHS. We measure the level of CS development using the public information available.
Thus, this work responds to the call of Eldenburg et al. (2017) for using national databases in management accounting research. The operational homogeneity of hospitals and the possibility of controlling characteristics that cause differences between them, such as size, investments, patient-mix or quality, facilitate the identification of those differences arising from the effects of the CS.
This paper contributes to the literature on the design of CS in several ways. First, while this study also builds on earlier works that assess the relative efficiency of healthcare providers, our primary contribution is assessing the impact of the level of development of a management accounting technique, i.e. CS, on hospital operating efficiency. Prior research in the healthcare sector has not yet examined this issue, particularly in a period of economic crisis. As contingency-based literature suggests, in a context of funding uncertainty, organizations make more intensive use of CS for managerial decision-making purposes (Schoute & Budding, 2017b). Second, we contribute to the debate on CS design drawing on the knowledge developed by Abernethy et al. (2001), Drury & Tayles (2005), Pizzini (2006), Al-Omiri & Drury (2007), Brierley (2008), Schoute (2009), Krumwiede et al. (2014) and Schoute & Budding (2017a). We add to this literature by focusing on how to measure the level of development of a CS using only public data. This opens a little-explored field of study: the use of healthcare sector public data with a rich granularity in order to test the effectiveness of management accounting techniques. We also expand the view of how the level of CS development in the hospital setting can be measured.
We find that, in the period analyzed, the overall technical efficiency was reduced, passing from a corrected value of 77.3% in 2010 to 71.8% in 2013. Additionally, we reveal that for the years studied (those subject to the greatest budgetary constraints), a direct relationship exists between the most developed CS and the improvement in efficiency.
2 Literature review
2.1 Hospital cost systems and efficiency
Although the main driver for the development of CS in hospitals has been the setting of prices for hospital funding systems (Chapman et al., 2014), rising healthcare expenditure has put the focus on cost management. That is because cost information supports decisions on resource allocation and effectiveness at system and hospital levels for providers, purchasers and regulators globally (Chapman et al., 2016). In fact, in current competitive reimbursement environments, there are indications that some providers are now implementing more advanced CS. For instance, in the context of standardized CS in Europe, some countries, such as Germany, The Netherlands, and Denmark, have introduced patient-level costing, following a predominantly bottom-up activity-based costing approach. Other countries, e.g., England and Ireland, are currently moving from a predominantly top-down volume-based costing approach towards bottom-up activity-based costing (Chapman et al., 2014). In Spain and Italy, health authorities see the calculation of costs per patient as an objective to be achieved (Instituto de Información Sanitaria, 2012; Istituto Superiore di Sanità, 2018).
Despite the above, only a few studies have investigated the relationship between CS characteristics and hospital efficiency in large hospital samples and their results are inconclusive, necessitating further research. Within the international studies, two of them use samples from hospitals in the United States. In the first, no relationship was found between the type of CS (CS per patient or CS per department) and the cost per case (Lawrence, 1990). In the second, no association was found between the characteristics of the CS and the cost per case, although it was found that the level of detail of the information from the CS was associated with an improvement in administrative costs (Pizzini, 2006). Another study analyzed a sample of public health organizations in Italy and found no relationship between the design of CS and the operating costs (Macinatti & Anessi-Pessina, 2014). In Spain, two recent studies found that an advanced CS contributes to the reduction of the unit cost (cost per adjusted patient day) in the period 2010-2013 (García-Cornejo & Pérez-Méndez, 2018a, 2018b).
All of these papers use financial measures as a proxy for efficiency (total operating costs, cost per case or cost per adjusted patient day). However, current research in healthcare management usually measures hospital efficiency through efficiency indices obtained from frontier methods, with DEA being the most widely used (Calzado Cejas et al., 1998; Gok & Altındağ, 2015; Lindlbauer et al., 2016; Pérez-Romero et al., 2017).
Although several papers have studied the efficiency in Spanish hospitals with DEA technique (see Pérez-Romero et al., 2017 for a review), the most recent studies are mostly regional and focused on analyzing the impact of the type of ownership/management on efficiency (Alonso et al., 2015; Caballer-Tarazona & Vivas-Consuelo, 2016; Franco Miguel et al., 2018; Franco-Miguel & Fullana-Belda, 2020). Only two of them analyze the efficiency of the set of general hospitals of the NHS after the beginning of the economic crisis (Pérez-Romero et al., 2017; 2019) and they mainly use regional explanatory variables of efficiency such as aging, wealth and public expenditure policies of each autonomous community or the type of ownership/management of the hospital. In the present study, we place the focus on hospital management variables, particularly on the level of development of the CS implanted by the RHS.
2.2 Measure of the level of development of the cost system
A major issue in the analysis of the relationship between the type of CS and efficiency is the measure of the level of development of the CS or, equivalently, the design of the CS2. Most of the previous studies in management accounting literature have generally measured CS design in terms of the methods used to identify indirect (or overhead) costs with product (Abernethy et al., 2001; Al-Omiri & Drury, 2007; Schoute, 2009; Schoute & Budding, 2017a). So, they have focused on the number and nature of cost centers (or cost pools) and on the number and nature of cost allocation bases. In particular, survey-based studies have commonly operationalized CS design choices according to the number of cost centers and the number of cost allocation bases used, represented by dummy variables or scale measures derived from the combination of both characteristics (Drury & Tayles, 2005; Al-Omiri & Drury, 2007; Schoute, 2009). The use of these two characteristics is justified because they “represent the dominant determinants of the classification of cost systems and information about them is likely to be relatively reliably obtainable in surveys” (Schoute, 2009). Other research has expanded the measure of CS development with a greater number of characteristics focused on the calculation of product cost (Pizzini, 2006; Krumwiede et al., 2014).
All the cited studies view CS design choices as varying along a continuum of CS development. Recent literature uses a broader conceptualization of CS also considering dimensions related with the environment, purposes of use and understandability of cost information as well as the intensity of use and satisfaction with the CS, all of them in order to test the effectiveness of the CS design (Pizzini, 2006; Brierley, 2008; Schoute, 2009; Schoute & Budding, 2017a).
In a hospital setting, an important characteristic to consider is that an advanced CS involves the level of detail with which direct costs are assigned to patients. CS that provide patient specific unit costs (bottom-up costing or clinical costing) are generally believed to be the gold standard methodology for the costing of hospital services (Tan et al., 2009). They have advantages over other types of CS (such as CS per process or top-down costing, which provide average unit costs per patient) for management control because they facilitate clinical management, price setting and benchmarking (Lehtonen, 2007; Tan et al., 2009; Chapman et al., 2014). Previous research indicates that the bottom-up approach produces reliable cost estimations, even if only used for cost components with a large impact on total costs (usually classified as direct costs) (Tan et al., 2009).
In line with the foregoing, the studies that analyze large samples of hospitals, have measured the level of CS design in terms of cost detail although they have also considered other characteristics such as cost classification according to behavior, frequency of cost information reporting and variance analysis (Lawrence, 1990; Pizzini, 2006; Macinatti & Anessi-Pessina, 2014). These studies have obtained information from hospital surveys and measure the CS with a dummy variable (cost by department or by patient) or using factor analysis to represent different dimensions of the CS. The problem here is how to operationalize CS design alternatives using exclusively public information sources that offer scarce data about CS characteristics.
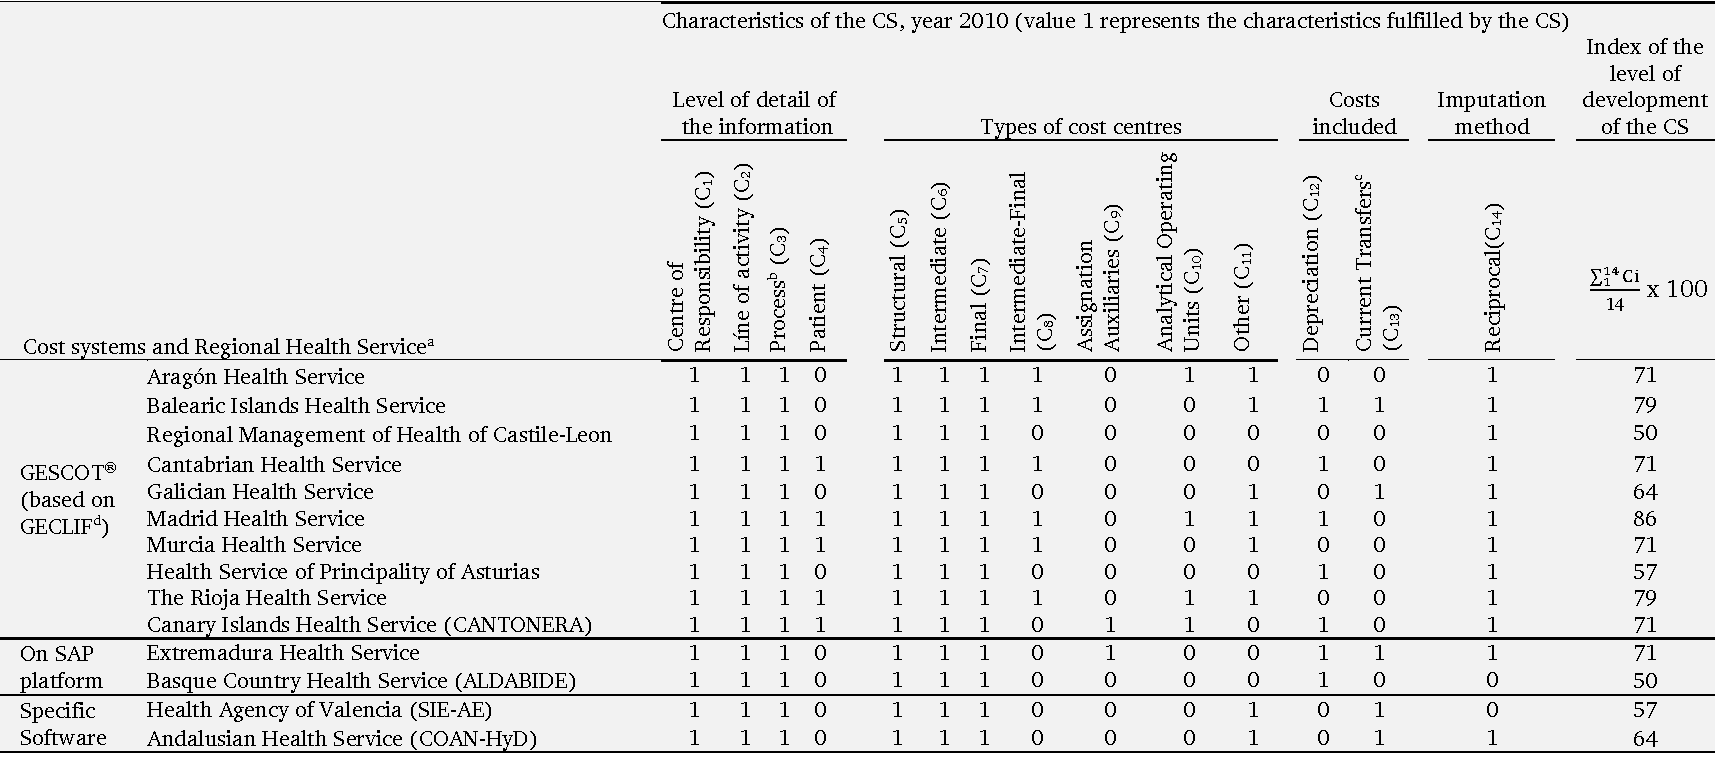
In Spain, the last available document in which the level of development of the CS of NHS hospitals is evaluated by a score collects data for the year 2000, although only for hospitals that had not yet received competences in health matters and used the CS model imposed at the central level (Instituto Nacional de la Salud, 2001a). Subsequently, with the responsibilities in healthcare management already in the hands of the RHS, there has not been a systematic collection of information about the CS until 2010, giving rise to the publication of the report Analysis of Analytical Accounting Systems in the NHS Hospitals (Instituto de Información Sanitaria, 2012). This report collects the different characteristics and costing methodologies for the year 2010 of the standardized CS implanted by the RHS. In the present paper, we have tried to take full advantage of the available public data in order to construct a proxy of the level of development of each CS.
Thus, inspired by prior research (Krumwiede et al., 2014; Al-Omiri & Drury, 2007; Schoute & Budding, 2017a), we have defined an index for each RHS based on the following indicative dimensions of more developed CS: level of detail of the information offered, different types of cost centers, costs included in the product and cost imputation methodology.
Level of detail or disaggregation of the information offered. The cost information at the patient level, more detailed than the information at the cost center or process level, facilitates management by clinicians, improves the precision in the calculation of the price of services and can be used by the managers for benchmarking (Lawrence, 1990; Pizzini, 2006).
Different types of cost centers. Increasing the number of types of cost centers can improve the allocation and the precision in the calculation of costs, for example by allowing the separation of non-assignable costs to the hospitalization area (Subdirección General de Información Sanitaria e Innovación, 2013). Furthermore, cost pools would be mapped onto areas of decision-making responsibility in order to align cost analysis and decision-making structures. With misalignment a risk exists that any savings from service redesigns are unlikely to ultimately translate themselves into changes in resource spending (Chapman et al., 2016).
Costs included in the product. The more cost categories that are included in the final output the more developed the CS (Krumwiede et al., 2014). Specifically, a precise calculation of the amortization requires that the hospital has an inventory of fixed assets correctly identified by cost centers as well as the realization of estimates for the different elements (useful life, annual practical capacity).
Cost imputation methodology. Different methods can be used to allocate costs between cost centers with potentially different results on the total assigned cost. The reciprocal method is conceptually the most accurate because it allows a reflection of all existing inter-consumptions between the centers (for example inter-consultations or inter-service transfers) (Subdirección General de Información Sanitaria e Innovación, 2013).
Given the above, more developed CS are those that can provide greater detail, define more types of cost centers, include more cost categories in the calculation, and use a more accurate imputation methodology.
Although there is still limited evidence in this regard, we sustain that more developed CS produce ‘‘better’’ (i.e., more relevant and useful) data that enhance managerial decision-making, and thereby lead to improved efficiency (Pizzini, 2006; Szczesny & Ernst, 2016). Also it should be noted that we study a period which subjected Spanish NHS hospitals to the most stringent budgetary constraints derived from the economic crisis. This could have led health managers to put more emphasis on cost containment and the use of CS data (Hill, 2000; Schoute & Budding, 2017a; 2017b). Here we follow the contingency-based literature on management accounting and control systems (MACS), in assuming that when environmental and funding uncertainty increase, organizations make more intensive use of CS for managerial decision-making purposes (Schoute & Budding, 2017b).
Accordingly, our hypothesis is that the level of development of the CS is positively associated with improved efficiency in hospitals.
3 Data and methods
The Spanish NHS offers an appropriate framework for researching the relationship between hospital CS and technical efficiency for two reasons.
First, it is characterized by a high level of decentralization where the jurisdiction over healthcare is split into seventeen RHS. RHS are the organism created by Spain’s autonomous communities (Spanish regional governments) to manage healthcare responsibilities and it is they that decide which type of CS should be implemented in the hospitals under their supervision (Instituto de Información Sanitaria, 2012). Indeed, although theoretical models such as Lüder's contingency model, explain accounting changes in the public sector as result of various social, political, administrative and stakeholders’ role factors (Lüder, 1994), previous research in the Spanish health sector indicates that the promoters and drivers of reforms in cost accounting are the central services of the RHS (Calzado Cejas, 2005). This setting allows us to examine the effect on efficiency of the alternative CS whose implementation is encouraged by regional health authorities, something that is relatively exogenous with respect to each hospital, the latter allowing us to address endogeneity problems.
Second, we analyze a four-year time frame (2010-2013) because it seems reasonable for the relationship that we focus on. Indeed, we assume that in our research setting:
1) It is unlikely that CS have changed drastically during the period considered given that CS are expensive to procure and generally have an associated implementation period linked to both technical and organizational factors (Sharma et al., 2016; Escobar-Rodríguez & Bartual-Sopena, 2015). We consider that the characteristics of the CS have been maintained during the years 2010 to 2013.
2) After a period of time (three or four years) the CS must be updated to continue being effective in improving costs (Labro & Stice-Lawrence, 2018). Moreover, we believe that beyond a period of four years the precision in the measurement of the variable development of the CS would reduce considerably.
3) Between 2010 and 2013 the Spanish Government adopted the main measures for containing healthcare expenditure as a result of the crisis (Bandrés & González, 2015). Thus, it may in fact prove to be a period during which health managers focused on cost control and used the information from CS for operational control purposes to a larger extent (Hill, 2000; Schoute & Budding, 2017a; 2017b). In circumstances of greater funding uncertainty it is likely that RHS and hospitals may be more inclined to undertake cost control and/or reduction initiatives.
3.1 Data
For the empirical analysis we have constructed a database of Spanish NHS hospitals using the microdata from two sources: the Specialized Healthcare Centre Statistics (SIAE) and the Indicators and axes of analysis of the CMBD (ICMBD), published by the Ministry of Health, Consumption and Social Welfare. Of the 764 hospitals included in the Statistics for 2013, 453 make up the NHS hospital network, called Public-NHS. This network includes the hospitals of public dependency (including Ceuta and Melilla hospitals, managed by the state administration through the National Institute of Health Management), the network of hospitals of public utilization in Catalonia, the hospitals with substitute agreements and the hospitals of mutual associations which collaborate with the Social Security.
Together with the hospital microdata, we have considered as an additional data source, the previously mentioned report Analysis of Analytical Accounting Systems in the NHS Hospitals (Instituto de Información Sanitaria, 2012). The report does not include information for the following regional health services: the Catalonia Health Service (because it did not have a homogeneous analytical accounting system implemented in its hospitals), the Navarre Health Service (because it did not have a consolidated system for estimating costs) and the Castile-La Mancha Health Service (where the report does not indicate the reason for the data omission). Accordingly, the hospitals of these three RHS were not included in the study3.
Crossing the data from the three sources used (SIAE, ICMBD and the report Analysis of Analytical Accounting Systems in the NHS Hospitals) has reduced the sample size from 453 to 159 acute hospitals (which group general and specialized hospital and exclude medium and long stay hospitals) corresponding to twelve RHS. This is for two reasons. On the one hand, the information provided by de Ministry of Health did not allow us to match the codes of the anonymous hospitals of SIAE and ICMBD in all the cases. On the other hand, we had to omit hospital data for the three aforementioned RHS (Catalonia, Castile-La Mancha, Navarre) and for La Rioja and the Balearic Islands. In the case of La Rioja, because hospitals are grouped with those in Ceuta and Melilla, and in the case of the Balearic Islands because of data omission, which prevented us maintaining a constant sample.
The monetary data have been deflated according to the evolution of the Consumer Price Index and are expressed in euros at current prices for 2013.
3.2 Efficiency analysis and explanatory variables of efficiency
First, the efficiency of hospitals between 2010 and 2013 will be analyzed using non-parametric DEA methodology. Second, in order to analyze the effect of the level of development of the CS and other control variables on hospital efficiency a difference-in-differences approach is used.
We apply a DEA model with input orientation to obtain the overall technical efficiency (OTE), with the resolution of a CCR model (Charnes et al., 1978), which in turn is the product of pure technical efficiency (PTE), determined from the resolution of a BCC model (Banker et al., 1984) and scale efficiency (SE):
OTE = PTE x SE
The units that reach a value of 1 as an efficiency score are considered as efficient and the units that have a value less than 1 are considered inefficient.
The DEA model requires selecting an input or an output orientation. We have applied an input orientation because traditionally studies evaluating hospital efficiency assume minimization of inputs for a given level of outputs (input orientation) rather than a maximization of outputs for a given level of inputs (output orientation) (Lindlbauer et al., 2016). The input orientation is justified based on assumption that hospitals take public demand for health care as given, and have to manage their inputs in order to meet this demand, which is not controlled by those hospitals (Rego et al., 2010). Other authors also argue that hospital managers and policy-makers generally have more control over their inputs compared to their outputs, and, in most countries, the emphasis is more on controlling costs rather than increasing the demand for health care (O’Neill et al., 2008).
Another question to be addressed when formulating the model is the returns to scale assumption. In the early DEA paper by Charnes et al. (1978), efficiency is measured assuming constant returns to scale (CRS), whereas Banker et al. (1984) (BCC) extend this to accommodate a more flexible model with variable returns to scale (VRS). In a review on DEA-based hospital efficiency studies, O’Neill et al. (2008) point out that about half of the latter assume CRS, and the remainder consider either VRS or both CRS and VRS. In the present paper, efficiency is calculated using both models (CRS and VRS). Given that in the period analyzed hospitals have adjusted their management variables and their productive scale in different ways, we believe that the most advanced CS can have an effect on pure efficiency as well as on scale efficiency, so we use it as a variable to explain the OTE. Indeed, the CRS assumption indices are those which identify overall efficiency, whilst the VRS orientated indices only considers pure technical efficiency, losing scale efficiency (Solana et al., 2017).
For the selection of inputs and outputs, we have based ourselves on previous studies (Gok & Altındağ, 2015; Alonso et al., 2015; Lindlbauer et al., 2016; Pérez-Romero et al., 2017). We choose five inputs and four outputs, which are described in the following.
As inputs, we use the number of beds, the number of doctors, other health personnel, non-health personnel and the total expenditure on supplies and external services. The number of beds is a proxy for hospital size and capital investment and has been the most widely used input in hospital efficiency studies (Alonso et al., 2015). Supplies and external services represent the amount spent on supplies each year and is used as a proxy for material resources (Lindlbauer et al., 2016). It includes operational expenses4 but excludes payroll and depreciation expenses. To account for labor input, we use three variables separated according to labor type: number of doctors (doctors), number of other clinical staff (other health personnel), and number of non-clinical staff members (non-health personnel). All of these are proxies for hospital labor and human capital (Alonso et al., 2015).
As outputs we have considered the number of adjusted discharges (hospital discharges, derived from medical and surgical stays, weighted by the case-mix index), the number of outpatient consultations, emergencies and ambulatory surgery procedures. The use of weighting discharges ensures the comparability of hospitals with different patient heterogeneity (i.e., case-mix) (Lindlbauer et al., 2016). Using output variables without weights can be problematic in efficiency analysis because hospitals with a more complex case-mix are likely to obtain lower efficiency scores (Tiemann & Schreyögg, 2012). We adjust hospital discharges by applying the average Spanish weight (usually called case-mix index or casuistic index). The average weight is defined as the weighted average of the weights of the diagnostic-related groups5 (DRG's) of all the patients of a certain unit, group or provider. Weights greater than 1 indicate an above-average case-mix complexity (and predicted resource intensity and cost) and vice versa. The sum of the discharges of each hospital multiplied by the weight of the hospital generates the adjusted discharges.
Following the rule suggested by Banker et al. (1989) we have a sufficient sample size to apply the DEA methodology with five inputs and four outputs (159>= max {5 × 4, 3 × (5 + 4)}).
Table 1 shows the mean values of inputs and outputs used.
Table 1. Mean values of inputs and outputs used in measuring efficiency (n =159)
| Variables | Definition | 2010 | 2011 | 2012 | 2013 |
|---|---|---|---|---|---|
| Inputs | |||||
| Beds | Total number of hospital beds | 413 | 406 | 397 | 392 |
| Doctors | Total number of doctors | 312 | 314 | 310 | 304 |
| Other health personnel | Total number of nursing staff and other health workers | 1,086 | 1,080 | 1,042 | 1,023 |
| Non-health personnel | Total number of non-health workers | 487 | 478 | 456 | 447 |
| Supplies and external services | Total expense in supplies and external services in thousands of € | 57,669 | 60,825 | 59,999 | 57,962 |
| Outputs | |||||
| Adjusted dischargesa | Total number of case-mix adjusted discharges | 16,429 | 16,536 | 16,444 | 16,665 |
| Outpatients | Total number of outpatient visits | 313,678 | 320,441 | 317,721 | 326,013 |
| Emergencies | Total number of emergency discharges | 74,408 | 75,580 | 71,410 | 72,311 |
| Ambulatory surgery | Total number of ambulatory major surgery procedures | 3,907 | 4,142 | 4,316 | 4,525 |
a It includes both the discharges derived from medical and surgical stays. Hospital discharges were adjusted according to their complexity by applying the average Spanish weight (usually called case-mix index or casuistic index). The average weight is defined as the weighted average of the weights of the diagnostic-related groups (DRG's) of all the patients of a certain unit, group or provider.
Table 2 describes the explanatory variables of efficiency. The variable of main theoretical interest is the level of development of standardized CS. As previously stated, the measure of this variable has been inspired by previous research, using an index for each RHS according to four dimensions indicative of a more developed CS. The index, its calculation and the values obtained for each RHS can be consulted in a previous study (García-Cornejo & Pérez-Méndez, 2018b) and in the appendix of the present work.
Moreover, based on prior literature, we consider additional control variables as possible determinants of efficiency: average cost of personnel (Wu et al., 2014), occupancy rate (Puig Junoy, 1988; Lawrence, 1990; Wu et al., 2014); endowment of high technology6 and teaching status (Sloan et al., 1983; Vitaliano, 1987); and, as quality indicators, ambulatory surgery rate (SECA, 2012) and readmission rate (Alonso et al., 2015).
Table 2. Description of the explanatory variables of efficiency
| Variables | Definition |
|---|---|
| Level of development of standardized cost system (CS)a (index in %) | Index of the level of development of the standardized CS implanted by the different Regional Health Services, which take values between 0 and 100 according to the number of characteristics (Ci) fulfilled by the CS: |
| Level of detail of the information, that considers four characteristics: Centre of responsibility (C1), Line of activity (C2), Process (C3), Patient (C4) | |
| Number of types of cost centers, that takes into account seven characteristics: Structural (C5), Intermediate (C6), Final (C7), Intermediate-Final (C8), Assignation auxiliaries (C9), Analytical operating units (C10), Other (C11) | |
| Costs included (as well as staff, current goods and services and health assistance agreements), which considers: Depreciation (C12), Current transfers (C13) Imputation methodology: Reciprocal method (C14) $$Index\ of\ development\ of\ the\ standardized\ CS = \frac{\sum_{1}^{14}\text{Ci}}{\mathrm{14}}x100$$ | |
| Advanced cost system (ACS)(dummy) | Value 1 represents a level of development of the CS equal to or above the median and value 0 a level of development of the CS inferior to the median |
| Endowment of high technology b (%) | Saidin Index (Sharma et al., 2016). This index is a weighted sum of the number of high technologies used by the hospital from a predetermined list. The weight of each technology is the percentage of hospitals in the sample that do not have the technology. We consider 12 high technologies (linear accelerator, Digital Angiography, cobalt pump, densitometer, haemodialysis equipment, CAT scan, PET, Magnetic resonance, gamma camera, lithotripter, mammography, spectrometers) |
| Average cost of personnelb,c (thousands of €) | Staff cost / Average number of workers (includes doctors, other health personnel and non-health personnel) |
| Occupancy rate b (%) | Total stays / Total days of operational beds |
| Ambulatory surgery rated (%) | Number of surgical interventions without admission / Total surgical interventions |
| Readmission rated (%) | Number of discharges due to readmissions / Total number or discharges |
| Teaching statusb (dummy) | Value 1 represents teaching hospitals and value 0 other hospitals |
a We assume that the characteristics are constant during the period 2010-13. The calculation of the index is available in the appendix of this study.
b Source: Sistema de Información de Atención Especializada (SIAE). Ministerio de Sanidad, Servicios Sociales e Igualdad. Available at: https://www.mscbs.gob.es/estadEstudios/estadisticas/estHospiInternado/inforAnual/homeESCRI.htm
c The monetary data have been deflated according to the evolution of the Consumer Price Index and are expressed in Euros at current prices for 2013.
d Source: Indicadores y ejes de análisis del CMBD (ICMBD). Ministerio de Sanidad, Consumo y Bienestar Social. Available at: http://icmbd.es/login-succes.do
3.3 Difference-in-differences approach
We use a difference-in-differences methodology to estimate the treatment effect: the application of a more developed CS. We compare the differences before and after treatment on the level of OTE of two groups: a set of hospitals with an advanced CS (ACS = 1) and the control group, consisting of hospitals with a less developed CS, denominated non-advanced CS (ACS = 0). The dummy variable ACS is defined, based on the level of development of standardized CS index. The advanced CS group includes hospitals that have an index equal to or above the median value (index = 64%) of all the hospitals in the sample whereas the non-advanced CS group incorporates those that have a value inferior to the median.
We consider 159 hospitals of which 103 have an advanced CS and the remaining 56 form the control group. We estimate the following model:
$$\begin{split} \text{OTE}_{i} & = \beta_{0} + \beta_{1}\ \text{period}_{i} + \ \beta_{2}\ \text{ACS}_{i}\\ &\quad + \beta_{3}\ \text{period}_{i}\text{\ x\ A}\text{CS}_{i} + \sum_{k = 1}^{6}{\delta_{k}z_{\text{ki}}} + e_{i} \end{split} \ \ \boldsymbol{(1)}$$
As already indicated OTE is the overall technical efficiency of hospitals. Period is a dummy variable that indicates the base period (Period = 0 when the year is 2010) and the period after the treatment (Period = 1 if the year is 2013). Additionally, the ACS dummy variable represents the treatment and zki represents the 6 control variables: endowment of high technology, average cost of personnel, occupancy rate, ambulatory surgery rate, readmission rate, and the teaching status (dummy).
We understand that ACS is an exogenous variable since the level of development of the CS is not determined by the hospitals but by the central services of the RHS.
The coefficients of equation 1 have the following interpretation:
β0: is the average of the efficiency for the control group in the base period.
β0 + β1: is the average of the efficiency in the control group in the post treatment period.
β2: is the difference in efficiency between the treated group and the control group in the base period.
β0 + β2: is the average of the efficiency in the group treated in the base period.
β0 + β1 + β2 + β3: is the average of the efficiency in the group treated in the period after treatment.
β3: is the differences-in-differences estimator, which represents the average of the treatment effect (in our case, the application of an advanced CS).
δk: represents the coefficients of the control variables.
Two estimates of the model difference in differences are shown. First, a Tobit estimate of the determinants of overall efficiency obtained from the basic CCR model is presented. Second, a two-step procedure with double bootstrap proposed by Simar & Wilson (2007) is carried out, so that in the first stage the efficiency values corrected by the bias are determined (2,000 replications), while in the second stage we study the factors that could influence the efficiency levels through a truncated bootstrap regression (2,000 replications) (Solana et al., 2017; Prior et al., 2019; Badunenko & Tauchmann, 2019).
4 Results
The results have been obtained with the Stata 14.2 program after applying the aforementioned econometric methodology.
Table 3 shows the average value of inputs, outputs and explanatory variables of efficiency for 2010 and 2013 according to the level of development of CS.
Table 3. Mean values of inputs, outputs and explanatory variables according the level of development of the CS
| Variables | 2010 | 2013 | ||||
|---|---|---|---|---|---|---|
| CS Non-advanced (n=56) | CS Advanced (n=103) | Mann-Whitney test | CS Non advanced (n=56) | CS Advanced(n=103) | Mann-Whitney test | |
| Inputs and outputs used in measuring efficiency | ||||||
| Inputs | ||||||
| Beds | 396 | 422 | 371 | 403 | ||
| Doctors | 295 | 321 | 293 | 311 | ||
| Other health personnel | 964 | 1.153 | 921 | 1.079 | ||
| Non-health personnel | 402 | 534 | 393 | 477 | ||
| Supplies and external services (thousands of €) | 54,902 | 59,173 | 56,974 | 58,500 | ||
| Outputs | ||||||
| Adjusted discharges | 16,257 | 16,523 | 16,909 | 16,533 | ||
| Outpatients | 296,476 | 323,030 | 304,536 | 337,689 | ||
| Emergencies | 63,101 | 80,555 | 61,210 | 78,347 | * | |
| Ambulatory surgery | 3,830 | 3,949 | 4,551 | 4,511 | ||
| Explanatory variables of efficiency | ||||||
| Endowment of high technology (Saidin index) | 1.88 | 1.95 | 2.00 | 2.02 | ||
| Average cost of personnel (thousands of €) | 53.05 | 49.74 | *** | 47.41 | 44.04 | *** |
| Occupancy rate (%) | 72.84 | 76.28 | ** | 74.17 | 74.48 | |
| Ambulatory surgery rate (%) | 41.03 | 45.38 | *** | 44.32 | 50.47 | * |
| Readmission rate (%) | 7.95 | 7.12 | ** | 7.88 | 7.57 | *** |
| Teaching status (dummy) | 0.79 | 0.75 | 0.84 | 0.80 | ||
*, **, *** Significant at 10%, 5% and 1%, respectively.
In general, there are no significant differences in the value of the inputs and outputs of the two groups of hospitals, except in the case of emergencies in 2013, where a higher value is observed in hospitals with an advanced CS. There is a reduction in the number of beds and workers between 2010 and 2013 in both groups. The Mann-Whitney test indicates that in both 2010 and 2013, hospitals with an advanced CS have a lower value in the average cost of personnel and in the readmission rate. On the other hand, hospitals with an advanced CS have a higher ambulatory surgery rate and a higher occupancy rate, although for this last variable only in 2010.
Table 4 shows the average efficiency scores obtained for the sample between 2010 and 2013, with a reduction in efficiency indices, both in the original values and in those corrected for bias (bootstrapping with 2,000 replications). The values of the corrected efficiency are lower than those of the original efficiency, since the latter do not take into account the sample noise. In 2010, the corrected OTE stood at 77.3%, which means that 2010 production could be achieved with 77.3% of input consumption. In 2013 this efficiency is reduced to 71.8%, signifying that 2013 production could be reached with 71.8% of input consumption.
Table 4. Technical efficiency (n = 159)
| 2010 | 2011 | 2012 | 2013 | ||
|---|---|---|---|---|---|
| Original OTE (CRS) | Mean | 0.861 | 0.836 | 0.833 | 0.822 |
| Sd | 0.111 | 0.115 | 0.113 | 0.114 | |
| Min | 0.532 | 0.498 | 0.511 | 0.501 | |
| Max | 1 | 1 | 1 | 1 | |
| Number of efficient hospitals (CRS) | 39 | 29 | 27 | 27 | |
| % of efficient hospitals | 24,53 | 18,24 | 16,98 | 16,98 | |
| Corrected OTE (CRS) | Mean | 0.773 | 0.731 | 0.735 | 0.718 |
| Original PTE (VRS) | Mean | 0.894 | 0.880 | 0.876 | 0.872 |
| Sd | 0.107 | 0.111 | 0.112 | 0.117 | |
| Min | 0.564 | 0.522 | 0.600 | 0.583 | |
| Max | 1 | 1 | 1 | 1 | |
| Number of efficient hospitals (CRS) | 52 | 49 | 45 | 44 | |
| % of efficient hospitals | 32,70 | 30,82 | 28,30 | 27,67 | |
| Corrected PTE (VRS) | Mean | 0.786 | 0.762 | 0.758 | 0.761 |
Table 5 disaggregates the results of the efficiency scores by regions (CRS and VRS). There is a wide variability between autonomous communities in the average value of the efficiency in the years 2010-2013, oscillating in 2013 for the CRS model between 0.681 in the Canary Islands and 0.948 in the Basque Country.
Table 5. Efficiency scores by autonomous communities
| Original Efficiency Scores | CRS/VRS | 2010 | 2011 | 2012 | 2013 |
|---|---|---|---|---|---|
| Andalusia (n=32) | CRS | 0.890 | 0.859 | 0.863 | 0.858 |
| VRS | 0.942 | 0.918 | 0.917 | 0.917 | |
| Aragon (n=11) | CRS | 0.772 | 0.753 | 0.799 | 0.829 |
| VRS | 0.817 | 0.800 | 0.839 | 0.870 | |
| Asturias (n=9) | CRS | 0.839 | 0.798 | 0.789 | 0.763 |
| VRS | 0.874 | 0.826 | 0.817 | 0.793 | |
| Basque country (n=9) | CRS | 0.972 | 0.973 | 0.963 | 0.948 |
| VRS | 0.982 | 0.983 | 0.985 | 0.985 | |
| Canary Islands (n=7) | CRS | 0.708 | 0.696 | 0.697 | 0.681 |
| VRS | 0.736 | 0.743 | 0.740 | 0.713 | |
| Cantabria (n=3) | CRS | 0.866 | 0.863 | 0.845 | 0.785 |
| VRS | 0.888 | 0.880 | 0.858 | 0.840 | |
| Castile-Leon (n=14) | CRS | 0.851 | 0.841 | 0.811 | 0.798 |
| VRS | 0.871 | 0.872 | 0.839 | 0.861 | |
| Extremadura (n=5) | CRS | 0.799 | 0.848 | 0.774 | 0.749 |
| VRS | 0.828 | 0.877 | 0.805 | 0.788 | |
| Galicia (n=14) | CRS | 0.863 | 0.831 | 0.837 | 0.801 |
| VRS | 0.896 | 0.890 | 0.885 | 0.854 | |
| Madrid (n=24) | CRS | 0.915 | 0.874 | 0.875 | 0.878 |
| VRS | 0.961 | 0.947 | 0.948 | 0.945 | |
| Murcia (n=7) | CRS | 0.784 | 0.740 | 0.713 | 0.719 |
| VRS | 0.806 | 0.772 | 0.735 | 0.743 | |
| Valencia (n=24) | CRS | 0.856 | 0.830 | 0.832 | 0.805 |
| VRS | 0.872 | 0.852 | 0.862 | 0.847 |
Table 6 shows the results of the two estimates regarding the determinants of efficiency and its variation from 2010 to 2013. The Tobit model takes as its dependent variable the original efficiency, while the Simar-Wilson model considers the efficiency corrected in a bootstrap procedure.
Table 6. Determinants of efficiency (CRS). Difference in differences approach (n = 318)
| Tobit | Simar-Wilson | |||
|---|---|---|---|---|
| Coef. | Sig. | Coef. | Sig. | |
| Period (dummy) | -0.0550 | *** | -0.0688 | *** |
| ACS (dummy) | -0.0458 | *** | -0.0304 | ** |
| Period x ACS | 0.0368 | * | 0.0328 | * |
| Endowment of high technology (Saidin index) | -0.0040 | -0.0060 | ** | |
| Average cost of personnel (thousands of €) | 0.0025 | *** | 0.0014 | ** |
| Occupancy rate (%) | 0.0038 | *** | 0.0037 | *** |
| Ambulatory surgery rate (%) | 0.0027 | *** | 0.0009 | ** |
| Readmission rate (%) | -0.0115 | *** | -0.0021 | |
| Teaching status (dummy) | -0.0590 | *** | -0.0110 | |
| Constant | 0.5089 | *** | 0.4424 | *** |
*, **, *** Significant at 10%, 5% and 1%, respectively.
The effect of the treatment (Period x ACS) is positive and significant. The effect of an advanced CS (ACS = 1) is quantified from 2010 to 2013 by an increase in efficiency (OTE) of 3.68% in the Tobit model and of 3.28% in the Simar-Wilson estimate.
The results also show a direct relationship between the OTE and the average cost of personnel, the occupancy rate and the ambulatory surgery rate. On the other hand, in the case of the Tobit model, there is a negative relationship between the OTE and the teaching status of the hospital and the readmission rate. Additionally, a negative effect exists for the endowment of high technology in the Simar-Wilson model.
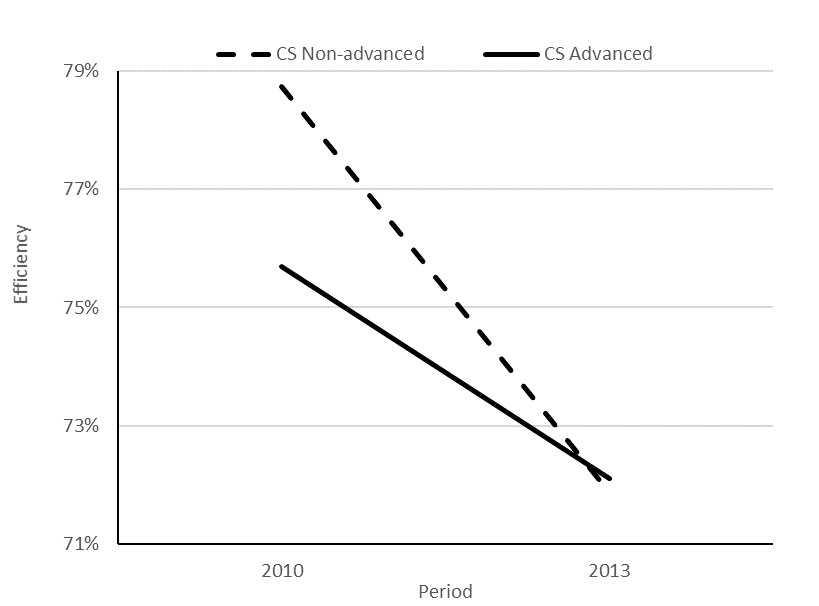
From the Simar-Wilson estimation we have made a prediction of the efficiency for 2010 and 2013 according to treatment (ACS). In Figure 1 it is observed that the group of hospitals that have a more advanced CS presents a reduction in the estimated efficiency from 75.7% to 72.1%, while in the case of hospitals with a non-advanced CS the efficiency decreases more, from 78.7% to 71.9%. There is a positive differential effect on efficiency due to the use of an advanced CS.
Figure 1. Predictions of efficiency for 2010 and 2013 according to the level of CS development
4.1 Change in the productivity of hospitals
In order to quantify changes in hospital productivity we have calculated the Malmquist index (MI) with input orientation and CRS. Values of the MI higher than 1 reflect an increase in productivity from the initial period (2010) to the final period (2013), with the opposite occurring in the case of a value lower than unity. The MI is broken down into the product of two new indices, one that expresses the change in technical efficiency (EC) and another, which measures the variation of the efficiency frontier for the periods considered, reflecting the technological change (TC). The two components of the MI can take values higher, less than or equal to 1 (Thanassoulis, 2001; Martínez Franco & Guzmán Raja, 2014), interpreted in a similar way to that seen for the MI.
MI = EC x TC
Table 7 shows the MI and its decomposition in terms of EC and TC. Also presented is the MI obtained from a bootstrap procedure with 2,000 replications (MIb), performed using the package Deatoolbox for Matlab (Álvarez et al., 2016). The results indicate an increase in total factor productivity of 6.3% (8.4% in the case of MIb), which according to the decomposition of the index is attributable to the technological progress of the hospitals (9.9%) whilst at the same time a reduction originated by the change in the efficiency is observed (3.5%). Although there are no significant differences in MI among hospitals according to the level of development of the CS, the Mann-Whitney test identifies differences in its components, so that the group of advanced CS presents a better behavior in terms of the changes in efficiency, while in the case of technological change the opposite occurs.
Table 7. Malmquist Index and its decomposition (2010-2013)
| Period | Sample (n=159) | CS Non-advanced (n=56) | CS Advanced (n=103) | Mann-Whitney test |
|---|---|---|---|---|
| MI | 1.063 | 1.056 | 1.067 | |
| Efficiency change (EC) | 0.965 | 0.948 | 0.974 | ** |
| Technological change (TC) | 1.099 | 1.111 | 1.094 | *** |
| MIba | 1.084 | 1.088 | 1.082 |
**, *** Significant at 5% and 1%, respectively.
a MIb: Malmquist index performed by bootstrapping with 2,000 replications.
In order to identify those factors characterizing hospitals that serve to improve their efficiency compared to those that show worse behavior, and as a robustness test of the results obtained from the difference in differences approach, we apply the logistic regression technique. The latter is a conditional probability model that allows calculating the probability of obtaining each value of a dichotomous dependent variable given a set of predictor variables (Maddala, 1986).
We order the sample according to the MI component that measures the change in efficiency (EC), generating a dummy dependent variable to reflect the change of efficiency, which takes a zero value for hospitals with an EC value less than 0.97 (efficiency reduced by more than 3%) and value 1 for those with an EC value equal to or higher than 1 (they have maintained or increased their level of efficiency). We have omitted in this analysis 16 hospitals that have reduced their efficiency by less than 3%. From this definition of the dependent variable, we try to establish a functional relationship to classify the hospitals of the sample in each of the two groups. After the indicated steps, we work with a group of 143 hospitals, 85 with zero value in the dependent variable, and another 58 with value 1.
We used two models. We take as an explanatory variable the level of development of the CS measured as an index (ACS index) in Model 1 and as a dummy variable (ACS) in Model 2. In both models we use as other explanatory variables the values in 2013 of high technology endowment, the average cost of personnel, the teaching status of the hospital, and the variation in the period 2010-13 of the ambulatory surgery rate, the readmission rate and the occupancy rate.
Table 8 shows the results of the logistic regression that explain the classification of hospitals according to changes in efficiency between 2010 and 2013.
Table 8. Results of logistic regression
| Model 1 | Model 2 | |||
|---|---|---|---|---|
| Coef. | Sig. | Coef. | Sig. | |
| ACS (index) | 0.0381 | ** | --- | |
| ACS (dummy) | --- | 0.8503 | ** | |
| Endowment of high technology (Saidin index) | -0.1397 | -0.1231 | ||
| Average cost of personnel (thousands of €) | -0.0006 | 0.0102 | ||
| Variation occupancy rate (%) | 0.0644 | ** | 0.0678 | ** |
| Variation ambulatory surgery rate (%) | -0.0078 | -0.0110 | ||
| Variation readmission rate (%) | 0.1262 | 0.1425 | ||
| Teaching status (dummy) | -0.8758 | ** | -0.8152 | ** |
| Constant | -1.6611 | -0.2724 | ||
| Hospitals correctly classified (%) | 68.53 | 65.03 | ||
** Significant at 5%.
The variable of theoretical interest in this work, measured as an index or as a dummy, is significant, contributing positively to the improvement of efficiency. On the other hand, the increase in the occupancy rate positively affects the change in efficiency, while the teaching status shows a negative and significant association with the change in efficiency.
5 Discussion
This work is one of the first to analyze the efficiency of Spanish NHS hospitals after the beginning of the economic crisis, specifically over the period 2010-2013. Moreover, it is the first to use as an explanatory variable of the evolution of efficiency a management variable such as the level of development of hospital CS implanted by the RHS.
Our analysis shows that, in the period considered, although there was a reduction in public healthcare expenditure, technical efficiency also decreased. That means that other variables influenced the changes in efficiency such as those described below.
Our results indicate a direct relationship between more advanced CS and the efficiency, measured through the variation of the OTE. This finding appears to differ from prior research that fails to establish a relationship between more advanced CS and efficiency, measured in terms of operative costs (Lawrence, 1990; Pizzini, 2006; Macinatti & Anessi-Pessina, 2014). Nevertheless, the existence of this apparent inconsistency should be interpreted with caution given the heterogeneity of the countries analyzed, the time horizon and the methodology used.
We could attribute our results to the fact that, in contrast with the aforementioned studies, we consider the efficiency variation over a period of four years, which allows capturing to some extent the benefits derived from the use of CS over time. The implementation of CS is a long-term investment and the results of its application may take time to be reflected. Moreover, we have considered a period which subjected Spanish NHS hospitals to the most stringent budgetary constraints derived from the economic crisis. Therefore, it may be a period during which the health managers prioritized cost control and used information from the CS to a greater extent (Hill, 2000; Schoute & Budding, 2017a; 2017b). Thus, our result would be consistent with the hypothesis that managers focus on cost information from CS to contain cost in response to regulatory external shocks (Hill, 2000). Recent contingency-based research on MACS shows that funding uncertainty derived from the global financial crisis is positively associated with a more intensive use of CS for managerial decision-making purposes (Schoute & Budding, 2017b).
It is in this context where advanced CS may demonstrate their usefulness because potentially RHS can identify less efficient hospitals and thus make decisions about them. It seems that RHS with better CS are able to compare different service providers and to use the information in the negotiation of budgets, thereby gaining more control over the costs of specialized health care (Lehtonen, 2007). In the same sense, Kaplan & Porter (2011) and Eldenburg & Krishnan (2008) show that hospitals with better cost and budgeting information are able to better manage their costs, for example through: process improvements and redesign, outsourcing, consolidation, and reduction of unused capacity of people, equipment and facilities.
On the other hand, our research may support the idea that standardized hospital CS not only serve to comply with legal requirements but also underpin managerial decision-making. While being unsatisfied about the standardized CS and viewing it as non-optimal, hospitals may still consider the system sufficient and therefore use it for their decision-making processes (Cardinaels et al., 2004). In fact, the results of the present research confirm the findings of comparable studies that show that advanced standardized CS contribute to the reduction of unit cost (García-Cornejo & Pérez-Méndez, 2018a; 2018b), which is concordant with an improvement in efficiency.
We also find that the average cost of personnel is directly associated with efficiency. The salary level can be considered a proxy of the level of professional qualification, so that the higher the salary, the higher the productivity and efficiency.
In the Simar-Wilson model, our results also show that there is a significant negative relationship between the endowment of high technology and the efficiency. Prior research is not conclusive in this respect. Although various studies have shown that, in general, new technologies increase hospital costs (Hung & Chang, 2008; Wu et al., 2014) a recent review of the literature shows how certain technologies save costs through increases in productivity, greater efficiency in the processes, reducing administrative costs, or incorporating technological innovations that replace other relatively higher cost procedures (Sorenson et al., 2013).
As expected, the occupancy rate is associated directly with efficiency. This result seems logical, considering that the occupancy rate is an indication of whether or not there is excess capacity, and agrees with previous studies in which a negative relationship exists between the occupancy rate and costs (Puig Junoy, 1988; Lawrence, 1990; García-Cornejo & Pérez-Méndez, 2018a; 2018b).
Regarding quality variables, we find a positive relationship between ambulatory surgery and efficiency and, in the Tobit model, a negative relationship between readmission rate and efficiency. Previous literature shows that there is not always an association between hospital costs and quality indicators and, in those studies which reveal a relationship between both variables the sign is inconsistent (Hussey et al., 2013). In this sense, our results would appear to support the idea that improvements in quality could lower costs via the reduction of hospital readmissions (the readmission of the patient can be considered as an adverse result and, therefore, possibly as an exponent of poor quality) (Hussey et al., 2013). Likewise, ambulatory surgical procedures are an alternative to traditional hospitalization, thereby aiming to reduce costs per process and waiting lists, with increases in efficiency and quality of care in terms of greater patient satisfaction and safety (SECA, 2012).
Finally, in the Tobit model we find a negative association between teaching status and efficiency. Although previous literature is not conclusive in this regard, our results are in line with Sloan et al. (1983), who find higher costs in hospitals with a teaching mission and, correspondingly, lower operating efficiency. The main reason for this cost increase is attributed to the extra number of procedures and consultations performed, reflecting both teaching demands and the intrinsic complexity of case-mix in teaching hospitals.
In accordance with the previous results, the logistic regression that explains the EC component of the MI shows that more advanced CS contribute positively to the improvement of efficiency, while the increase in the occupancy rate positively affects EC, with the effect of the teaching status proving negative on EC.
Our results with respect to the evolution of efficiency are in line with Pérez-Romero et al. (2017), who also find a reduction of technical efficiency of general hospitals in the Spanish NHS from 2010 to 2012. These authors focus on regional variables and reveal a direct relationship between technical efficiency and annual per capita income and spending on fundamental public services, and an indirect relationship with the aging index and annual public health expenditure per capita. Our work complements those results, placing the focus on management variables such as CS and showing that if the CS is less developed it proves more difficult to improve efficiency.
8 Conclusions and further research
This paper analyses whether the level of development of the standardized hospital CS implanted by Spanish RHS has any influence on hospital efficiency.
Using a sample of 159 public-NHS hospitals for 2010–2013, we find a direct relationship between the most developed CS and the improvement of efficiency. Although in the period considered there were significant budgetary restrictions and a consequent reduction in hospital expenditure, other variables appear to influence efficiency resulting in an overall decline in efficiency over the period. Specifically, we find that hospitals with advanced CS reduce their efficiency in a lesser measure. The main argument for this finding is that policy makers and managers focus on cost information from CS to contain cost in response to, for example, a financial crisis and, the better the information provided by the CS, the better they are able to manage their costs. This is in line with the contingency-based literature on MACS, that suggests that when environmental and funding uncertainty increase, organizations use more sophisticated CS and make more intensive use of CS for managerial decision-making purposes. We also find that the improvement of efficiency is directly related with the average cost of personnel, the occupancy rate and the ambulatory surgery rate; and indirectly with the readmission rate, the teaching status and the endowment of high technology.
Our study has important practical implications from the point of view of health policy makers and hospital managers. Installing more developed CS and investing in information technology are measures which require significant financial investment and are technically demanding. Our results suggest that these investments may help hospitals achieve the goal of improving efficiency.
There are certain instruments for policy makers and regulators in order to facilitate the development and use of standardized CS. This is the case of costing guidance for the purpose of provider cost reporting (Chapman et al., 2014). In some countries (e.g., Germany, France, and The Netherlands), hospitals have to demonstrate adherence to such guidance through external audit checks if they wish be part of the sample for calculating DRGs costs. The DRGs data are then reported to the government and regulators, usually on an annual basis. Thus, if hospitals want to influence price setting by contributing their costs per case, they are forced to adhere to defined standards. However, in order that these kinds of measures serve to really improve efficiency, they must be linked to economic incentives, such as budget allocation based on robust databases of cost per patient, or disclosure regulation in the form of state/region-level price transparency websites (Labro & Stice-Lawrence, 2018). Other measures are, for example, to make a small part of the budget dependent on the collection of cost data (Tan et al., 2009).
Although the above measures for Spain are in the hands of RHS, their implementation could improve the cost calculations at a centralized level. The NHS elaborates the weights and costs per DRG from a sample of hospitals. These data allow the establishment of compensation rates between autonomous communities, pricing for third parties or for contracting hospitals. They also serve as standards for cost results in the field of health management. However, it would be necessary to strengthen the data of cost per patient and to expand the sample of participating hospitals so that cost data can be reliably used in a benchmarking process or in hospital funding systems.
This study presents several limitations. On the one hand, it presents the methodological limitations of the DEA model such as its deterministic nature, which has been addressed by applying a bootstrapping model. On the other hand, our analysis refers to a specific period (2010-2013) severely influenced by the economic crisis. The effects of CS must be analyzed in other periods influenced by different socioeconomic factors. Although the data of the hospitals is already available until 2017, we have not included the analysis from 2014 to 2017 because the variable that measures the level of development of the CS refers to 2010 and we understand that past 4 years it is likely to no longer adequately represent the reality of the CS used by hospitals. CS design and intensity of use are not static but related with the environment of the organization (Schoute & Budding, 2017b). Additionally, we have only used public information, which means that we have analyzed hospital data assuming that all of them use a CS with a similar level of development, depending on the RHS to which they belong. In order to strengthen the results obtained the data on the characteristics and use of CS implemented in each hospital should be expanded. It is possible to use a more granular scale to measure the level of CS development, including the level of CS integration and the time elapsed since CS implementation.
Future research could consider the use of surveys to obtain data on CS. The promotion or, in the Spanish case, the revival of a public dataset that delves into the description and use of the CS of the NHS hospitals would obviously improve the measurement of the characteristics of each CS and would allow a systematic evaluation of the effectiveness of all the available alternatives.
Acknowledgements The authors want to thank the two anonymous referees for helpful comments and suggestions, and the Unit of Health Care Information and Statistics (Health Information Institute) of the Ministry of Health, Social Services and Equality of the Government of Spain for the information provided for the study.
Funding
This research did not receive any specific grant from funding agencies in the public, commercial or not-for-profit sectors.
Conflict of interests
The authors declare no conflict of interests.
Appendix
Cost systems in the Spanish hospitals of the National Health System
a Between brackets appear the descriptions of the CS used by each RHS.
b Average cost of all patients discharged in a given DRG (diagnostic-related group) based on the average weights of each DRG.
c Current transfers include: collaboration agreements and, fundamentally, transfers to families and non-profit making institutions (transfers for displacements, orthopaedics, invalid vehicles etc.).
d Cost system developed at national level in the autonomous communities that had not received the health responsibilities before 2002. View the figure on the next page to see the structure for the calculation of costs of the model GECLIF.
Source: Own elaboration based on:
Instituto de Información Sanitaria (2012). Análisis de los sistemas de contabilidad analítica en los hospitales del SNS. Vol. I. Informe. [Publicación en Internet]. Madrid: Ministerio de Sanidad, Servicios Sociales e Igualdad. Available at: https://www.mscbs.gob.es/estadEstudios/estadisticas/docs/Informe_SCA_hospitalarios_en_SNS_WEB.pdf
Subdirección General de Información Sanitaria e Innovación (2013). Guía de recomendaciones para la obtención homogénea de costes de hospitalización en el SNS. [Publicación en Internet]. Madrid: Ministerio de Sanidad, Servicios Sociales e Igualdad. Available at: https://www.mscbs.gob.es/estadEstudios/estadisticas/docs/REC_OBT_HOM_COST_HOSPIT_SNS.pdf
Structure for the calculation of costs of the model GECLIF (base of the CS GESCOT)
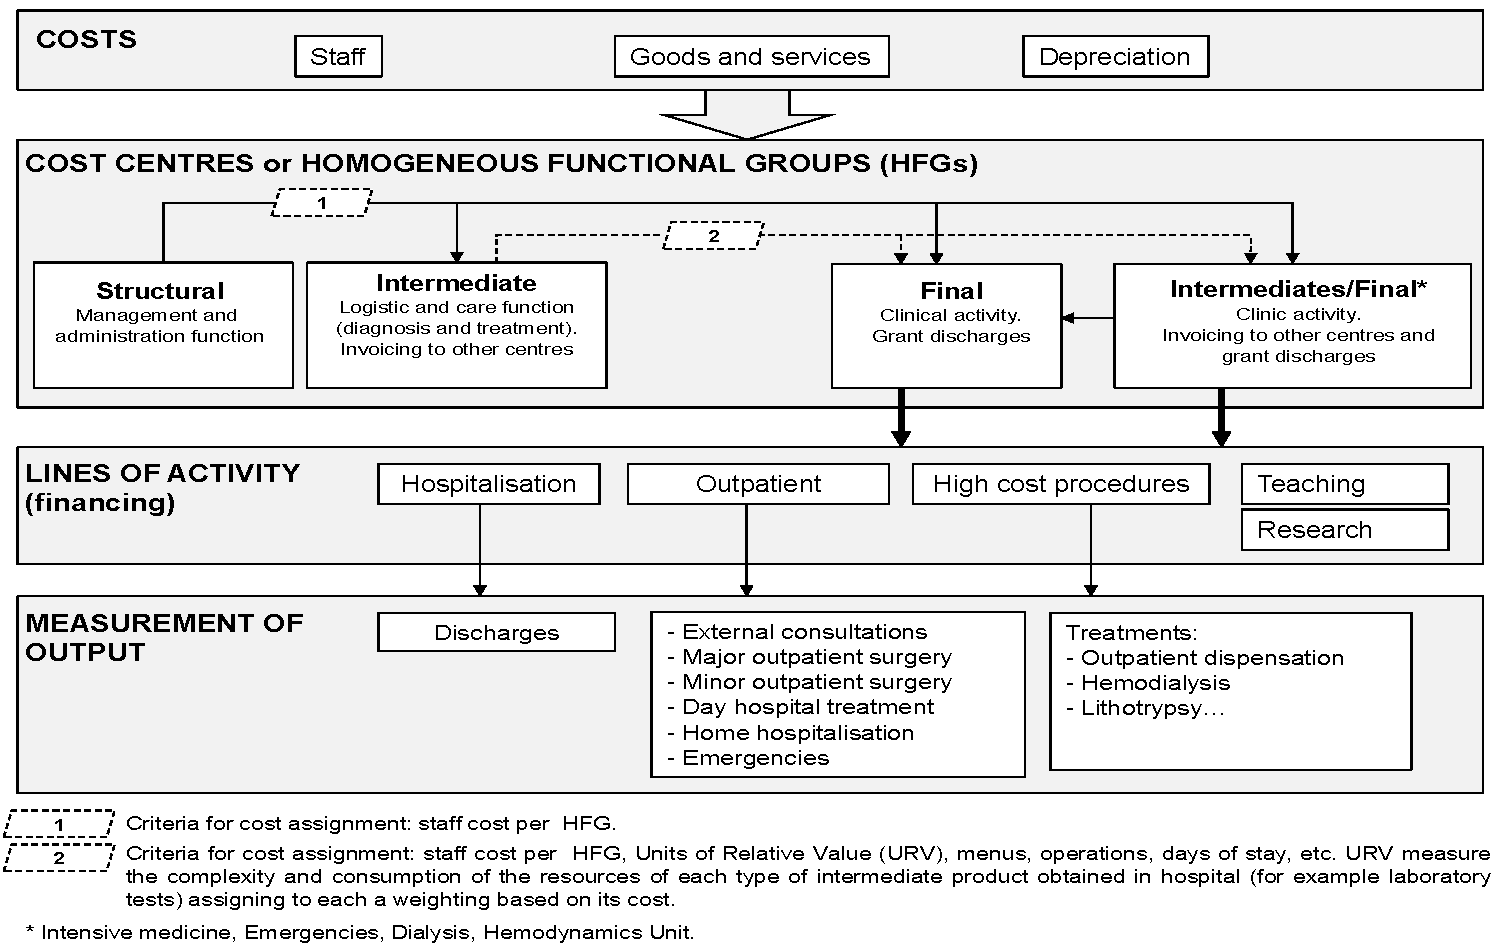
Source: Own elaboration based on Instituto Nacional de la Salud (INSALUD) (2001b). GECLIF. Gestión clínico-financiera y coste por proceso. Madrid: Ministerio de Sanidad y Consumo, Subdirección General de Coordinación Administrativa; 2001. Available at: http://www.ingesa.mscbs.gob.es/bibliotecaPublicaciones/publicaciones/internet/docs/geClif.pdf
Instituto de Información Sanitaria (2012). Análisis de los sistemas de contabilidad analítica en los hospitales del SNS. Vol. I. Informe. [Publicación en Internet]. Madrid: Ministerio de Sanidad, Servicios Sociales e Igualdad. Available at: https://www.mscbs.gob.es/estadEstudios/estadisticas/docs/Informe_SCA_hospitalarios_en_SNS_WEB.pdf
Subdirección General de Información Sanitaria e Innovación (2013). Guía de recomendaciones para la obtención homogénea de costes de hospitalización en el SNS. [Publicación en Internet]. Madrid: Ministerio de Sanidad, Servicios Sociales e Igualdad. Available at: https://www.mscbs.gob.es/estadEstudios/estadisticas/docs/REC_OBT_HOM_COST_HOSPIT_SNS.pdf