Corruption Perception following Privatization Reforms: The Moderating Role of the Quality of Governance
ABSTRACT
This study analyzes perceived corruption following privatization reforms, taking into account the role of governance quality in 22 European countries from 2002 to 2013. Initial analysis did not reveal significant changes in perceived corruption after privatization reforms, but the results are moderated by governance quality. In general, the empirical findings suggest that corruption is lower when the quality of governance increases, and it additionally affects perceived corruption after privatization reforms. Concretely, accountability, government effectiveness, regulatory quality, the rule of law, and control of corruption mechanisms are essential to prevent corruption after privatization.
Keywords: privatization, corruption, good governance, accountability.
JEL classification: H13; H4.
Corrupción percibida tras las reformas de privatización: el papel moderador del buen gobierno
RESUMEN
Este estudio analiza la corrupción percibida tras las reformas de privatización, teniendo en cuenta el papel del buen gobierno, en 22 países europeos entre 2002 y 2013. Un primer análisis inicial no revela cambios relevante en la corrupción percibida después de las reformas de privatización, pero estos resultados son moderados por la calidad del gobierno (governance). En general, los resultados empíricos sugieren que la corrupción es menor cuando el nivel de buen gobierno se incrementa, el cual afecta a la corrupción percibida después de que se llevan a cabo privatizaciones de empresas públicas. Concretamente, la rendición de cuentas, la efectividad del gobierno en la aplicación de políticas públicas, la calidad de la regulación, el Estado de Derecho, y los mecanismos de control de la corrupción son esenciales para su prevención tras las reformas de privatización.
Palabras clave: Privatización; Corrupción; Buen gobierno; Rendición de cuentas.
Códigos JEL: H13; H4.
1 Introduction
Over the past few decades an extensive literature has developed on the causes and consequences of privatization reforms. Collectively, this body of literature tends to emphasize gains in efficiency, effectiveness, and management flexibility (Megginson and Netter, 2001), boosting economic growth (Boubakri, Smaoui, and Zmmiti, 2009a), and reducing public deficits and debt (Bortolotti, Fantani, and Siniscalco, 2003). However, some scholars have concluded that privatization has been carried out more to enhance efficiency than equity, and it has worsened the distribution of wealth and income on average (Birdsall and Nellis, 2003).
Moreover, privatization has also been related to corruption, defined as the abuse of public office for private gain (Zekos, 2004). Unfortunately, state-owned enterprises (SOEs) are usually viewed as susceptible to such abuse. Politicians and civil servants are able to exert influence on SOEs’ corporate decisions with the aim of achieving dishonest private rents or outsiders’ gains in exchange for bribes (Arikan, 2008). Thus, privatization could be viewed as a mechanism for reducing the opportunities to extract rents (Kaufmann and Siegelbaum, 1997).
However, the payment of bribes to obtain favored treatment on concessions, contracts, and privatization deals is more common than desired. Even after privatization, political connections remain. In many cases, privatization reforms do not result in the liberalization of markets and sectors, but rather concentration in large and powerful companies, with strong political connections.
These conflicting results raise questions concerning the role some factors may play in moderating the relationship between privatization and corruption. Contextual factors, such as legal origin (La Porta, Lopéz-de-Silanes, Shleifer, and Vishny, 1999), are critical in public management, and more concretely in privatization decisions (e.g., Bortolotti, Fantini, and Siniscalco, 2001; Bortolotti et al., 2003). This study goes beyond legal origin to consider a broader concept, namely “governance,” which takes into account not only the legal system but also other aspects of economic, political, and administrative authority involved in managing a country’s affairs at all levels (United Nations Development Program [UNDP], 1997). Corruption is often symptomatic of governance problems (Zekos, 2004) and thus privatization reforms will not produce the expected results under poor governance.
Accordingly, the aim of this study is to analyze perceived corruption after privatization reforms, taking into account the role of the quality of governance. For this purpose, privatization is defined as the sale of SOEs by a government. The sample consists of 22 European countries for the period 2002–2013. Initial analysis shows no significant changes in corruption perception after privatization reforms, but the results change when the quality of governance is taken into account. In general, the findings indicate that corruption is lower when the quality of governance increases, and it additionally affects perceived corruption after privatization reforms. Specifically, accountability, government effectiveness, regulatory quality, the rule of law, and control of corruption mechanisms are essential to prevent corruption after privatization.
The paper therefore begins with a literature review on the relation between privatization and corruption before focusing on the concept of governance and proposing a hypothesis. It then describes the sample and variables, including the model that enables empirical testing of the hypothesis. The results show the link between privatization and corruption, taking into account the role of the quality of governance. These results are discussed and the paper then concludes with some implications of the findings, especially for practitioners.
2 Literature Review: Privatization and Corruption
Theoretically, Kaufmann and Siegelbaum (1997) suggested that privatization incorporates different factors that may stimulate or hinder potential corruption, namely, speed, level of administrative discretion, transparency, and independence of administration. When privatization is undertaken quickly, there is less time to arrange corruption transactions; when the process of granting the official signature to pass privatization is subjective, it is easier for discretionary payments to occur. Also, payments are facilitated by secrecy, so public scrutiny is essential to avoid corruption, and using specialized agencies to implement privatization makes it easier to monitor transactions. Thus, privatization may reduce the opportunities for public officials to extract rents under specific conditions.
Empirically, Koyuncu, Ozturkler, and Yilmaz (2010) identified a negative association between privatization and corruption using a sample of 27 transition economies over the period 1995−2008, and concluded that privatization reduces corruption in transition economies. Similarly, Clarke and Xu (2004) found that bribes are lower in countries where telecommunications and electricity distribution utilities have been privatized, employing a sample of (21) transition economies from Eastern Europe and Asia for the year 1999.
Boubakri, Cosset, and Smaoui (2009b) used a larger sample, comprising both developing and developed countries, analyzed over the period 1984−2001. Their findings suggest that the progress and volume of privatization reduce the risk of corruption in developed countries. However, the evidence is not so clear in the case of developing countries, in which public-share privatization also reduces the risk of corruption, but large-scale privatization increases the risk. Thus, the negative link between privatization and corruption could be questioned. In addition, building a simple positive theory of privatization, Laffont and Meleu (1999) suggested a relation between privatization and corruption that has an inverted U-shape, supporting the model with data from sub-Saharan Africa.
There is also literature suggesting that corruption increases with privatization reforms. First, the process of privatization is itself susceptible to corruption, as Shleifer (1999) indicates. According to public choice theory, the political system is a market in which agents interact to attain their own aims (Downs, 1957). Politicians especially are seen as opportunistic agents who act seeking to gain power and thus implement policies addressing this goal. Accordingly, they may award contracts or sell SOEs to inefficient providers in exchange for campaign contributions or bribes (Shleifer, 1999).
Bjorvvatn and Soreide (2005) suggest that privatization in countries with highly corrupt governments will lead to high market concentration, which translates into more corruption. In many cases, privatization does not result in the liberalization of markets, but rather the concentration of markets in large companies, which not only have high market share, but also maintain high access to and control over these markets. The effects of this progressive concentration and the lessening of competition in bidding may come to outweigh the gains from privatization (Bel and Costas 2006), leading only to increased bribery and corruption.
Grounded in empirical research, Arikan (2008) argues that the process of privatization is notorious for causing corruption. Using data on privatizations in the 1990s, and controlling for endogeneity problems, Arikan’s results suggest that higher privatization leads to an increase in perceived corruption.
Thus, it is not clear whether the level of corruption increases or decreases with privatization. This study aims to contribute to clarifying this effect, explaining the heterogeneity of results through some contextual factors that may moderate the relation. Concretely, it focuses on the role of the quality of governance, following suggestion made by Hodge (2002), who noted that privatization without good governance leads to a corrupt state.
3 The Role of the Quality of Governance in Privatization Decisions
Definition of Governance
Governance is a broad concept that inspires strong beliefs and is difficult to measure (Isham, Kaufman, and Pritchett, 1997), and accordingly there is no unique definition. Initially, definitions of governance were focused on the manner in which power is exercised in the management of a country’s economic and social resources for development (World Bank, 1992); that is, the essence of this concept was the governing mechanisms that do not rest on recourse to the authority and sanctions of government (Stoker, 1998).
However, governance involves more than the government. From a socio-political perspective, it involves different arrangements in which public and private agents participate with the aim of solving societal problems, creating new opportunities, and attending to institutions with governing activities (Kooiman, 1999). It refers to the formation and stewardship of the formal and informal rules that regulate the arena in which the state and economic and societal actors interact to make decisions (Hyden, Court, and Mease, 2004).
Despite the heterogeneity of definitions, in general there is consensus that governance captures the way in which authority is exercised, beyond the government, including relations between the state, civil society, and the private sector (Al-Marhubi, 2004). Broadly, definitions of good governance advocate openness, citizens’ participation, accountability, coherence in public policies, civic peace, interest representation, conflict resolution mechanisms, and so on, as essential characteristics of governmental, non-governmental, and corporate sector institutions (Batterbury and Fernando, 2006).
This study adopts the definition of Kaufmann, Kraay, and Mastruzzi (2011), who consider governance as the traditions and institutions by which authority in a country is exercised, including: (i) the process by which governments are selected, monitored, and replaced; (ii) the capacity of the government to undertake effective formulation and implementation of sound policies; (iii) the respect of citizens and the state for the institutions that govern economic and social interactions among them. Kaufmann et al. (2011) use six indicators to represent these three areas:
(i) Voice and accountability (VA) measures perceptions of the extent to which citizens participate in the selection of their government, freedom of expression and association, and the existence of a free media.
(ii) Political stability and the absence of violence (PS) captures the likelihood of political instability and violence (including terrorism); for example, it refers to armed conflicts, social unrest, the intensity of ethnic, religious or regional conflicts, government stability, and so on.
(iii) Government effectiveness (GE) measures the perception of the quality of public services and policy formulation, and the implementation and credibility of the government’s commitment to such policies; for example, government effectiveness refers to the quality of bureaucracy, satisfaction with public transportation, roads, or the education system, coverage of basic health services, the power supply (electricity grid), drinking water, sanitation, waste disposal, and so on.
(iv) Regulatory quality (RQ) refers to the perceptions of the ability of the government to formulate and implement policies and regulations that permit and promote private sector development (e.g., price controls, [lack of] discriminatory tariffs and taxes, fairness of competitive practices, burden of government regulations, intensity of local competition, ease of starting new businesses, anti-trust policy, investment, financial freedom, and so on).
(v) Rule of law (RL) captures perceptions of confidence in and adherence to the rules of society, particularly the quality of contract enforcement, property rights, the police, and the courts, as well as the likelihood of crime and violence. For instance, it measures the cost of organized crime, the reliability of police services, judicial independence, the efficiency of the legal framework for challenging regulations, the extent of property rights, the existence of violent crime, the enforceability of contracts, the speediness of the judicial process, and so on.
(vi) Control of corruption (CC) captures perceptions of the extent to which public power is used for private benefits; for example, it refers to public trust in politicians, diversion of public funds, irregular payments, unofficial payments to public officials, extra payments in connection with taxes, customs, the judiciary, anti-corruption policy, and the prosecution of abuse of office.
The two first indicators (VA and PS) refer to the process by which governments are selected, monitored, and replaced; GE and RQ refer to the capacity of the government to formulate and implement policies effectively; the last two (RL and CC) refer to respect of citizens and the state for the institutions that govern economic and social interactions among them (Kaufmann et al., 2011).
The Moderating Role of the Quality of Governance: Research Hypothesis
Traditionally, SOEs have been viewed as inefficient and susceptible to the abuse of public office for private aims (World Bank, 1997), obtaining dishonest self-gain or outsider gain in exchange for bribes (Arikan, 2008), and with low levels of information disclosures (Royo, Yetano, and García-Lacalle, 2019). Privatization reforms have often been introduced with the aim of improving economic efficiency by reducing the role of the state and increasing the degree of private sector competition (Bjorvatn and Soreide, 2005). Thus, privatization is usually seen as a way of reducing the opportunistic behaviors of public officials (Kaufmann and Siegelbaum, 1997), which lead to corruption cases.
This was the conservative view introduced by the Reagan and Thatcher administrations from the early 1990s, namely that the private sector would probably do better anything that the public sector (government) could do. However, this conservative perspective does not have conclusive support in terms of evidence. In many cases, privatization reforms have not led to the liberalization of markets, but rather concentration in large and powerful companies that are connected with public office (Arikan, 2008). The effects of this progressive concentration and the decrease in bidding competition may come to outweigh the gains from privatization (Bel and Costas, 2006), as they lead only to increased bribery and corruption.
The reality seems to be that companies sometimes pay bribes to obtain favored treatment in contracts, concessions, and privatization deals in general (Zekos, 2004). Thus, it does not remove corruption, but it changes the “focus” of the opportunistic behaviors; i.e., privatization may reduce petty corruption (i.e., bribe payments to utility employees by service-using firms), but it increases grand corruption, such as bribe payments to government officials and bureaucrats by utility managers (Clarke and Xu, 2004), and also includes lack of transparency (Manzetti, 1999).
Starting from this position, good governance is essential to shape the degree of corruption. Hodge (2002) states that privatization without good governance leads to a corrupt state. In countries where the market system is not deeply rooted, the system of law is not enforced and state intervention is invasive; bribes and payoff are used by companies to achieve their goals (Zekos, 2004). The general principles of governance (transparency, accountability, fairness, citizens’ participation, and the effective rule of law) play a significant role in the fight against corruption.
Regarding the definition on which this study relies, control of corruption is one of the six indicators of the quality of governance. Clearly it is expected that this will affect corruption after privatization reforms, but the other five indicators may also affect the relation between privatization and corruption. Indeed, Langbein and Knack (2010) and Andrews (2008) note that the six indicators appear to say similar things in different words, and they are causally related, especially in terms of corruption.
Firstly, “voice and accountability” refers to transparency, and freedom of expression and participation in government, so it is conceptually related to hidden transactions, such as those involved in some contracts, concessions, and privatization deals (Zekos, 2004). Also, the “political stability” indicator is crucial in terms of fighting corruption; when transitions in government are decided based on long-lived rules, they are more likely to have a longer time horizon, so it is probable that public policies and investments will seek growth and welfare instead of corrupt transfers (Langbein and Knack, 2010). The third feature in the governance definition is “government effectiveness,” this being the extent of effective use of public resources for public aims, not for private interests. “Regulatory quality” and the “rule of law” function as incentive mechanisms to promote ethical behaviors and control corruption (Zekos, 2004).
Thus, it is to be expected that corruption will be reduced after privatization reforms when the quality of the governance is high; in contrast, corruption will persist (or may even increase in some cases) after such reforms when governance is not sufficiently strong. Accordingly, the following hypothesis is proposed:
Hypothesis: The effect of privatization on perceived corruption is moderated by the quality of governance.
4 Methodology
Sample
To test the proposed hypothesis, we use a sample consisting of 22 European countries for the period 2002–2013, leading to a panel dataset with 264 observations. The countries included in the sample are Austria, Belgium, the Czech Republic, Denmark, Estonia, Finland, France, Germany, Greece, Hungary, Ireland, Italy, Latvia, Lithuania, the Netherlands, Poland, Portugal, the Slovak Republic, Slovenia, Spain, Sweden, and the United Kingdom (UK).
Information on privatization processes was obtained from the Privatization Barometer, a project launched by Fondazione Eni Enrico Mattei (FEEM), a non-profit and non-partisan institution for the study of governance, powered by KPMG Advisory. This is the official provider of privatization data to the Organization for Economic Cooperation and Development (OECD) and the World Bank. The corruption level was obtained from Transparency International, which is a politically non-partisan organization, founded in 1993 to fight corruption and stop the abuse of power, bribery, and secret deals. The quality of governance was obtained from the Worldwide Governance Indicators (WGI) project, which reports governance indicators for over 200 countries over the period 1996−2015 covering six dimensions, namely voice and accountability, political stability, government effectiveness, regulatory quality, rule of law, and control of corruption.
Finally, other socio-economic and political data were obtained from the OECD and the World Bank databases. Concretely, these data refer to control variables, namely political ideology, electoral processes, education level, economic development, and openness of the economy. These variables are described in the following section.
Variables
To test the hypothesis, the three main concepts are perceived corruption, privatization transactions, and the quality of governance. The former is the dependent variable (called Proceeds) in our model of analysis, and it is represented by the sum of privatization proceeds (US$ million) as a proportion of gross domestic product (GDP) (Bortolotti et al., 2001; 2003; Zohlnhöfer, Obinger, and Wolf, 2008). This proxy refers to revenues obtained from privatization, which is useful in providing a measure of the willingness of governments to privatize and the economic impact of such privatizations (Bortolotti et al., 2003).
Corruption is represented by the Corruption Perceptions Index (CPI), published by Transparency International, which refers to the perceptions of business people and experts on the level of corruption in the public sector. This index is obtained using more than 10 different data sources from different institutions and represents perceptions of corruption. These sources are standardized, taking values between 0 and 100, with 0 indicating the worst behavior (highest level of perceived corruption) and 100 indicating the best behavior (lowest level of perceived corruption). For each country, a minimum of three data sources, obtained after the standardization process, are required to obtain a value on the CPI.
The quality of governance is represented by the WGIs. These consist of six composite indicators covering broad dimensions of the quality of governance, with data obtained from 31 different data sources to capture governance perceptions among survey respondents, non-governmental organizations, commercial business information providers, and public sector organizations all around the world (Kaufmann et al., 2011). Data on perceptions of governance are grouped into six clusters that represent “the traditions and institutions by which authority in a country is exercised” (Kaufmann et al., 2011), namely: (i) voice and accountability (VA); (ii) political stability and absence of violence (PS); (iii) government effectiveness (GE); (iv) regulatory quality (RQ); (v) rule of law (RL); (vi) control of corruption (CC).
The WGIs combine the views from surveys of different enterprises, citizens, and experts, on the basis of more than 30 data sources (survey institutes, international organizations, non-governmental organizations, enterprises, and so on). First, they rescale the individual source data (0–1), and then construct a weighted average of the individual indicators for each source by using the unobserved components model; the final values run from approximately -2.5 (the worst quality of governance) to 2.5 (the best quality of governance).
Finally, with the aim of avoiding biased results, the study takes into account some control variables selected from the previous literature on corruption (e.g., Arikan, 2008; Boubakri et al., 2009b; Koyuncu et al., 2010): Growth is the GDP (market prices) growth rate; education refers to the percentage of the population comprising secondary students enrolled in general education programs; openness refers to the openness of the economy, and is measured as the aggregate of imports and exports of goods and services (% of GDP); right is a dummy variable that takes the value 1 for countries governed by parties that are defined as conservative, Christian democratic, or right-wing, and 0 otherwise.
Models of Analysis
Taking the variables described above, the hypothesis is empirically tested using the following models:
CPIit = β0 + β1Proceedsit + β2Growthit + β3Educationit + β4Opennessit + β5Rightit + ηi + νit (1)
CPIit = β0 + αjWGIjit + β1Growthit + β2Educationit + β3Opennessit + β4Rightit + ηi + νit (2)
CPIit = β0 + αjWGIjit + γjWGIj * Proceedsit + β1Growthit + β2Educationit + β3Opennessit + β4Rightit + ηi + νit (3)
where the sub-indices i and t refer to the country and year, respectively, and the variables are as previously defined; WGIj represents each of the j indicators that represent the quality of governance, with j = 1, …, 6, referring to VA, PS, GE, RQ, RL, and CC, respectively.
The error term is broken down into two elements: ηi refers to unobservable heterogeneity and μit is the classic disturbance term. The former refers to the particular characteristics of each country included in the sample, which differ among countries but are invariant over time. These characteristics are difficult to measure because they are unobservable to researchers; however, failing to take them into account could bias the results.
Initially, a fixed- or random-effects estimator could be used to estimate the models; however, the errors must be conditionally homoskedastic and not serially correlated. Thus, we first test whether our model presents heteroskedasticity and serial correlation problems using the Breusch–Pagan test and the Wooldridge test, respectively. The p-values obtained for each test are lower than 0.05, which means that the null hypothesis of the presence of homoskedastic errors must be rejected and that there are no serially correlated errors at the 95% confidence level.
In addition, an endogeneity problem also arises in the models due to the causality between corruption and privatization (Arikan, 2008; Koyuncu et al., 2010). Instrumental variables (IVs) might resolve that problem; however, the conventional IV estimator, although consistent, is inefficient in the presence of heteroskedasticity (Baum, Schaffer and Stillman, 2003). In this situation, the dynamic panel estimator proposed by Arellano and Bond (1991), which is based on the generalized method of moments (GMM) introduced by Hansen (1982), overcomes such limitation. Here, the two-step system estimator of Arellano and Bover (1995), which was implemented in Stata by Roodman (2009), is used. The system estimator augments the initial difference GMM estimator (Arellano and Bond, 1991), making the additional assumption that the first differences of IV are not correlated with the fixed effects, which improves efficiency.
The GMM estimators use the lagged values of the right-hand side variables included in the model as instruments. The instruments are lagged values of endogenous and predetermined variables. They are not correlated with the error term when deriving the estimator, as Arellano and Bond (1991) demonstrated. The number of instruments should not be very large in relation to the number of observations because the results could be biased; however, the higher the number of instruments the higher the level of efficiency. The most adequate instruments are the closest lags, as the furthest cannot contain information on the current value of the variables. The closest lags in the system GMM estimator are t-1 and t for the endogenous and pre-determined variables (Pindado and Requejo, 2015).
5 Results
Descriptive Analysis
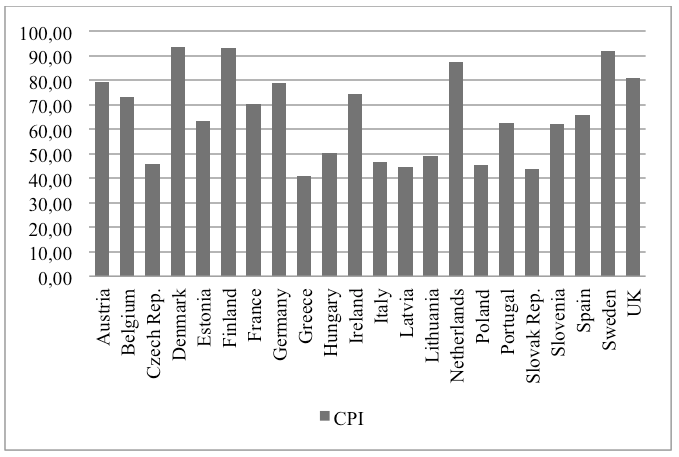
First, some descriptive analyses are presented to provide information on the variables entered into the models. Table 1 shows the main statistics, such as the mean, standard deviation, minimum and maximum values. The mean value of CPI is 65.64, ranging from 0 to 100, and this value is more or less stable along the period of analysis, as illustrated in Figure 1; there is only a slight decrease from 2007, which suggests an increase in the corruption level perceived by citizens coinciding with the crisis period. However, there are significant differences between the sample countries: The minimum is 34 for Greece in 2011 and Poland in 2005, and the maximum is 97 for Finland from 2002 to 2005. Moreover, Figure 2 shows the mean value by country, illustrating that Greece has the worst values throughout the period (2002−2013); Finland and Denmark are in the best position with values of around 95 over the period.
Table 1. Descriptive statistics
| Variable | Obs | Mean | Std. Dev. | Min | Max |
|---|---|---|---|---|---|
| CPI | 264 | 65.64 | 17.97 | 34 | 97 |
| Proceeds | 264 | 0.0812 | 0.1504 | 0 | 1.0851 |
| VA | 264 | 1.2003 | 0.2751 | 0.6538 | 1.8264 |
| PS | 264 | 0.7995 | 0.3918 | -0.4656 | 1.6649 |
| GE | 264 | 1.2635 | 0.5517 | 0.2136 | 2.3566 |
| RQ | 264 | 1.2837 | 0.3578 | 0.4900 | 1.9209 |
| RL | 264 | 1.2068 | 0.5202 | 0.2392 | 1.9996 |
| CC | 264 | 1.1379 | 0.7943 | -0.2546 | 2.5527 |
| Growth | 264 | 0.2935 | 2.1889 | -0.9854 | 28.6121 |
| Education | 260 | 6.4010 | 1.5687 | 4.1177 | 12.0337 |
| Openness | 264 | 49.9639 | 18.5002 | 22.9079 | 89.6232 |
| Right | 264 | 0.3106 | 0.4636 | 0 | 1 |
Figure 1. Evolution of Corruption Perception
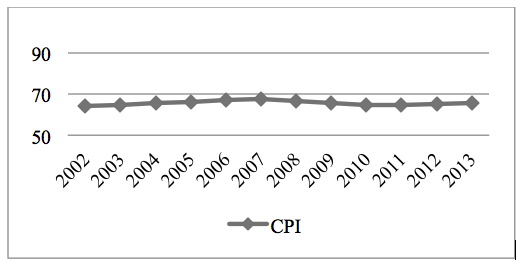
Figure 2. Corruption Perception by Country
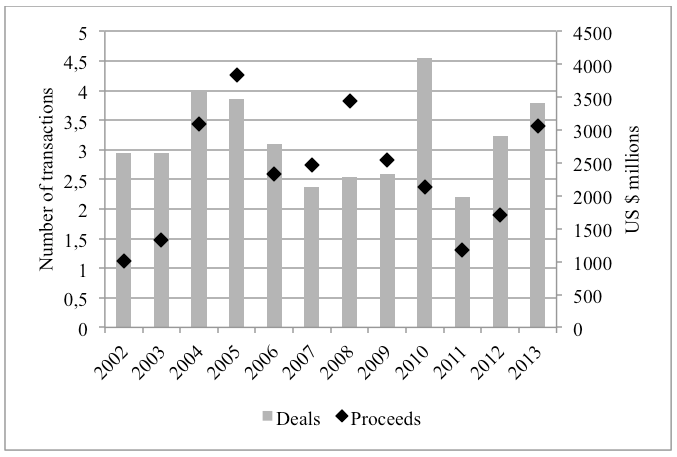
There are also differences regarding privatization reforms. The “proceeds” variable is measured by the ratio of revenues obtained from privatization transactions (US$ million) to GDP per capita. The mean value is 0.0812, but it reaches 1.08 in the case of France in 2005, where privatization reforms accounted for US$37,847.64 million due to the sold part of the capital of Societé des Autoroutes du Nord et de l'Est de la France (SANEF), Snecma, France Telecom, Gaz de France (GdF), and Electricité de France (EdF). Clearly there are also some observations in the sample with the value 0 in the case of countries where there are no transactions in some years. Indeed, there is no clear trend, either in monetary terms or in the number of transactions, as can be seen from Figure 3: 2010 was the year in which more transactions were carried out, although these were not very significant in monetary terms in comparison to 2005, when privatization reforms accounted for more than US$3.5 billion.
Figure 3. Evolution of Privatization Reforms
It is important to take into account that privatization reforms are represented by revenues with the aim of measuring the economic relevance of such reforms. Although the number of transactions could be large, these transactions could be less relevant in monetary terms. For example, Figure 4 shows that Poland has a high number of transactions (15 on average), but these are not so relevant in monetary terms, reaching US$2,720.36 million. In contrast, although France has a lower number of transactions than Poland (7 in the period 2002−2013), it is the country with the most significant privatization reforms in monetary terms, reaching US$13,593.12 million.
Figure 4. Privatization Reforms by Country
Table 2. Bivariate Correlations
| 1 | 2 | 3 | 4 | 5 | 6 | 7 | 8 | 9 | 10 | 11 | 12 | |
|---|---|---|---|---|---|---|---|---|---|---|---|---|
| 1 | |||||||||||
| -0.0983 | 1 | ||||||||||
| 0.9152*** | -0.0396 | 1 | |||||||||
| 0.4357*** | -0.2053*** | 0.4693*** | 1 | ||||||||
| 0.9356*** | -0.0877 | 0.9071*** | 0.471*** | 1 | |||||||
| 0.8572*** | -0.1381* | 0.8436*** | 0.4382*** | 0.855*** | 1 | ||||||
| 0.9461*** | -0.0862 | 0.9073*** | 0.4386*** | 0.9383*** | 0.8804*** | 1 | |||||
| 0.9751*** | -0.0841 | 0.935*** | 0.4438*** | 0.9495*** | 0.8671*** | 0.9597*** | 1 | ||||
| -0.0296 | -0.0546 | -0.058 | 0.0381 | -0.0368 | -0.0811 | -0.0296 | -0.0445 | 1 | |||
| -0.2124*** | 0.0186 | -0.2694*** | -0.0458 | -0.1859** | -0.0314 | -0.2088*** | -0.205*** | 0.0016 | 1 | ||
| -0.1638** | -0.3319*** | -0.199** | 0.3043*** | -0.1402* | -0.0261 | -0.1607** | -0.2051*** | 0.1464* | 0.074 | 1 | |
| -0.1023† | -0.0492 | -0.0427 | -0.1214* | -0.095 | -0.1221* | -0.0681 | -0.0587 | -0.0654 | -0.0052 | -0.1657** | 1 |
Notes:
CPI denotes the corruption perception index; proceeds represents revenues obtained from privatization transactions; VA refers to the “voice and accountability” indicator from the WGI research dataset; PS refers to the “political stability and absence of violence” indicator from the WGI research dataset; GE refers to the “government effectiveness” indicator from the WGI research dataset; RQ refers to the “regulatory quality” indicator from the WGI research dataset; RL refers to the “rule of law” indicator from the WGI research dataset; CC refers to the “control of corruption” indicator from the WGI research dataset; growth represents the GDP annual growth rate; education is measured by the secondary enrolment rate; openness is measured by current imports as a percentage of GDP; and “right” is a dummy variable that takes the value 1 for right-wing governments and 0 otherwise.
***, **, *, and † represent statistical significance at 99.9%, 99%, 95%, and 90%, respectively.
Regarding the WGIs, the best mean values are for RQ (1.28) and GE (1.26), ranging from -2.5 to 2.5. What is more, the maximum for GE is 2.35, achieved by Denmark in 2007. This indicates that a high perception of government effectiveness among Danish citizens, thanks to good quality of services, strong credibility in terms of public policies, good quality policy formulation and implementation, and so on. In contrast, Italy shows the worst values for perceived government effectiveness. However, GE is not the indicator with the worst mean value; PS in Spain shows the minimum values, especially between 2007 and 2010, indicating high political instability; also Greece in the period 2009 to 2013 shows negative mean values for PS.
Finally, the descriptive statistics for the control variables are also shown. The annual growth rate is 0.29% on average, although it reaches 28% in Slovenia and Lithuania in 2013. The percentage of the population comprising secondary students enrolled in general education programs is 6.4 on average, falling to 4.11% in Slovenia in 2012, and reaching 12% in Lithuania over the period of analysis. Regarding the variable “openness,” the mean value suggests that imports account for about 50% GDP, although there are significant differences between countries; in Italy, imports are 22−23% of GDP, while Irish and Slovak imports account for 88−89% of GDP. Finally, the dummy variable “right” has a mean value of 0.31, indicating that 31% observations are governed by conservative parties.
Table 2 shows bivariate correlations among all the variables entered into the models. The highest values are showed for correlations between WGIs, but this does not generate multicollinearity problems as they are individually entered into the models. The rest of the coefficients are not so high, with only “openness” presenting a relative link with “proceeds” and PS; moreover, these coefficients are around 0.3, which is not very problematic in statistical terms. Furthermore, to ensure multicollinearity does not arise in the models, variance inflation factors (VIFs) were calculated for each estimated model, the results1 suggesting that the predictor variables are not highly correlated.
Exploratory Analysis
The results obtained by estimating model (1) are shown in Table 3. The “proceeds” variable positively affects CPI, but it is not statistically significant. Thus, for the European sample between 2002 and 2013, no significant changes in corruption perceptions after privatization reforms are found. Regarding the control variables, all are statistically significant. “Growth” positively affects CPI, so the higher the economic growth rate, the higher the level of CPI (i.e., lower perceived corruption). “Education” and “openness” also positively affect the dependent variable; thus, education seems to reduce corruption and an open economy is less prone to corruption. Finally, the dummy variable “right” shows a negative coefficient, indicating that conservative governments tend to be placed in a lower position in the ranking of Transparency International, so they tend to have a higher level of perceived corruption.
However, as hypothesized, the relationship between corruption and privatization may be affected by some contextual factors, and more specifically by the quality of governance. Thus, first the study tested whether governance indicators affect the level of perceived corruption (model (2)), and then whether such indicators act as moderating factors (model (3)).
Table 3. Effect of Privatization Reforms on Corruption Perception
| Coef. | Std. Err. | |
|---|---|---|
| Proceeds | 0.1937 | 0.2367 |
| Growth | 0.0768** | 0.0263 |
| Education | 0.2428*** | 0.0502 |
| Openness | 0.0372*** | 0.0063 |
| Right | -0.6299*** | 0.1007 |
| Cons. | 10.0040*** | 0.6555 |
| Arellano−Bond test for AR(2) in first differences | Prob > z = 0.222 | |
| Hansen test of overriding restrictions | Prob > chi2 = 0.552 | |
Notes:
Dependent variable: CPI refers to the Corruption Perceptions Index.
Independent variable: “Proceeds” represents revenues obtained from privatization transactions.
Control variables: “growth” represents the GDP annual growth rate; “education” is measured by the secondary enrolment rate; “openness” is measured by current imports as a percentage of GDP; “right” is a dummy variable that takes the value 1 for right-wing governments and 0 otherwise.
***, **, *, and † represent statistical significance at 99.9%, 99%, 95%, and 90%, respectively.
The results from model (2) are shown in Table 4, from which it is apparent that the six WGIs positively affect the dependent variable, suggesting that the higher the level of these indicators, the higher the value of CPI. According to the definition of variables, these results indicate that perceived corruption is lower when the quality of governance increases. It is logical to expect such an effect in the case of CC, but the empirical findings suggest the same relationship in the case of “voice and accountability,” “political stability,” “government effectiveness,” “regulatory quality,” and “the rule of law.”
Table 4. Effect of WGI on Corruption Perception
| Voice and accountability | Political stability and absence of violence | Government effectiveness | ||||
|---|---|---|---|---|---|---|
| Coef. | Std. Err. | Coef. | Std. Err. | Coef. | Std. Err. | |
| VA | 4.0441*** | 0.3024 | ||||
| PS | 2.2950*** | 0.3313 | ||||
| GE | 2.9592*** | 0.2529 | ||||
| Growth | 0.0086 | 0.0180 | -0.0039 | 0.0142 | -0.0019 | 0.0113 |
| Education | 0.2405*** | 0.0550 | 0.2774*** | 0.0382 | 0.1668*** | 0.0363 |
| Openness | 0.0081* | 0.0033 | 0.0369*** | 0.0044 | 0.0014 | 0.0019 |
| Right | -0.2894** | 0.0889 | -0.5596** | 0.1575 | -0.0926 | 0.0658 |
| Cons. | 3.7809*** | 0.4884 | 8.4519*** | 0.2598 | 3.8813*** | 0.5106 |
| Arellano-Bond test for AR(2) in first differences | Prob > z = 0.384 | Prob > z = 0.256 | Prob > z = 0.389 | |||
| Hansen test of overriding restrictions | Prob > chi2 = 0.666 | Prob > chi2 = 1.000 | Prob > chi2 = 1.000 | |||
| Regulatory quality | Rule of law | Control of corruption | ||||
| Coef. | Std. Err. | Coef. | Std. Err. | Coef. | Std. Err. | |
| RQ | 3.5644*** | 0.6140 | ||||
| RL | 3.3456*** | 0.2784 | ||||
| CC | 2.6154*** | 0.2488 | ||||
| Growth | 0.0418† | 0.0238 | 0.0045 | 0.0045 | 0.0154* | 0.0056 |
| Education | 0.2386*** | 0.0325 | 0.0032 | 0.0317 | 0.0868* | 0.0373 |
| Openness | 0.0134** | 0.0040 | -0.0011 | 0.0015 | 0.0062* | 0.0026 |
| Right | -0.1627† | 0.0791 | -0.1765*** | 0.0394 | -0.1530** | 0.0522 |
| Cons. | 4.2191*** | 0.9594 | 2.6355*** | 0.4751 | 3.8801*** | 0.3077 |
| Arellano−Bond test for AR(2) in first differences | Prob > z = 0.586 | Prob > z = 0.219 | Prob > z = 0.244 | |||
| Hansen test of overriding restrictions | Prob > chi2 = 1.000 | Prob > chi2 = 1.000 | Prob > chi2 = 1.000 | |||
Notes:
Dependent variable: CPI refers to the Corruption Perceptions Index.
Independent variables: VA refers to the “voice and accountability” indicator from the WGI research dataset; PS refers to the “political stability and absence of violence” indicator from the WGI research dataset; GE refers to the “government effectiveness” indicator from the WGI research dataset; RQ refers to the “regulatory quality” indicator from the WGI research dataset; RL refers to the “rule of law” indicator from the WGI research dataset; CC refers to the “control of corruption” indicator from the WGI research dataset.
Control variables: “Growth” represents the GDP annual growth rate; “education” is measured by the secondary enrolment rate; “openness” is measured by current imports as a percentage of GDP; “right” is a dummy variable that takes the value 1 for right-wing governments and 0 otherwise.
***, **, *, and † represent statistical significance at 99.9%, 99%, 95%, and 90%, respectively.
Regarding the control variables, in general the results are in line with those obtained for the first modelthat is, perceived corruption is lower in the case of economic growth, a higher level of education, and openness of the economy, and it increases in countries governed by conservative parties.
After testing the effect of WGIs on perceived corruption, Table 5 shows the results for model (3), in which interaction terms between “proceeds” and the six governance indicators are entered. In the first column, it is apparent that “proceeds” negatively affects CPI (coef. = -10.7983, p < 0.001), which suggests that perceived corruption increases after monetarily relevant privatization reforms. Here, there is a statistically significant change in perceived corruption after privatization, but the effect is moderated by the extent to which citizens are able to participate in selecting their government, as well as the extent of freedom of expression and association (that is the “voice and accountability” indicator). As the interaction term is positive in this case (coef. = 7.3778, p < 0.001), this feature of governance cuts off the increase in perceived corruption after privatization reforms. In other words, accountability, as a key aspect of good governance, may prevent corruption after privatization.
Although the second column does not show statistical relevance for perceived political stability, previous results are similar in the case of GE, RQ, and RL, and also partially for CC. More specifically, in the third column “proceeds” exerts a negative impact on CPI (coef. = -3.9748, p < 0.05), but is moderated by the interaction term, which positively affects the dependent variable (coef. = 4.2159, p < 0.01). This finding again suggests that perceived corruption increases after privatization, except in the case of countries with high government effectiveness.
Similarly, regulatory quality is a moderator of the relationship between privatization and corruption, which again is negative in this equation (coef. = -3.2595, p < 0.05); the interaction term positively affects CPI (coef. = 2.7151, p < 0.05), preventing the increase of corruption after monetarily relevant privatization reforms. Also the rule of law is a moderator: The “proceeds” variable shows a negative effect on CPI (coef. = ‑2.3155, p < 0.05), but the interaction term is positive (coef. = 1.7826, p < 0.1), which indicates that confidence in and abiding by the rules of society, contract enforcement, property rights, policy, and the courts may prevent corruption after privatization.
Finally, CC would be expected to show significant results. It can be observed that although the “proceeds” variable has a negative coefficient, it is not statistically significant; however, the interaction term again positively affects CPI (coef. = 0.5136, p < 0.05). This finding is extremely relevant because it means that policies against corruption are a key factor in preventing opportunistic behaviors on the part of public powers for private gain. Indeed, privatization does not exert an effect on corruption when the quality of such policies increases.
Regarding the control variables, the results are similar to those obtained for previous models, suggesting that economic growth, education, and the openness of economy may be useful in reduce perceived corruption, but this increases in countries governed by conservative parties.
Table 5. Moderating Effects of WGI on the Effect of Privatization on Corruption Perception
| Voice and accountability | Political stability and absence of violence | Government effectiveness | ||||
|---|---|---|---|---|---|---|
| Coef. | Std. Err. | Coef. | Std. Err. | Coef. | Std. Err. | |
| Proceeds | -10.7983*** | 2.1021 | -0.3093 | 0.6886 | -3.9748* | 1.4515 |
| WGIj | 3.8081*** | 0.4758 | 1.2406*** | 0.3394 | 2.6289*** | 0.2131 |
| Proceed*WGIj | 7.3778*** | 1.6284 | 1.0187 | 1.2662 | 4.2159** | 1.4264 |
| Growth | 0.0114 | 0.0343 | -0.0097 | 0.0196 | 0.0756* | 0.0322 |
| Education | 0.1562** | 0.0457 | 0.3988*** | 0.0726 | 0.3292*** | 0.0518 |
| Openness | 0.0030 | 0.0031 | 0.0358*** | 0.0076 | 0.0046 | 0.0030 |
| Right | -0.3751** | 0.1066 | -0.5959** | 0.1749 | -0.0292 | 0.0922 |
| Cons. | 3.3904*** | 0.7596 | 10.2992*** | 0.8101 | 5.0854*** | 0.4043 |
| Arellano−Bond test for AR(2) in first differences | Prob > z = 0.411 | Prob > z = 0.158 | Prob > z = 0.099 | |||
| Hansen test of overid. restrictions | Prob > chi2 = 0.757 | Prob > chi2 = 0.998 | Prob > chi2 = 0.793 | |||
| Regulatory quality | Rule of law | Control of corruption | ||||
| Coef. | Std. Err. | Coef. | Std. Err. | Coef. | Std. Err. | |
| Proceed | -3.2595* | 1.5057 | -2.3155* | 0.9143 | -0.2530 | 0.3063 |
| WGIj | 3.1986*** | 0.4173 | 2.6634*** | 0.2563 | 1.8557*** | 0.0794 |
| Proceed*WGIj | 2.7151* | 1.3054 | 1.7826† | 0.9361 | 0.5136* | 0.2294 |
| Growth | 0.0443*** | 0.0101 | 0.0229 | 0.0289 | 0.0255† | 0.0129 |
| Education | 0.4073*** | 0.0482 | 0.0110 | 0.0268 | 0.2240*** | 0.0560 |
| Openness | 0.0253*** | 0.0044 | 0.0130** | 0.0038 | 0.0065* | 0.0026 |
| Right | -0.2688* | 0.1146 | -0.2360*** | 0.0494 | -0.1974** | 0.0582 |
| Cons. | 6.3389*** | 0.9481 | 4.0343*** | 0.4081 | 6.2238*** | 0.4866 |
| Arellano−Bond test for AR(2) in first differences | Prob > z = 0.074 | Prob > z = 0.145 | Prob > z = 0.474 | |||
| Hansen test of overid. restrictions | Prob > chi2 = 0.786 | Prob > chi2 = 0.575 | Prob > chi2 = 0.358 | |||
Notes:
Dependent variable: CPI refers to the Corruption Perceptions Index.
Independent variables: “Proceeds” represents revenues obtained from privatization transactions; WGIj refers to j indicators of the “quality of governance,” namely “voice and accountability,” “political stability and absence of violence,” “government effectiveness,” “regulatory quality,” “rule of law,” and “control of corruption”; Proceed*WGIj is the interaction term between “proceeds” and each of the cited WGI indicators.
Control variables: “Growth” represents the GDP annual growth rate; “education” is measured by the secondary enrolment rate; “openness” is measured by current imports as a percentage of GDP; “right” is a dummy variable that takes the value 1 for right-wing governments and 0 otherwise.
***, **, *, and † represent statistical significance at 99.9%, 99%, 95%, and 90%, respectively.
6 Discussion and Conclusions
Although the association between privatization and corruption is not clear, the findings of this study make a relevant contribution in relation to the previous literature by taking on board the influence of the quality of governance. This study regards good governance as a means of helping countries, on the one hand, to achieve sustainable and self-reliant development and social justice, and on the other hand, operating most effectively and efficiently. For that, we adopt the definition of Kaufmann et al. (2011) and their six indicators to represent good governance as a group of different factors that may influence on the corruption perceived after privatization reforms (Kaufman and Siegelbaum, 1997).
Our findings throw light on the relevance of the context in explaining corruption perception. The empirical evidence indicates that corruption is lower when the quality of the governance is higher, and this also affects perceived corruption after privatization reforms. Specifically, accountability, government effectiveness, regulatory quality, the rule of law, and control of corruption mechanisms are essential to prevent corruption after privatization. This is in line with Hodge (2002), who states that privatization without good governance leads to a corrupt state.
Some analysis shows no statistically significant effects of privatizations on perceived corruption, probably because the final effect is not evident per se. Kaufman and Sielgelbaum (1997) suggest that privatization incorporates some factors (e.g., speed, level of administrative discretion, information transparency level, and independency of administration) that may stimulate or hinder the potential corruption associated with such reforms. Because of this, the literature is heterogeneous in this respect; for instance, while Koyuncu et al. (2010) and Clarke and Xu (2004) conclude that privatization reduces corruption in transition economies, other scholars have questioned the negative link between privatization and corruption (e.g., Boubakri et al., 2009b).
Our findings partially clear such doubts by considering the role of the quality of governance. First, the process of privatization is itself susceptible to corruption as politicians are seen as opportunistic agents, on the basis of the public choice theory (Buchanan, 2009). Trying to maximize their own well-being rather than that of the public (“self-interest axiom”; Boyne, 1997), politicians may award contracts or sell SOEs to inefficient providers in exchange for campaign contributions or bribes (Shleifer, 1999). In order to combat corruption coming from privatization reforms, good governance is essential.
Corruption generates a vicious circle, and an enormous impact on different economic features and social issues. Lack of confidence in government may result in political and economic instability, or in a lack of confidence on the part of foreign investors, which is essential for privatization. This can result in a reputational risk, which has the potential to cause macroeconomic distortions, as well as the misallocation of capital and resources, increasing the risks in the financial sector, and finally hurting the credibility and integrity of the government in general (Campos, Pradhan, and Recanatini, 2007).
In addition, the results of this study encourage the private sector not only to make the best use of good governance practices, but also to be helpful in raising awareness among the public about the importance of strengthening good governance practices. The enforcement of principles of good governance is necessary from both sides to ensure that high-powered politicians and private corporations will be subject to the same standards (Campos et al., 2007). If enforcement is rigorous, it is more likely that perceived corruption will be reduced after significant privatization reforms. This makes it necessary to emphasize tools and strategies that improve the accountability and restore citizens’ trust (Montesinos and Brusca, 2019).
Finally, it would be interesting for future studies to cover other regions, such as Latin America or Asia, to contrast the relevant contributions of this paper regarding the influence of good governance on perceived corruption after privatization reforms. Also, it could be interesting to represent good governance using other indicators, and extending these results to other moderating factors, such as the level of democracy, accounting systems in the public sector, the development of financial systems, and so on. Moreover, the quality of governance may also moderate the effect of privatization in relation to social issues, e.g., welfare, unemployment, or income inequality, among others.
Funding
We are grateful for the financial support received from the University of the Basque Country under Grant Consolidated Research Group EJ/GV: IT 897-16.
Declaration of interest
The author declare no conflict of interest.