A New Cost Management System for Construction Projects to increase Competitiveness and Traceability in a Project Environment
ABSTRACT
This research proposed a new method for project cost management based on Competitiveness and traceability in a case study and operational situation. The research hypothesis is based on the synergistic ability of performance focused activity-based costing in combination of the target costing method for encouraging competitiveness cost control system for project environments. The method was developed to control, direct and overhead costs of the project during its progress. Also, it uses the feature of activity-driven and different resource drivers to determine the types of costs with the effect of time driver for each activity. An interview was conducted with financial managers during two to four times with the aim of validating and modifying the method. According to a semi-structured interview, the proposed method contributed to increase the precision, certainty, traceability of costs and provided the integrity of the accounting, technical and operational system. It also analyzes deviations and reduces costs by considering competitive and strategic conditions. It's also limiting the target cost of work packages and causing an alarm on the completion of each. According to Friedman test, there is a meaningful competitive ability compared to the conventional cost control method in the projects and it is also implemented in a case study.
Keywords:Construction Projects Environment, Project Cost Management, Performance Focused Activity Based Costing, Project Overhead Cost, Competitive Cost.
JEL classification: D24. M11, L74.
Un nuevo sistema de gestión de costes de proyectos de construcción para aumentar la competitividad y la trazabilidad para entornos de proyectos
RESUMEN
El objetivo principal de la investigación es utilizar nuevos métodos de cálculo de costes en los proyectos de construcción para reducir y controlar las desviaciones de costes y algunas limitaciones que presentan los modelos tradicionales. La hipótesis de la investigación se basa en la capacidad sinérgica del cálculo de costes basado en actividades centradas en el rendimiento, en combinación con el método de cálculo de costes objetivo para fomentar la competitividad del sistema de control de costes para entornos de proyectos. El método se elaboró para controlar los gastos directos y generales del proyecto durante su ejecución. Se realizó una entrevista con 26 directores financieros en dos o cuatro ocasiones entre junio de 2016 y mayo de 2017 con el fin de validar y modificar el método. Siguiendo una entrevista semiestructurada, el método propuesto contribuyó a aumentar la precisión, la certidumbre y la rastreabilidad de los costes y proporcionó la integridad del sistema contable, técnico y operacional. Además, se analizan las desviaciones y se reducen los costes al considerar las condiciones competitivas y estratégicas. También se limita el coste objetivo de los paquetes de trabajo y se genera una alerta al finalizar cada uno de ellos. Además, de acuerdo con el test de Friedman, existe una capacidad competitiva significativa en comparación con el método convencional de control de costes en los proyectos y también se aplica en un estudio de caso.
Palabras clave: Entorno de los proyectos de construcción, Gestión de los costes de los proyectos, Cálculo de costes por actividades centrado en el rendimiento, Gastos generales de los proyectos, Costes competitivos.
Códigos JEL: D24. M11, L74.
1 Introduction
Cost management in construction projects is important so that sometimes the success of the project is measured only by the cost criterion (Keisala, 2009). According to a study conducted in Qatar between 2000 and 2013, the cost overrun was about 54% (Senoucia, Ismailb & Eldina, 2016).
One of the growing demands of companies is the recognition of cost and cost drivers and cost-driver behaviors. The indirect or overhead costs of the project are between 8% and 15% of total construction costs, which depends on the complexity of the project, where it can grow at a faster rate than direct costs. Large construction firms had a significant increase over 77% in overhead costs of the project and 9.8% unchanged and only 3.2% down (Jaya, 2013). Typically, the cost of construction projects is controlled by the accounting department, and due to the time interval in the accounting operation, there is a late reaction to circumstances. Also, the control of the Construction performance and cost and accounting have different and separate processes, and there is no integrated approach (Keisala, 2009).
Management accounting with strategic position leads to more accurate cost accounting and increases the organization's performance (Macinati & Pessina, 2014) (Uyar & Kuzey, 2016). Unlike traditional retrospective accounting, management accounting is forward-looking and aimed at predicting the future and it helps managers to make operational and strategic decisions (Bai & Krishnan, 2012). In the traditional system Because of the limited feedback and lack reasonable time to make decisions, management controls are late and limited, and there is no integrity between the financial information and the various information systems of the organization (Castro Silva, Rocha & Oliveira Melo, 2014).
In the traditional approach, the costs with a direct impact on time are ignored, and since time lags have a significant negative impact on costs in construction projects, the separation of cost control and scheduling has made it difficult to control the entire project cost, and time lags can easily lead to cost overrun (Shirowzhan, Shanaki, Sebt & Toosi, 2016). Another issue we face with cost accounting is the lack of correlation between cost and performance systems (Uyar & Kuzey, 2016).
Competition in the construction industry is mainly shown at competitive prices (Tang, Zhang, Tang & Chen, 2015). In cost accounting does not set the target cost for each workpackage. Also, the inability to track total costs and noting the permissible target cost by the system (Uyar & Kuzey, 2016).
The purpose of the research is to provide a cost control system for construction projects based on activity based costing and the target costing in order to increase competitiveness, accuracy, certainty and optimal management of overhead costs, profitability, continuous cost reduction and timely decision making.
2 Literature review
2.1 Problem statement: Cost Management Constraints in Construction Projects
Construction costs include direct and indirect costs. Direct costs include materials, manpower and equipment directly involved in construction and indirect costs are costs that can be set for a specific project, but cannot be determined for a specific part of the project, such as supervision, etc. (Singh & Taam, 2008). According to the PMBOK guide, cost management includes planning, estimating, budgeting, financing, fundraising, managing and controlling costs so that the project can be completed with a budget approved. In fact, cost management is a set of steps that management takes to ensure more satisfaction and continuous control and cost reduction. The emphasis of cost management systems is on company activities (Jaya, 2013).
In the traditional system, there is no causal relationship between costs and activities and components of work, also categories are based on consumed resources rather than user components and activities. Also, overhead costs are fixed at an expense and don’t have a causal relationship with construction activities, and there is little insight into the cost deviations (Reddy, Venter & Olivier, 2012). On the other hand, most executives do not have an understanding of accounting reports because they are highly analytical and not related to services and products (Castro et al., 2014). For four decades, the earned value management has been used to predict and control the cost. Tools and techniques for managing and controlling costs, such as earned value management, describe cost performance based on earned value (EV), planned value (PV), cost performance index (CPI), cost variance (CV) parameters. In this system, work breakdown structure (WBS) is used as a basic step to plan work. Along with the work breakdown structure, it uses organizational breakdown structure (OBS) and then allocates organizational responsibilities to project works.
The Earned Value Management (EVM) system has inherent limitations that the past data are considered to be the best available information and also has many uncertainties at the early stages. Cost control and estimation and budgeting of remaining works are obtained based on past performance indicators, which can result in inaccuracies. Based on the earned values indicators, the cost deviation of each activity and project can be calculated for direct costs, and the management, by examining any activity or accounting reports, can identifies roots and causes of the deviations. However, it takes time to review several reports with different control and accounting frameworks with their relation to physical progress. Regarding the EVM system, indirect costs is relating to routine activities that cannot be specifically identified and interconnected between them and specific activities and projects, and indirect costs must be budgeted and controlled separately at the operational level or organizational management, and costs indirectly managed in overhead caches that are typically based on the organization's accounting process (Alberto & Narbaev, 2013).
2.2 The target costing in construction projects
Target costing is a fundamental and effective tool for managing costs and reducing the cost of products. The target costing method is just the opposite of the traditional costing method and starts with sales prices. This method helps organizations to accurately cost estimate and reduce inadequate risk of profits, and develop better and faster products (Baharudina & Jusohb, 2015). In fact, the main purpose of the target costing is to estimate costs based on the goal pursued by the organization in a competitive environment. Each organization can have its own methods, so the companies express the following basic steps: Establishing the target price based on competition and market needs; Establishing the target profit margin; Determining the cost to be obtained; Calculation of costs according to the process and methods available; Calculation of the target cost (meaning the amount of the cost to be reduced). When the target cost is calculated, companies are following the below steps: Establishing a multidisciplinary and multi-functional team that is in the early stages of design and planning, using tools such as value engineering in design and planning and kaizen costing during the construction to reduce costs (Melo &Granja, 2017). In fact, the main purpose of the target costing is to estimate costs based on the goal pursued by the organization's competitive environment (Sharafoddin, 2016).
2.3 Performance Focused Activity based Costing in construction projects
The basic logic of activity based costing is that the activities consume resources and products consumes the activities, which focuses on managing activities rather than costs (Ayorinde, Osarenren Osasrere & Ademola Adeniran, 2015). The activity-based costing system can also be described as an allocation method of overhead costs by a cost accounting methodology based on the cost driven activity to the activity pool and cost targets. This definition indicates that project overheads can be assigned to project activities based on cost drivers. Activities can be grouped into units, batch, projects, and facility-sustaining overheads (Jaya, Pathirage & Sutrisna, 2010).
Classifying activities can lead to the elimination of activities without value-added. In fact, this method can provide useful information on resource consumption and cost goals for strategic decision making (Damjanovski, 2013). One of the distinction points of activity-based costing and traditional costing is in cost drivers. Due to the activity-driven nature of this method, the costs that are not considered in the traditional method are calculated and also the total cost of the project is logically calculated (Tang et al., 2015). In this system, project overheads can be allocated to project activities based on cost drivers (Jaya et al., 2010). Of course, this method has limitations and shortcomings for use in construction projects. In this way, the activities are divided into four units, batches, projects, and facilities levels that are not commonly used in construction projects because work breakdown structure is more practical and tangible. Therefore, the activity-based costing process in overhead cost management in construction projects is as follows:
- Identify project activities and scheduling theme.
- Identifying project overheads and their cost accounts.
- Classify the overhead cost (unit, batch, project, facility) and create a cause-and-effect relationship with activities.
- Idealizing quantity drivers
- Calculating ideal cost drivers
- Allocation of cost accounts to activities (Cost objects.)
- Determining activity driver rates of project overheads per activity duration (Jaya, 2013).
The proposed method is suitable for overhead costs, but it has a long and complex process for tracking direct costs and does not consider competitive conditions. Based on the problems found in the activity-based costing model, Namazi in 2009 introduced a new generation of activity-based costing that called performance focused activity based Costing (PFABC). This system can be integrated with the organization's resource planning and performance management system. Also, in contrast to the classification of activities into four categories in the traditional ABC model, this method uses two types of flexible and committed costs, which has benefited from a simplified approach in the process of calculating the flexible (variable) costs. This system is used to identify cost deviations such as rate and amount deviation. It is also a powerful technique for determining the productivity of activities or organization as a whole and is used to analyze two components of productivity, including efficiency and effectiveness (Namazi, 2009; Namazi & Shamsedini, 2016).
2.4 Research background
In a study to provide accurate cost information and proportional with cost goals, a method for allocating costs with the help and improvement of the first-generation activity based costing method has been proposed which provides more accurate information than traditional method and the method of first-generation activity based costing has been facilitated and turned into one step (Bent & Kaplan, 2017). In a study that focuses on target costing in the Iranian market, states that target costing is a cost management tool to reduce costs especially in early design and product planning, which is used to determine competitive prices and customer requirements. Also, the use of value engineering and activity based costing is essential for the successful implementation of the target costing (Sharafoddin, 2016). In another research, the target life cycle costing model has been proposed based on ABC model and states that the application of the target costing and ABC methods in the manufacturing industry has brought the strategic benefits of TC and the functional benefits of ABC. In addition, with using techniques of cost-control, reduce costs and quality control, creates synergies in cost management and provides accurate information for proper decision making (Yuksel Pazarceviren & Dede, 2015). However, the results of the research developed a model for process management system in the manufacturing industry and there is no evidence to contribute response differentiation between project management and process management (Toosi, Sebt & Maknoon, 2014). In another study, ABC's application has been used in management efficiency, pricing decisions, improving decision-making processes in relation to maintaining or eliminating activities and adjusting pricing policies to increase product diversity, also Ranked above 80% that is helpful and effective. Also, state that the application of the target costing for pricing decisions, increasing customer satisfaction, and reasonable and quick decision making in manufacturing plants is very appropriate and effective. Also, the skill in managing change to apply new costing methods is vital (Ayorinde et al., 2015). The use of the target costing in the construction industry has also been considered in different countries. In a research to align the target costing in real-estate companies, it has developed a proposal for guidance. In this research, they have developed guidelines that started with the formulation of target costing and competitive price and continued to the level of components and selection of key suppliers. And identifying opportunities and reducing costs based on value engineering (Melo & Granja, 2017). Martha Jaya in 2013 proposed a model for controlling overhead costs with using first-generation activity based costing in construction projects and calculating overhead costs for each activity based on cost drivers, and increasing accuracy and certainty in estimates and cost budgets and costs control (Jaya, 2013). In Zimina, Glenn & Pasquire (2012), a target costing and lean methods has been used to design the target value on 12 construction projects, which aims at construction cost savings in the project's delivery in terms of cost, time and quality. Applying the target value design in these projects has led to significant improvements in projects and reducing the final cost by 15% lower than market cost (Zimina et al., 2012). In another study, target costing has been used to determine the cost of a building before design, and aims to manage the design process to achieve target costs. In this research, building information modeling (BIM) is used to construct all costs and components of a building before designing according to the needs of the employer and states that target costing leads to proposed value and reduces waste (Pennanen, Ballard & Haahtela, 2011). However, there is no specific research around cost control system constraints in project management for the construction industry. So, the paper developed based on two hypothesizes:
H1: There are differentiations between the project cost control system for the construction industry and process cost control system for the manufacturing industry.
H2: There is a synergistic ability to combine performance focused activity based costing and target costing method for encouraging competitiveness cost control system for project environments.
3 Research methodology
The current research has used a developmental method, since in the development research it is intended to innovate in methods, devices, products or to improve them. The research utilizes modern cost accounting techniques for providing cost control systems in construction projects. Survey research is used qualitative, descriptive, and analytical research method since problem characteristics that face constraints around cost control systems. Data collection and analysis have benefited from library methodology, review of articles, books and research in related fields, but provide new evidence based on a semi-structured interview with experts on financial management in construction projects and with full proficiency in the areas of research, validated and received expert opinions and improved the proposed method. The criteria for selecting experts include at least 5 years’ experience in financial management and cost management in famous construction companies, familiarity with the concepts of costing, having high experience or research in the field, the willingness and motivation to interview and study in the field. The selection of individuals was based on non-probability (or judgmental) sampling techniques, purposive, snowballing. In the first interview, they were familiarized with research and domination of people has been evaluated, the subsequent interviews were held two to four times until the best criticisms and suggestions were made and the improvement of the method has continued.
The statistical population includes 296 financial managers of construction companies with the first grade in professional governmental ranking in Tehran. According to the survey of thirty companies by using targeted and snowball methods, the ratio of companies that using the new accounting methods proposed in the research is 0.98% with a confidence coefficient of 90%. The sample size in Cochran method with an error of 0.05 is 26. Sample size consists of 26 financial managers of construction projects that have mastered the new concepts of costing and have research or practical experience in the field. With Considering individuals with this feature were limited, the method of their selection was purposeful and then process interview started by qualified individuals and another one was selected by snowball method. At the first interview, the explanation is provided in connection with the research and the collected data is provided to them to express themselves.
The interview tool selected for the cost control constraints analysis due to the differentiation project nature versus the process nature. The project is unique and has more uncertainties that make a changeable environment for management. So, project management has dynamic nature activity based that progress under changing environment. This naturally requires a restricted tool to reach to project goals.
The appropriate technique for analyzing qualitative data under the textual analysis was widely recognized as the content analysis. As Gilham points out, the process of data analysis involves identifying the key words and codes and categorizing them according to the themes, issues, topics, concepts, and propositions (Gillham, 2000). In this research, the method of content analysis and cognitive mapping has been used to identify the meaning and concept of the text of the interviews and to show the relationship of words with different aspects of research. Finally, finding the research should be validated. Case study selected as a research approach for the results validation, because of the project based nature of the construction industry (Toosi et al., 2014).
Therefore, developing a conceptual process based on semi structured interviews with financial managers in the construction industry and content analysis and cognitive mapping has been used to confront cost management constraints in construction projects is a real added value to the scientific literature by this research. Proposed process as a finding of this research verified in a real construction project. Consequently, case study just selected as a research approach for reviewing implementation steps of the proposed system. The proposed system implements in a building construction project with changeable requirements in its tasks to evaluate the system's ability for increasing competitiveness and traceability in a project environment.
4 Findings and analysis
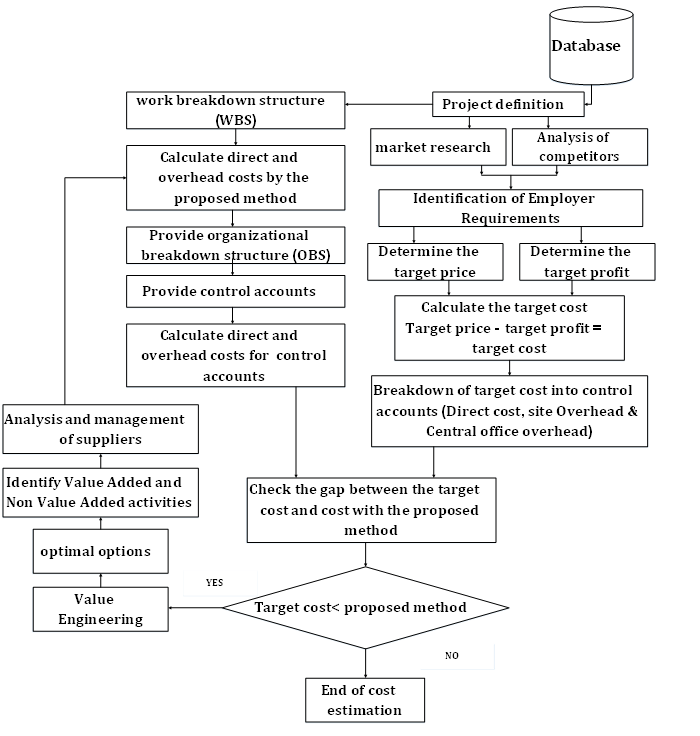
In the proposed method, the benefits of activity based costing and the target costing for estimating, budgeting and controlling costs are used in accordance with the process of cost management in construction projects. Regarding the introduction of the target costing in the literature review, to estimate competitive costs, target costing method has been used initially with a top-down view. And then used the improved method of performance focused activity based costing for cost estimation with a bottom-up view to accurately estimate all direct and indirect activities.
The overall process of the proposed cost control system based on the performance focused activity based costing, and the target costing (TC/PFABC-CCS) in construction projects is described below.
Figure 1. The overall Proposed Process of TC/PFABC-CCS for Construction Costs Control
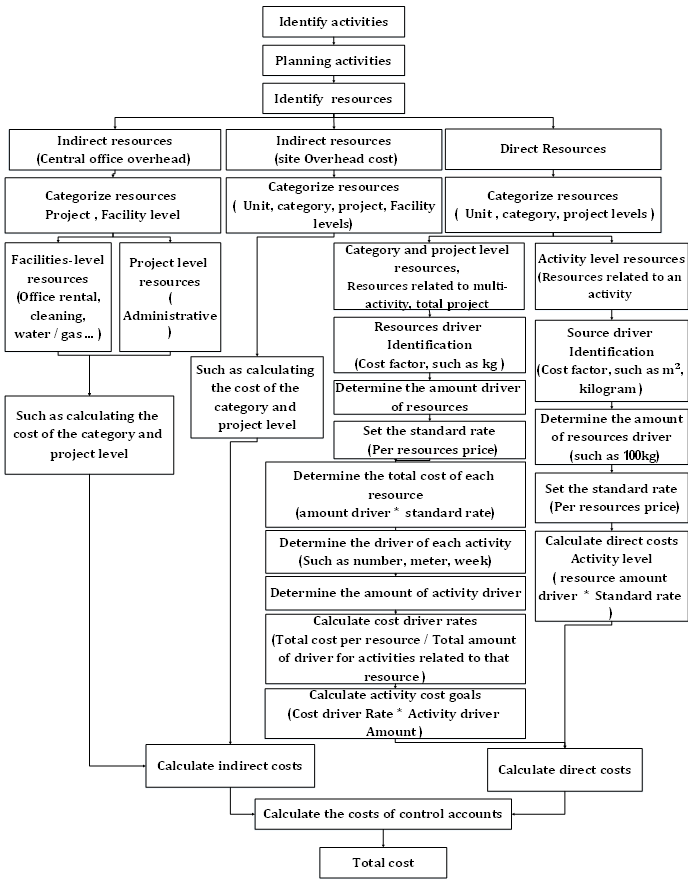
In order to estimate the direct and overhead costs with high precision and capability, with the ability of activity-driven and cost-driven, the activity based costing method and its new generation required. Then according to the literature and the planning process in construction project, we utilize the following process by improve the PFABC method in accordance with the planning stages of construction projects. As a result, by creating a matrix derived from planned activities and classified resources, we can estimate and allocate the cost of direct and overhead resources to activities in accordance with the following steps.
Figure 2. The Proposed Process of TC/PFABC-CCS for Estimating Construction Costs
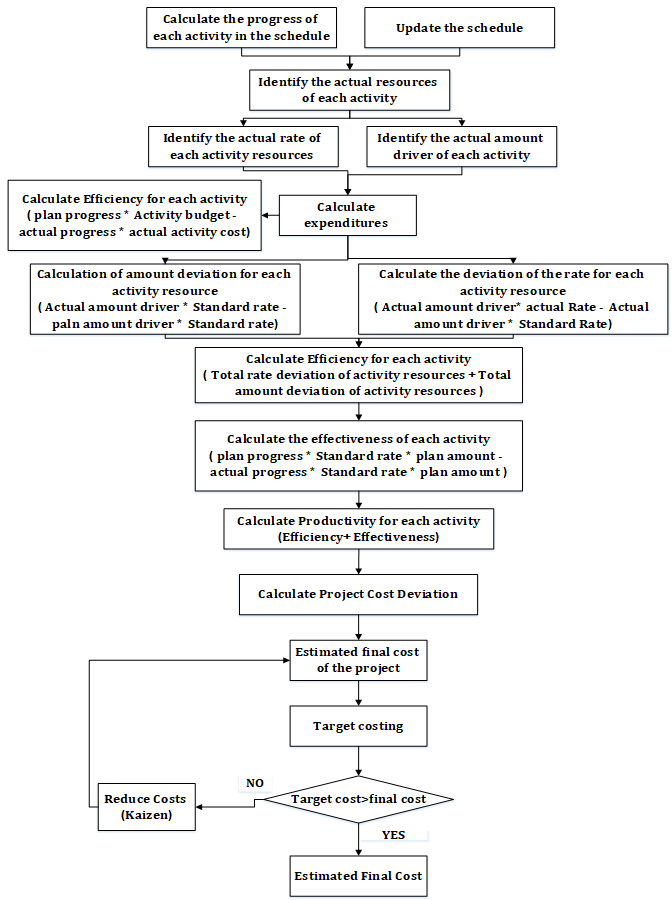
Also, after estimating the costs of the project and verifying it based on the overall process of the proposed method, we will budget the costs. At this stage, with using the scheduled activities and estimated costs, they are budgeted for weekly or monthly periods, and direct and overhead costs can be tracked and controlled separately in each period. During the implementation of the project, progress reports will be prepared in certain periods. By calculating the progress of the activities and the project and calculating the actual resources used, the actual costs of each activity and the cost overrun can be calculated. And we can provide indicators of efficiency, performance and productivity for each activity and the whole project. Finally, by calculating the cost of completing the project and comparing it with the target cost, we can calculate the profit and loss of the project. Also, corrective actions can be taken with the help of value engineering and kaizen techniques.
Figure 3. The Proposed Process of TC/PFABC-CCS for budgeting Construction Costs
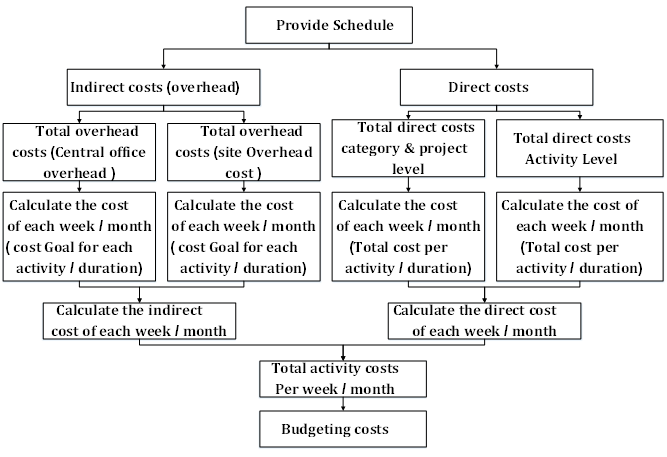
Figure 4. The Proposed Process of TC/PFABC-CCS for Controlling Construction Costs
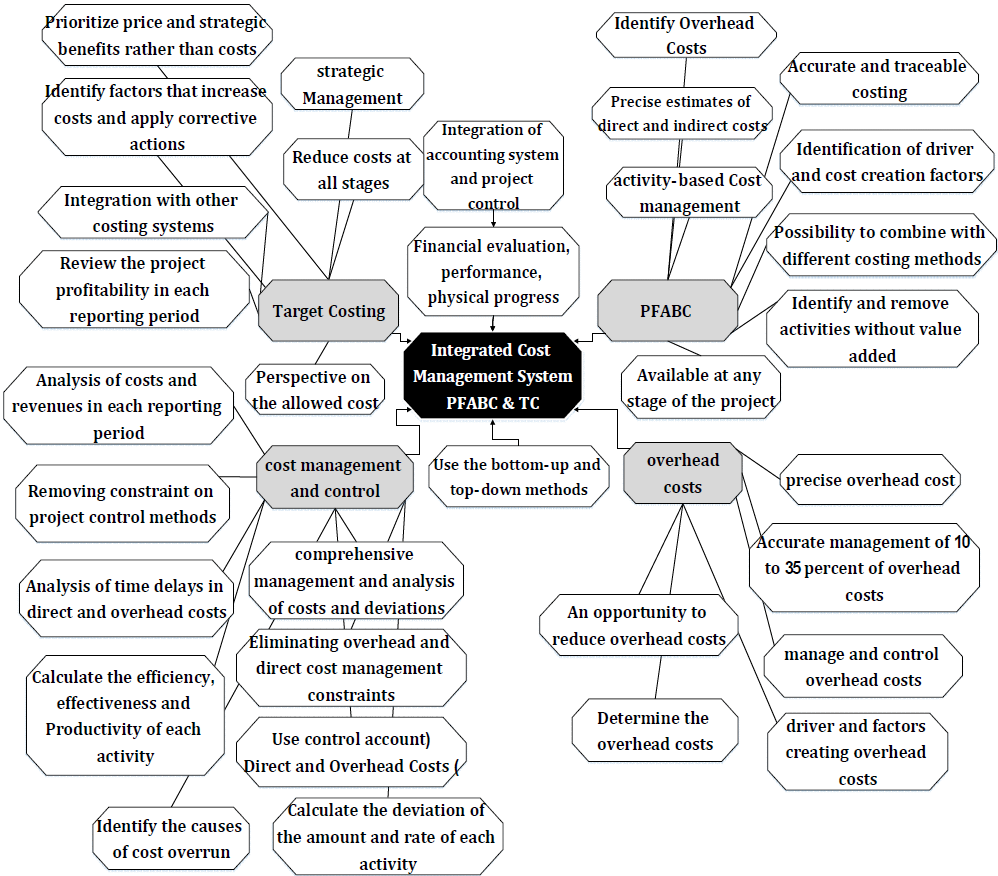
The content analysis process has continued from the beginning of the interviews to access and development of the proposed method. To assess the validity and reliability of the interview questions, Cronbach's alpha has been used, and the Cronbach's alpha coefficient is above 0.7, which expresses its reliability. The interview questions include the main topics from the literature review including the target costing, activity based costing, overhead cost management, cost management and control, which are considered as the main nodes. Based on the questions and keywords related to each category with the open coding method, the concepts and subsets are extracted and the result 34 concepts and codes has been used to validate the advantages of the proposed method. As a result, due to lack of visual aspects of content analysis, the visual feature of cognitive mapping has been used. 34 Concepts and codes resulting from interviews were classified into four categories and classifieds by cognitive mapping method.
Figure 5. A cognitive mapping of expert interviews and the benefits of the proposed cost control system
Also, to evaluate the competitiveness of the proposed method versus to the traditional method, Friedman’s nonparametric test has been used. And competitiveness level of both methods has been extracted from 26 experts based on the ranking of one to 10. According to the Friedman test, the Chi-square statistics is 26 and the degree of freedom 1 and the coverage level of the statistics is equal to 0.05, which means that there is a significant difference between the level of competitive ability of the proposed method and the traditional method.
Table 1. Competitiveness measurement using Friedman's nonparametric test
| N | Mean | Std. Deviation | Minimum | Maximum | |
|---|---|---|---|---|---|
| The proposed method | 26 | 8.19 | 0.895 | 6 | 9 |
| Traditional methods | 26 | 2.88 | 1.10 | 1 | 5 |
5 Case study
The study project consists of eight parking floors in a commercial complex in Tehran, built by the private sector. The project is located in an area of 5000 square meters and has a metal structure. In the studied project, the data are collected through direct observation and project documentation including project specifications, project design, scheduling, cost accounts, progress reports, drawings, documents and photographs. The project scope includes site preparation and implementation of the walls, ceil and ramp of the parking.
Due to the reduction of the calculations and the volume of information provided, only the activity of site preparation and the activities of one floor as a single project has been considered and studied.
In the current project, the price of the project is based on its costs, not on Competitive conditions. The overhead costs, which include an important part of the costs, are considered as a constant percentage. In construction projects, the increase in time has a great deal of impact on overhead costs, which is not considered in traditional ways. Also, the physical progress of the project is not related to accounting reports, and their functions are separate, and at different times are calculated and reviewed, and do not help managers in making decisions at the right time. The physical progress of the project control is different and separate with the latest cost reports, and the cost of the project is calculated based on the categories of resource consumption that are not related to project activities and work packages, and there is no ability to track based on time and resource consumption of activity and the impact of time is not considered at the expense of different parts of the work. On the other hand, there is not a system and process based on current conditions of the project and its costs for decisions on cost reduction and maintaining competitiveness.
The project schedule starts on 23rd September 2017 with ending 22nd October 2017. At the beginning of the project, we used target costing (target price - strategic profit = allowable cost), therefore allowable costs estimated at $392,763. The steps to determine the direct and indirect costs of the proposed method are implemented.
The following steps have been taken to estimate the overhead costs:
- Identify and categorize project overheads.
- Identify the resource driver and the amount of them.
- Determine the standard rate of each resource.
- Determine the total cost of each resource.
- Identify activities related to each overhead.
- Determine the amount of driver for each activity. (the total amount of driver of the resources divides among the activities according to the amount of consumption.). Activities with monthly fixed costs have the following formula, amount of resource driver * (duration of activity / total duration of the project).
- Calculate rate of the cost driver for each activity. (total resource cost/total amount of resource driver)
- Calculate the cost driver for each activity. (the amount of driver for each activity * rate of the cost driver for each activity)
- Cost objective of each activity (the sum of the cost drivers of each activity related to different resource)
Table 2. Determine the direct costs of activity level
| Direc cost of activity level | ||||||||
|---|---|---|---|---|---|---|---|---|
| Activity | Resource | Resourcedriver & Amount driver Identification | Calculateof the cost | Total direct cost per activity | ||||
| Direct Resources | Direct Resources | |||||||
| Activity level | Activity level | |||||||
| worker | Concrete | bar | worker | Concrete | bar | |||
| Resourcedriver | person | M3 | Kg/ton | Number | M3 | Kg/ton | ||
| Standard Rate($) | 21 $ | 37 $ | 0/58 $ | 21 $ | 37 $ | 0/58 $ | ||
| Project | Duration (Day) | direct cost per activity | ||||||
| Floor | 16 | |||||||
| walls | 9 Day | $81.040 | ||||||
| Reinforcement | 5 Day | 150 person | 74000 Kg | $3.150 | $42.920 | $46.070 | ||
| formwork | 4 Day | 120 person | $2.520 | $2.520 | ||||
| concreting | 3 Day | 30 person | 860 M3 | $630 | $31.820 | $32.450 | ||
| Ceiling | 8 Day | $256.186 | ||||||
| Scaffolding | 4 Day | 70 person | $1.470 | $1.470 | ||||
| install Plywood | 2 Day | 30 person | $630 | $630 | ||||
| Reinforcement | 5 Day | 46 person | 340000 Kg | $966 | $197.200 | $198.166 | ||
| concreting | 3 Day | 20 person | 1500 M3 | $420 | $55.500 | $55.920 | ||
| Total Resource driver | Total | 466 person | 2360 M3 | 414000 Kg | $9.786 | $87.320 | $240.120 | $337.226 |
Table 3. Determine the amount of direct resource in batch and project level and the amount of overhead resource
| Activity | Overhead Resourse | The Amount of Direct Resourse | The Amount of Overhead Resourse | |||||||||
| batch level | project level | Activity level | batch level | |||||||||
| Wire and spacer | - | Safety shoes | Helmet | gloves | Conex | Site office | warehouse | Depreciation of Polywood | Depreciation of metal mold | Depreciation of scaffold | ||
| Resourse driver | Kg | - | pair | pair | pair | M2 | M2 | M2 | 10% (Total,kg ) | 10% (Total,kg ) | 10% (Total,kg ) | |
| Amount | 20700 Kg | - | 100 pair | 100 pair | 200 pair | 120 M2 | 80 M2 | 60 M2 | 1700 kg | 28000 kg | 400 kg | |
| Standard Rate($) | $0,76 | $13 | $1,3 | $0,50 | $21 | $21 | $18 | $26 | $0,46 | $0,46 | ||
| Total resource cost | $15.732 | $1.300 | $130 | $100 | $2.520 | $1.680 | $1.080 | $4.420 | $1.288 | $18,4 | ||
| Rate of cost driver (Total resource cost/Total Amount driver) | $0,76 | - | $13 | $1,3 | $0,5 | $21 | $21 | $18 | $3 | $0,05 | $0,05 | |
| Project | Duration (Day) | 30 Day | 30 Day | 20 Day | 20 Day | 20 Day | 20 Day | 20 Day | 20 Day | 30 Day | 30 Day | 30 Day |
| Site preparation | 20 Day | 100 pair | 100 pair | 200 pair | 120 M2 | 80 M2 | 60 M2 | |||||
| Floor | 16 Day | |||||||||||
| walls | 9 Day | |||||||||||
| Reinforcement | 5 Day | 3700 Kg | ||||||||||
| formwork | 4 Day | 14000 Kg | ||||||||||
| concreting | 3 Day | 14000 Kg | ||||||||||
| Ceiling | 8 Day | |||||||||||
| Scaffolding | 4 Day | 80 Kg | ||||||||||
| install Plywood | 2 Day | 170 Kg | 40 Kg | |||||||||
| Reinforcement | 5 Day | 17000 Kg | 340 Kg | 80 Kg | ||||||||
| concreting | 3 Day | 1190 Kg | 200 Kg | |||||||||
| Total resourse driver | 20700 Kg | - | 100 pair | 100 pair | 200 pair | 120 M2 | 80 M2 | 60 M2 | 1700 Kg | 28000 Kg | 400 Kg | |
Table 4. Continue with the amount of direct resource in batch and project level and the amount of overhead resource
| Activity | Overhead Resourse | Amount of Overhead Resourse | |||||||
| project level | Facility level | ||||||||
| Transportation | Civil engineer | Surveyor | Project Planner | project manager | Office Supplies | utilities | pantry & consumables | ||
| Resourse driver | items | Person / month | Person / month | Person / month | Person / month | Average | Month | Month | |
| Amount | 25 | 2 | 1 | 1 | 1 | 1 | 1 | 1 | |
| Standard Rate($) | $65 | $1.315 | $789 | $526 | $1.842 | $1.315 | $790 | $730 | |
| Total resource cost | $1.625 | $2.630 | $789 | $526 | $1.842 | $1.315 | $790 | $730 | |
| Rate of cost driver (Total resource cost/ Total Amount driver) | $65 | $858 | $515 | $343 | $1.201 | $858 | $515 | $476 | |
| Project | Duration (Day) | 30 Day | 30 Day | 30 Day | 30 Day | 30 Day | 30 Day | 30 Day | 30 Day |
| Site preparation | 20 Day | 8 | 1/33 | 0/67 | 0/67 | 0/67 | 0/67 | 0/67 | 0/67 |
| floor | 16 Day | ||||||||
| walls | 9 Day | ||||||||
| Reinforcement | 5 Day | 3 | 0/33 | 0/17 | 0/17 | 0/17 | 0/17 | 0/17 | 0/17 |
| formwork | 4 Day | 3 | 0/27 | 0/13 | 0/13 | 0/13 | 0/13 | 0/13 | 0/13 |
| concreting | 3 Day | 1 | 0/20 | 0/10 | 0/10 | 0/10 | 0/10 | 0/10 | 0/10 |
| Ceiling | 8 Day | ||||||||
| Scaffolding | 4 Day | 3 | 0/27 | 0/13 | 0/13 | 0/13 | 0/13 | 0/13 | 0/13 |
| install Plywood | 2 Day | 2 | 0/13 | 0/07 | 0/07 | 0/07 | 0/07 | 0/07 | 0/07 |
| Reinforcement | 5 Day | 4 | 0/33 | 0/17 | 0/17 | 0/17 | 0/17 | 0/17 | 0/17 |
| concreting | 3 Day | 1 | 0/20 | 0/10 | 0/10 | 0/10 | 0/10 | 0/10 | 0/10 |
| Total resourse driver | 25 | 3/07 | 1/53 | 1/53 | 1/53 | 1/53 | 1/53 | 1/53 | |
Table 5. Determine the cost of direct recourse in batch and project level and The cost of overhead resource
| Activity | Overhead Resourse | The Cost of Direct Resourse | The Cost of Overhead Resourse | |||||||||
| batch level | project level | Activity level | batch level | |||||||||
| Wire and spacer | - | Safety shoes | Helmet | gloves | Conex | Site office | warehouse | Depreciation of Polywood | Depreciation of metal mold | Depreciation of scaffold | ||
| Resourse driver | Kg | - | pair | pair | pair | M2 | M2 | M2 | 10% (Total,kg) | 10% (Total,kg) | 10% (Total,kg) | |
| Amount | 20700 Kg | - | 100 pair | 100 pair | 200 pair | 120 | 80 | 60 | 1700 | 28000 | 400 | |
| Standard Rate($) | $0,76 | $13 | $1,3 | $0,50 | $21 | $21 | $18 | $26 | $0,46 | $0,46 | ||
| Total resource cost | $15.732 | $1.300 | $130 | $100 | $2.520 | $1.680 | $1.080 | $4.420 | $1.288 | $18 | ||
| Rate of cost driver (Total Amount driver/Total resource cost) | $0,76 | - | $13 | $1,3 | $0,5 | $21 | $21 | $18 | $3 | $0,05 | $0,05 | |
| Project | Duration (Day) | 30 Day | 30 Day | 20 Day | 20 Day | 20 Day | 20 Day | 20 Day | 20 Day | 30 Day | 30 Day | 30 Day |
| Site preparation | 20 Day | $1.300 | $130 | $100 | $2.520 | $1.680 | $1.080 | |||||
| Floor | 16 Day | |||||||||||
| walls | 9 Day | |||||||||||
| Reinforcement | 5 Day | $2.812 | ||||||||||
| formwork | 4 Day | $644 | ||||||||||
| concreting | 3 Day | $644 | ||||||||||
| Ceiling | 8 Day | |||||||||||
| Scaffolding | 4 Day | $4 | ||||||||||
| install Plywood | 2 Day | $442 | $2 | |||||||||
| Reinforcement | 5 Day | $12.920 | $884 | $4 | ||||||||
| concreting | 3 Day | $3.094 | $9 | |||||||||
| Total resourse driver | 20.700 | - | 100 pair | 100 pair | 200 pair | 120 M2 | 80 M2 | 60 M2 | 1700 Kg | 28000 Kg | 400 Kg | |
| Total resourse cost | $15.732 | $0 | $1.300 | $130 | $100 | $2.520 | $1.680 | $1.080 | $4.420 | $1.288 | $18 | |
Table 6. Continue Determine the cost of direct recourse in batch and project level and the cost of overhead resource.
| Activity | Overhead Resourse | The Cost of Overhead Resource | Total Overhead cost | Total direct cost. batch & project level | ||||||||
| project level | Facility level | |||||||||||
| Transportation | Civil engineer | Surveyor | Project Planner | Supervisor | project manager | Office Supplies | utilities | Pantry & consumables | ||||
| Resourse driver | items | Person / month | Person / month | Person / month | Person / month | Person / month | Average | Month | Month | |||
| Amount | 25 | 2 | 1 | 1 | 1 | 1 | 1 | 1 | 1 | |||
| Standard Rate($) | $65 | $1.315 | $789 | $526 | $1.842 | $1.842 | $1.315 | $790 | $730 | |||
| Total resource cost | $1.625 | $2.630 | $789 | $526 | $1.842 | $1.842 | $1.315 | $790 | $730 | |||
| Rate of cost driver (Total Amount driver / Total resource cost) | $65 | $858 | $515 | $343 | $1.201 | $1.201 | $858 | $515 | $476 | |||
| Project | Duration (Day) | 30 | 30 | 30 | 30 | 30 | 30 | 30 | 30 | 30 | ||
| Site preparation | 20 Day | $520 | $1.143 | $343 | $229 | $801 | $801 | $572 | $343 | $317 | $11.880 | $0 |
| Floor | 16 Day | |||||||||||
| walls | 9 Day | |||||||||||
| Reinforcement | 5 Day | $195 | $286 | $86 | $57 | $200 | $200 | $143 | $86 | $79 | $1.332 | $2.812 |
| formwork | 4 Day | $195 | $229 | $69 | $46 | $160 | $160 | $114 | $69 | $63 | $1.749 | $0 |
| concreting | 3 Day | $65 | $172 | $51 | $34 | $120 | $120 | $86 | $52 | $48 | $1.391 | $0 |
| Ceiling | 8 Day | |||||||||||
| Scaffolding | 4 Day | $195 | $229 | $69 | $46 | $160 | $160 | $114 | $69 | $63 | $1.109 | $0 |
| install Plywood | 2 Day | $130 | $114 | $34 | $23 | $80 | $80 | $57 | $34 | $32 | $1.029 | $0 |
| Reinforcement | 5 Day | $260 | $286 | $86 | $57 | $200 | $200 | $143 | $86 | $79 | $2.285 | $12.920 |
| concreting | 3 Day | $65 | $172 | $51 | $34 | $120 | $120 | $86 | $52 | $48 | $3.851 | $0 |
| Total resourse driver | 25 | 3,07 | 1,53 | 1,53 | 1,53 | 1,53 | 1,53 | 1,53 | 1,53 | $24.625 | $15.732 | |
| Total resourse cost | $1.625 | $2.630 | $789 | $526 | $1.842 | $1.842 | $1.315 | $790 | $730 | $40.357 | ||
As a result, the total direct costs of the activity level amounted to $337,226, and the total direct cost of the batch and project level was $15,732 and total overhead costs were $24,625. Then budgeting the costs based on schedule.
Table 7. Budgeting the direct costs (activity level)
| Project | Duration (Day) | Schedule / Calculate the cost of each day | Total direct cost per activity (Activity level) | |||||||||||||||
|---|---|---|---|---|---|---|---|---|---|---|---|---|---|---|---|---|---|---|
| Floor | 16 | |||||||||||||||||
| walls | 9 | 10/7 | 10/8 | 10/9 | 10/10 | 10/11 | 10/12 | 10/13 | 10/14 | 10/15 | 10/16 | 10/17 | 10/18 | 10/19 | 10/20 | 10/21 | 10/22 | $81.040 |
| Reinforcement | 5 | $9.214 | $9.214 | $9.214 | $9.214 | $9.214 | $46.070 | |||||||||||
| formwork | 4 | $630 | $630 | $630 | $630 | $2.520 | ||||||||||||
| concreting | 3 | $10.817 | $10.817 | $10.817 | $32.450 | |||||||||||||
| Ceiling | 8 | $256.186 | ||||||||||||||||
| Scaffolding | 4 | $368 | $368 | $368 | $368 | $1.470 | ||||||||||||
| install Plywood | 2 | $315 | $315 | $630 | ||||||||||||||
| Reinforcement | 5 | $39.633 | $39.633 | $39.633 | $39.633 | $39.633 | $198.166 | |||||||||||
| concreting | 3 | $18.640 | $18.640 | $18.640 | $55.920 | |||||||||||||
| Total cost | $9.214 | $9.214 | $9.844 | $9.844 | $20.661 | $11.447 | $10.817 | $368 | $368 | $368 | $40.316 | $39.948 | $39.633 | $58.273 | $58.273 | $18.640 | $337.226 | |
Table 8. Budgeting the direct costs for batch and project level and overhead costs
| Project | Duration (Day) | Total Overhead cost | Total direct cost. batch & project level | TOTAL | 9/23 | 9/24 | 9/25 | 9/26 | 9/27 | 9/28 | 9/29 | 9/30 | 10/1 | 10/2 | 10/3 | 10/4 | 10/5 | 10/6 |
|---|---|---|---|---|---|---|---|---|---|---|---|---|---|---|---|---|---|---|
| Site preparation | 20 | $11.880 | $0 | $11.880 | $594 | $594 | $594 | $594 | $594 | $594 | $594 | $594 | $594 | $594 | $594 | $594 | $594 | $594 |
| Floor | 16 | |||||||||||||||||
| walls | 9 | |||||||||||||||||
| Reinforcement | 5 | $1.332 | $2.812 | $4.144 | ||||||||||||||
| formwork | 4 | $1.749 | $0 | $1.749 | ||||||||||||||
| concreting | 3 | $1.391 | $0 | $1.391 | ||||||||||||||
| Ceiling | 8 | |||||||||||||||||
| Scaffolding | 4 | $1.109 | $0 | $1.109 | ||||||||||||||
| install Plywood | 2 | $1.029 | $0 | $1.029 | ||||||||||||||
| Reinforcement | 5 | $2.285 | $12.920 | $15.205 | ||||||||||||||
| concreting | 3 | $3.851 | $0 | $3.851 | ||||||||||||||
| Total | $24.625 | $15.732 | $40.357 | $594 | $594 | $594 | $594 | $594 | $594 | $594 | $594 | $594 | $594 | $594 | $594 | $594 | $594 |
Table 9. Continuing budgeting of direct costs for batch and project level and overhead costs
| Project | Duration (Day) | 10/7 | 10/8 | 10/9 | 10/10 | 10/11 | 10/12 | 10/13 | 10/14 | 10/15 | 10/16 | 10/17 | 10/18 | 10/19 | 10/20 | 10/21 | 10/22 | Total |
|---|---|---|---|---|---|---|---|---|---|---|---|---|---|---|---|---|---|---|
| Site preparation | 20 | $594 | $594 | $594 | $594 | $594 | $594 | $11.880 | ||||||||||
| Floor | 16 | |||||||||||||||||
| walls | 9 | |||||||||||||||||
| Reinforcement | 5 | $829 | $829 | $829 | $829 | $829 | $4.144 | |||||||||||
| formwork | 4 | $437 | $437 | $437 | $437 | $1.749 | ||||||||||||
| concreting | 3 | $464 | $464 | $464 | $1.391 | |||||||||||||
| Ceiling | 8 | |||||||||||||||||
| Scaffolding | 4 | $277 | $277 | $277 | $277 | $1.109 | ||||||||||||
| install Plywood | 2 | $514 | $514 | $1.029 | ||||||||||||||
| Reinforcement | 5 | $3.041 | $3.041 | $3.041 | $3.041 | $3.041 | $15.205 | |||||||||||
| concreting | 3 | $1.284 | $1.284 | $1.284 | $3.851 | |||||||||||||
| Total | $1.423 | $1.423 | $1.860 | $1.860 | $2.324 | $1.495 | $464 | $277 | $277 | $277 | $3.833 | $3.555 | $3.041 | $4.325 | $4.325 | $1.284 | $40.357 |
According to the calculations, the total cost of the bottom-up approach was $377,583 with the performance focused activity based costing method. The estimated cost calculated by the target costing method was $392,763. Considering that the costs calculated and estimated by the activity based costing method are less than the allowable costs calculated by the target costing method, it can be the basis for the cost.
To control costs in the cut of date 25, actual costs are compared with the plan costs to determine the cost deviation. After updating the schedule and determining the actual costs, the cost of the plan is compared to the actual cost until the end of the 25th day.
At this stage, it is necessary to integrated measuring project progress with cost calculations to help calculate project cost deviations, corrective actions and strategic decisions.
Table 10. Actual direct costs until 25th
| Actual Cost - Cut of date 25th | ||||||||||
|---|---|---|---|---|---|---|---|---|---|---|
| Activity | Resourse | Actual Resourcedriver &Amount driver Identification | Calculate of the Actual cost | Total Actual direct cost per activity | ||||||
| Actual Direct Resources | ActualDirect Resources | |||||||||
| Activity level | Activity level | |||||||||
| worker | Concrete | bar | worker | Concrete | bar | |||||
| Resourcedriver | Number | M3 | Kg/ton | Number | M3 | Kg/ton | ||||
| Standard Rate($) | $23 | $ 39 | $0/58 | $23 | $39 | $0/58 | ||||
| Project | Actual Duration (Day) | Plan Progress | Actual Progress | Total Actual direct cost | ||||||
| Floor | 65% | 48% | ||||||||
| walls | 100% | 62% | $58.495 | |||||||
| Reinforcement | 3 Day | 100% | 65% | 120 person | 50000 Kg | $2.760 | $29.000 | $31.760 | ||
| formwork | 3 Day | 100% | 60% | 110 person | $2.530 | $2.530 | ||||
| concreting | 2 Day | 100% | 60% | 35 person | 600 M3 | $805 | $23.400 | $24.205 | ||
| Ceiling | 36% | 20% | $103.621 | |||||||
| Scaffolding | 3 Day | 75% | 40% | 50 person | $1.150 | $1.150 | ||||
| install Plywood | 2 Day | 50% | 40% | 20 person | $460 | $460 | ||||
| Reinforcement | 4 Day | 20% | 40% | 32 person | 140000 Kg | $736 | $81.200 | $81.936 | ||
| concreting | 2 Day | 0% | 20% | 25 person | 500 M3 | $575 | $19.500 | $20.075 | ||
| Total Resourcedriver | Total | 392 person | 1100 M3 | 190000 Kg | $9.016 | $42.900 | $110.200 | $162.116 | ||
Table 11. Plan direct costs until 25th
| Plan Cost - Cut of date 25th | |||||||
|---|---|---|---|---|---|---|---|
| Activity | Resourse | Calculateof the cost | Total direct cost per activity | ||||
| Direct Resources | |||||||
| Activity level | |||||||
| worker | Concrete | bar | |||||
| Resourcedriver | Number | M3 | Kg/ton | ||||
| Standard Rate($) | $21 | $37 | $1 | ||||
| Project | Actual Duration (Day) | Plan Progress | Actual Progress | direct cost per activity | |||
| Floor | 65% | 48% | |||||
| walls | 100% | 62% | $81.040 | ||||
| Reinforcement | 3 Day | 100% | 65% | $3.150 | $42.920 | $46.070 | |
| formwork | 3 Day | 100% | 60% | $2.520 | $2.520 | ||
| concreting | 2 Day | 100% | 60% | $630 | $31.820 | $32.450 | |
| Ceiling | 36% | 20% | $41.051 | ||||
| Scaffolding | 3 Day | 75% | 40% | $1.103 | $1.103 | ||
| install Plywood | 2 Day | 50% | 40% | $315 | $315 | ||
| Reinforcement | 4 Day | 20% | 40% | $193 | $39.440 | $39.633 | |
| concreting | 2 Day | 0% | 20% | $0 | $0 | $0 | |
| Total Resourcedriver | Total | $7.911 | $31.820 | $82.360 | $122.091 | ||
As a result, considering the cost details in the tables above, the reasons for the increase in cost are tracked and the details of the amount of resource, the rate and the plan cost and actual trackable costs has been calculated. It can also be used for each activity and resource, such as matrix tables, to calculate the efficiency, effectiveness, and productivity of each activity. Specifically, for the reinforcement of the walls activity/worker Resource, the following is stated below.
Table 12. A summary of performance report for the Reinforcement of the walls activity/worker resource
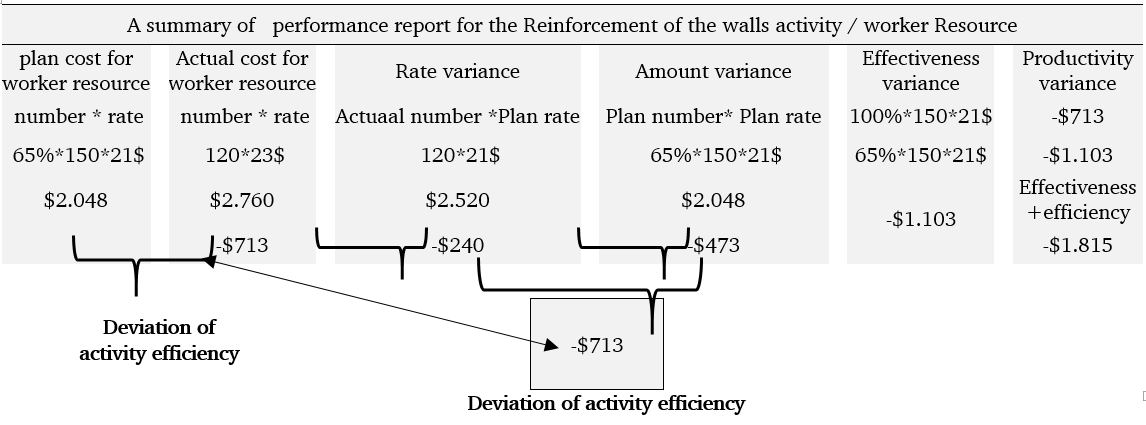
Efficiency means doing activities in the least time and with minimal resources. The difference between the two values of actual cost and plan cost indicates the deviation. On the other hand, the sum of the Rate variance and the Amount variance is efficiency that are the root and the reasons for the increase in cost. Effectiveness variance also indicates the amount of achievement of predetermined goals. Productivity is also the result of a combination of efficiency and effectiveness deviations.
Table 13. Earned Value of direct costs until 25th
| Earned Value - Cut of date 25 th | ||||||||||
|---|---|---|---|---|---|---|---|---|---|---|
| Activity | Resource | Resourcedriver &Amount driver Identification | Calculate of Earned Value cost | Total Earned Value direct cost per activity | ||||||
| Direct Resources | Direct Resources | |||||||||
| Activity level | Activity level | |||||||||
| worker | Concrete | bar | worker | Concrete | bar | |||||
| Resource driver | Number | M3 | Kg/ton | Number | M3 | Kg/ton | ||||
| Standard Rate($) | $23 | $39 | $1 | $23 | $39 | $1 | ||||
| Project | Actual Duration (Day) | Plan Progress | Actual Progress | Earned Value direct cost | ||||||
| Floor | 65% | 48% | ||||||||
| walls | 100% | 62% | $50.928 | |||||||
| Reinforcement | 3 Day | 100% | 65% | 97/5 person | 48100 Kg | $2.048 | $27.898 | $29.946 | ||
| formwork | 3 Day | 100% | 60% | 72 person | $1.512 | $1.512 | ||||
| concreting | 2 Day | 100% | 60% | 18 person | 516 M3 | $378 | $19.092 | $19.470 | ||
| Ceiling | 36% | 20% | $91.290 | |||||||
| Scaffolding | 3 Day | 75% | 40% | 28 person | $588 | $588 | ||||
| install Plywood | 2 Day | 50% | 40% | 12 person | $252 | $252 | ||||
| Reinforcement | 4 Day | 20% | 40% | 18/4 person | 136000 Kg | $386 | $78.880 | $79.266 | ||
| concreting | 2 Day | 0% | 20% | 4 person | 300 M3 | $84 | $11.100 | $11.184 | ||
| Total Resourcedriver | Total | 250 | 816 | 184.100 | $5.248 | $30.192 | $106.778 | $142.218 | ||
As a result, total direct cost deviation (activity level) of the plan is equal to $-19,898 due to the increase in standard labor rate, the standard rate of concrete and material waste.
In the following, actual direct costs of the batch and project level and actual overhead costs up to 25th are calculated. In order to determine the actual overhead costs, it is only necessary to change the amount of actual resource and actual resource rates in the matrices, and also update the schedule and change the time of the resources affected by the time. Also to determine the amount of resource driver for activities that resource driver of them is time, such as project and facility overhead resources, this formula has been used: ((activity duration/total duration of the project) * Amount of resource driver).
And The following formula uses to compute the total cost of the source that resource driver of them is time:
((duration until the cut of the date/duration of resource driver) * Amount of resource driver * Standard Rate ($) = (25/30) *2*$1,315=$2,183 (civil engineer)
Table 14. Actual direct costs of the batch and project level and actual overhead costs up to 25th
| Activity | Overhead Resourse | The Actual Cost of Direct Resourse | The Actual Cost of Overhead Resourse | |||||||||
| batch level | project level | Activity level | batch level | |||||||||
| Wire and spacer | - | Safety shoes | Helmet | gloves | Conex | Site office | warehouse | Depreciation of Polywood | Depreciation of metal mold | Depreciation of scaffold | ||
| Resourse driver | Kg | - | pair | pair | pair | M2 | M2 | M2 | 10% (Total,kg) | 10% (Total,kg) | 10% (Total,kg) | |
| Amount | 20700 Kg | - | 120 pair | 120 pair | 230 pair | 120 M2 | 80 M2 | 60 M2 | 1700 Kg | 28000 Kg | 400 Kg | |
| Standard Rate($) | $0,76 | $15 | $2 | $0,50 | $21 | $21 | $18 | $26 | $0,46 | $0,46 | ||
| Total resource cost | $15.732 | $1.800 | $240 | $115 | $2.520 | $1.680 | $1.080 | $4.420 | $1.288 | $18 | ||
| Rate of cost driver (Total Amount driver/Total resource cost) | $0,76 | - | $15 | $2,0 | $0,5 | $21 | $21 | $18 | $3 | $0,05 | $0,05 | |
| 1 | 1 | 1 | 1 | 1 | 1 | 1 | 1 | 1 | 1 | 1 | ||
| Project | Duration (Day) | 25 Day | 25 Day | 20 Day | 20 Day | 20 Day | 20 Day | 20 Day | 20 Day | 25 Day | 25 Day | 25 Day |
| Site preparation | 20 Day | $1.800 | $240 | $115 | $2.520 | $1.680 | $1.080 | |||||
| Floor | 16 Day | |||||||||||
| walls | 9 Day | |||||||||||
| Reinforcement | 5 Day | $2.812 | ||||||||||
| formwork | 4 Day | $644 | ||||||||||
| concreting | 3 Day | $644 | ||||||||||
| Ceiling | 8 Day | |||||||||||
| Scaffolding | 4 Day | $4 | ||||||||||
| install Plywood | 2 Day | $442 | $2 | |||||||||
| Reinforcement | 5 Day | $12.920 | $884 | $4 | ||||||||
| concreting | 3 Day | $3.094 | $9 | |||||||||
| Total resourse driver | 20700 Kg | - | 120 pair | 120 pair | 230 pair | 120 M2 | 80 M2 | 60 M2 | 1700 Kg | 28000 Kg | 400 Kg | |
| Total resourse cost | $15.732 | $0 | $1.800 | $240 | $115 | $2.520 | $1.680 | $1.080 | $4.420 | $1.288 | $18 | |
Table 15. Continuing actual direct costs of the batch and project level and actual overhead costs up to 25th
| Activity | Overhead Resourse | The Actual Cost of Overhead Resourse | ||||||||
| project level | Facility level | |||||||||
| Transportation | Civil engineer | Surveyor | Project Planner | Supervisor | project manager | Office Supplies | utilities | Pantry & consumables | ||
| Resourse driver | items | Person / month | Person / month | Person / month | Person / month | Person / month | Average | Month | Month | |
| Amount | 30 | 2 | 1 | 1 | 1 | 1 | 1 | 1 | 1 | |
| Standard Rate($) | $71 | $1,315 | $789 | $526 | $1,842 | $1,842 | $1,315 | $790 | $730 | |
| Total resource cost | $2,130 | $2,183 | $655 | $437 | $1,529 | $1,529 | $1,091 | $656 | $606 | |
| Rate of cost driver (Total Amount driver/Total | $85 | $700 | $420 | $280 | $980 | $980 | $700 | $420 | $388 | |
| 1 | 0/830 | 0/830 | 0/830 | 0/830 | 0/830 | 0/830 | 0/830 | 0/830 | ||
| Project | Duration (Day) | 25 | 25 | 25 | 25 | 25 | 25 | 25 | 25 | 25 |
| Site preparation | 20 | $682 | $1,119 | $336 | $224 | $784 | $784 | $560 | $336 | $311 |
| Floor | 16 | |||||||||
| walls | 9 | |||||||||
| Reinforcement | 5 | $256 | $168 | $50 | $34 | $118 | $118 | $84 | $50 | $47 |
| formwork | 4 | $256 | $168 | $50 | $34 | $118 | $118 | $84 | $50 | $47 |
| concreting | 3 | $85 | $112 | $34 | $22 | $78 | $78 | $56 | $34 | $31 |
| Ceiling | 8 | |||||||||
| Scaffolding | 4 | $256 | $168 | $50 | $34 | $118 | $118 | $84 | $50 | $47 |
| install Plywood | 2 | $170 | $112 | $34 | $22 | $78 | $78 | $56 | $34 | $31 |
| Reinforcement | 5 | $341 | $224 | $67 | $45 | $157 | $157 | $112 | $67 | $62 |
| concreting | 3 | $85 | $112 | $34 | $22 | $78 | $78 | $56 | $34 | $31 |
| Total resourse driver | 25 | 3/12 | 1/56 | 1/56 | 1/56 | 1/56 | 1/56 | 1/56 | 1/56 | |
| Total resourse cost | $2,130 | $2,183 | $655 | $437 | $1,529 | $1,529 | $1,091 | $656 | $606 | |
To calculate the direct costs of the batch and project level and overhead costs up to 25th, are obtained by multiplying the plan's progress of each activity at the plan cost.
Table 16. The Plan and Earned Value Cost (overhead cost and direct cost of batch &project level) until 25th
| The Plan Cost and Earned value until 25th | Earned value | |||||
|---|---|---|---|---|---|---|
| Progress | Overhead cost | direct cost of batch & project level | Earned value of Overhead cost | Earned value of direct cost of batch & project level | ||
| Project | Plan Progress | Actual Progress | ||||
| Site preparation | 100% | 100% | $11.880 | $0 | $11.880 | $0 |
| Floor | 65% | 48% | ||||
| walls | 100% | 62% | $4.473 | $2.812 | $2.750 | $1.828 |
| Reinforcement | 100% | 65% | $1.332 | $2.812 | $866 | $1.828 |
| formwork | 100% | 60% | $1.749 | $0 | $1.049 | $0 |
| concreting | 100% | 60% | $1.391 | $0 | $835 | $0 |
| Ceiling | 36% | 20% | $1.803 | $2.584 | $2.539 | $5.168 |
| Scaffolding | 75% | 40% | $831 | $0 | $443 | $0 |
| install Plywood | 50% | 40% | $514 | $0 | $412 | $0 |
| Reinforcement | 20% | 40% | $457 | $2.584 | $914 | $5.168 |
| concreting | 0% | 20% | $0 | $0 | $770 | $0 |
| Total | $18.155 | $5.396 | $17.169 | $6.996 | ||
| Total | 23.551 | 24.165 | ||||
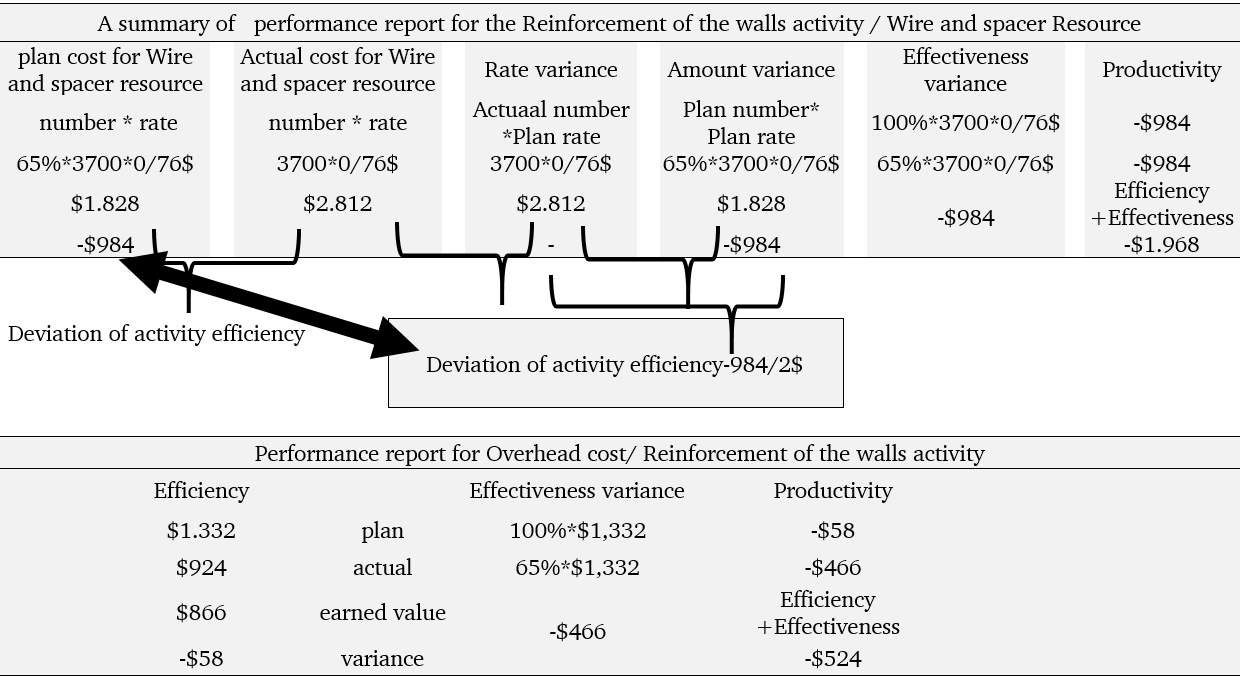
Consequently, based on the calculations, the actual direct costs of the batch and project level up to date 25 are $15,732 and the plan costs is $5,396. Actual overhead costs up to date 25 are $23,977 and plan costs are $18,155. As a result, overhead cost and direct cost of batch and project level deviations is equal to -$15,544. Causes of cost deviations can be measured and tracked based on efficiency (deviation of the rate, deviation of amount), effectiveness, and productivity.
Table 17. A summary of performance report for the Reinforcement of the walls activity/Wire and spacer Resource
Then, it estimates the total cost of the project. Total cost of project completion is calculated as follows:
Total cost of the project = Actual cost + Estimated remaining costs
As a result, calculating all three categories of costs including the direct cost of the activity level, batch level and the project level and the overhead cost, the estimated cost of the project is equal to $389,538.
After calculating the total cost of the project, it should be compared with the target cost and the calculated strategic profit, and check the amount of deviation from the allowable cost. Given the fact that at this stage, it has been faced with increasing costs, but the final cost of the project has not exceeded the planned cost with the target costing and still delivers the desired profit.
However, due to the details of the costs, it was necessary to reduce the costs of materials waste and extend the duration of the project. It is also clear from the calculations that the direct human resources of the project were more than predicted and their costs were higher than the standard rate.
Also, according to the existing conditions, the employer should be required to carry out the project's pre-requisite activities, such as insulation and installation of the pillar to prevent further project delays, otherwise direct human resources should be reduced and at a lower cost. Due to concrete and other materials waste, management should also have an accurate estimate of the amount of concrete and materials. As a result, with accurate tracking of costs and rooting due to increased costs, comprehensive and accurate information can be provided at the right time for management decisions.
Using the proposed method in the case study, we were able to integrate physical progress reports with accounting reports at the same time. In the traditional approach, we only looked at the categories of resources and their costs. in proposing method in addition to categorizing resources and calculating the costs of each resource, could be used to calculate and track the resources and costs associated with each activity, and the reason for the increase in costs was evaluated in each area of work and suggested approaches for better management and cost reduction and maintaining competitiveness.
It also calculates project performance and efficiency, and at any moment the project can be used to calculate the profit and loss, and the impact of time on the project. It can also calculate remaining work costs based on existing conditions and new prices and volumes of the resource. Finally, the new project costs compared with the competition costs and target costs, if necessary, to reduce costs of corrective action.
As a result of the case study, to confirm the hypothesis 1 and the difference in the proposed method with the traditional method, which categorizes costs only on the basis of resources, it is stated that the importance of linking resources with activities is due to the cause of increased costs and their impact on the cost of each activity and work department. Moreover, the impact of time on costs that was ignored in the traditional way has also been calculated.
In order to confirm the hypothesis 2 and the synergy in applying the two methods, it has been shown that the proposed method leads to better management of costs and the possibility of decision making and calculation of competitive prices in line with accurate costing and acts as a cycle. At any moment, it can determine the impact of costs on the final price, measure the amount of profit and loss, and calculate the effectivity and efficiency, and lead to the correct decisions when the proposed method is fully consistent with the project management and control system Are building.
6 Conclusion
Integrated costing system of performance focused activity based costing and the target costing has not been used in previous studies. Because of increase competition in the world, project oriented industries such as the construction industry need utilize more efficient systems especially for cost control. The proposed method in the paper can be used to identify, trace, budget, control, review the conditions of competitors, management decisions, corrective actions, and reporting in a better way and useful manner for managing. This proposed method facilitating according to the construction project process and the routine of project planning and control process, and it is easily understood for project control experts and project managers. The proposed system reduces the dependence of project managers on multiple reports of project control and accounting at different times with different language and knowledge. It has also led to decision-making on profits, cost reductions and corrective actions and appropriate allocation of costs and resources.
As a result, in this research, important features are provided in relation to the cost control system. Creating a strategic and competitive capability of the cost control system and simultaneously creating up-down view and down-to-top is one of these features. Also, with the allowable cost ceiling, for activities and work packages, it creates alarms to control cost overrun. With the feature of activity-driven direct and overhead costs, it can identify cost overflow segments. And with the target costing, value engineering and kaizen methods, reduces costs continuously.
The proposed method in this research illustrate that the traditional accounting system is not responsive to the project's accounting system, and it has many problems and deficiencies therefore our proposed method to answer the problems. The proposed method is proportional to the activities of the construction projects and is in line with the progress reports in the projects and in line with the knowledge and language that can be understood by project managers and relevant experts. In the proposed method, cost reports can reduce costs and optimize their management consistent with the physical progress of the project. One of the difficulties in implementing this method is the most accurate and detailed information required and the tracking of cost components that should be traced and collected consistently with the progress of the project and also require training for relevant specialists.
As a result, with a small amount of time and training to the relevant specialists, reports can be derived from the combination of progress reports of work with the cost of all resources that is allocated in various activities and work packages, and the amount and price of all work resources are included, and due to the dynamic nature of the system, you can update the amount of resource or new prices on the system and re-calculate the remaining costs according to the new conditions. Also, considering the competition and environmental conditions, the contract price can be determined.
Moreover, during the project, with increasing costs or changes in the price of resources or their amount, you can recalculate costs in new conditions and compare it with the target price, and profit and loss were recalculated and reviewed, and if necessary, corrective action and new methods can take and reduced costs. Furthermore, based on case study reports, the cause of increased costs (the amount and cost of specific resources) and the related work packages and activities are also determined, and their productivity and efficiency can be calculated. Additionally, by increasing the project time, timely information can be updated in the proposed cost control system, and cost impact and cost of remaining work can be estimated.
7 Recommendations for future research
In this research, we have designed a precise, high certainty, strategic system that can be based on new tools and techniques for cost management and building information management (BIM) in future research. In addition to increasing the competitiveness and level of accuracy and cost tracking capability, it can be provided a visual visibility of the project progression process along with direct and overhead cost management. Through computer simulation. It can also use BIM's capabilities to examine various designs and construction options by examining the impact of the competitive environment and component costs, along with direct and indirect costs over the life of the project.