Corporate Social Responsibility, Intangibles, and Dynamic Performance of the U.S. Airlines
ABSTRACT
This study first employs the dynamic data envelopment analysis (DEA) approach to measure the operating performance of the U.S. airline industry for the period 2006-2014. We examine whether airlines included in the Kinder, Lydenberg, and Domini (KLD) database have higher efficiencies than airlines not included in the KLD database. The seven corporate social responsibility (CSR) dimensions available in the KLD database are used to proxy for CSR. Through a radar graph, we thus also document the extent to which the airlines have implemented each of the dimensions of CSR. Next, this study explores the relationship between CSR and the operating performance of the airlines. Our findings show an indirect relationship between CSR and operating performance, which relies on the mediating effect of intangibles, after accounting for potential endogeneity problem. The findings of this study can provide guidelines for coping with CSR issues in the airline industry and for implementing CSR policies.
Keywords: Dynamic data envelopment analysis; Corporate social responsibility; Intangibles; U.S. airlines; KLD.
JEL classification: M14, L21.
La Responsabilidad Social Corporativa, los Intangibles y el Desempeño Dinámico de las Aerolíneas Estadounidenses
RESUMEN
En este estudio se emplea en primer lugar el enfoque del análisis dinámico de la envolvente de datos (DEA) para medir el rendimiento operativo de la industria aeronáutica de los Estados Unidos en el período 2006-2014. Examinamos si las aerolíneas incluidas en la base de datos de Kinder, Lydenberg y Domini (KLD) tienen una mayor eficiencia que las aerolíneas no incluidas en la base de datos de KLD. Las siete dimensiones de la responsabilidad social de las empresas (RSE) disponibles en la base de datos KLD se utilizan para representar la RSE. Así, a través de un gráfico de radar, también documentamos la medida en que las compañías aéreas han aplicado cada una de las dimensiones de la RSE. Este estudio también explora la relación entre la RSE y el rendimiento operativo de las aerolíneas. Nuestros hallazgos muestran una relación indirecta entre la RSE y el rendimiento operativo, que se basa en el efecto mediador de los intangibles, después de tener en cuenta el posible problema de la endogeneidad. Los hallazgos de este estudio pueden proporcionar directrices para hacer frente a los problemas de RSE en la industria de las aerolíneas y para implementar políticas de RSE.
Palabras clave: Análisis de la envolvente de datos dinámicos; Responsabilidad social corporativa; Intangibles; Aerolíneas de EE.UU.; KLD.
Códigos JEL: M14, L21.
1 Introduction
According to the statistics published by International Air Transport Association (IATA)1, airlines were expected to generate overall profits of $3.5 billion in 2012, down from the estimated $6.9 billion in 2011 and $15.8 billion in 2010. This scenario occurred regardless of some 3 billion people travelled using airlines in 2012. Recently, International Civil Aviation Organization (ICAO) projected that that number will nearly double by 2030. Therefore, airlines should consider how to effectively evaluate their operating performance with greater focus being placed on resource utilization and sources of inefficiency to increase their market share and competitive advantages. Furthermore, IATA also stressed that the airline industry faces significant threats from increasing oil prices, which means the cost of fuel could be one of the main causes of reduced profitability.
In today’s challenging corporate world, a unidimensional measure of performance such as return on assets (ROA) does not suffice to evaluate the operating performance of airlines. In evaluating airlines’ operating performance, data envelopment analysis (DEA), a benchmarking tool that simultaneously incorporates multiple inputs and multiple outputs in evaluating efficiency (Lu, Wang, Hung & Lu, 2012), has been widely applied in prior studies (for examples, Barros & Couto, 2013; Barros, Liang & Peypoch, 2013; Barros & Peypoch, 2009; Cheng, 2010; Fung, Wan, Hui & Law, 2008; Lam, Low & Tang, 2009; Lu et al., 2012; Merkert & Hensher, 2011; Wang, Lu & Tsai, 2011). Standing from efficiency evaluation viewpoint, more efficient utilization of inputs like fuel or more efficient production of outputs like revenue passenger miles may ultimately result in better operating performance. However, the nature of airline industry is sensitive to uncontrollable external factor like oil price volatility. Thus, airlines should place greater emphasis on boosting output to remain efficient.
From the perspective of a profit-oriented firm, outcomes of investments in socially responsible activities, i.e. financial performance, are important matters to be considered (Inoue & Lee, 2011). In the airline industry, airlines face increasing tasks to satisfy an increasing number of socially-conscious travelers, and they have thus carried out a number of socially responsible activities (Inoue & Lee, 2011). In the United States, for example, Alaska Air Group stated in its 2012 Sustainability Report that the report was its first full Sustainability Report, which expanded on its first 2010 published Environmental Report. On its website, Copa Airlines, Incorporated states that corporate social responsibility (CSR) serves as an integral part of its effort to be the leading airline in Latin American aviation. Interestingly, CSR is the business model of JetBlue Airways Corporation, an American low-cost non-union airline. Taken together, airlines consider the CSR investment as sustainable in a long run and thus expect such investment to ultimately enhance their bottom line.
Although businesses have recognized that CSR is a growingly important factor of corporate success, scholars have rarely examined the relationship between CSR and operating performance in the airline industry. Generally, results found in prior literature on the effects of CSR on corporate performance have been inconclusive. According to Surroca, Tribó and Waddock (2010) , incorporating intangibles as a mediating variable in explaining the relationship between CSR and corporate performance would explain the inconclusive findings. Another concern is the endogeneity problem in a performance–CSR mathematical model. It may well be that more efficient airlines are more prone to have embraced CSR because of surpluses of resources, but they also could become more efficient because of CSR. Specifically, there is a virtuous cycle between CSR and corporate performance Erhemjamts, Li & Venkateswaran, 2012; Surroca et al., 2010).
In this study, we first apply a dynamic DEA model to measure the operating performance of a sample of 22 U.S. airlines for the period 2006-2014. Established on the CSR perspective, we examine whether airlines included in the Kinder, Lydenberg and Domini (KLD) database (hereafter CSR airlines) have higher efficiencies as compared to airlines not included in the KLD database (hereafter non-CSR airlines). Because of the controversy associated with globalization, international environmental protection awareness has surged upward, and the concept of green consumption has arisen. This has caused the community and stakeholders to gradually raise their requirements for CSR. In the same regard, we thus also examine the degree of implementation of each of the dimensions of CSR among the CSR airlines. We utilize a “radar graph” format to find out which dimensions of CSR are mainly implemented by airlines. We employ the seven CSR dimensions available in the KLD database to proxy for CSR.
Furthermore, we also perform regression analysis involving efficiency score as the dependent variable and CSR as the explanatory variable. Our research complements existing research by taking the mediating effect of intangibles into account. This topic is important, given the attention to this issue by Surroca et al. (2010) that documents the relationship between CSR and corporate performance lies in the mediating effect of a firm’s intangibles. In achieving this objective, we first run two-stage least squares (2SLS) with panel data to explore the effect of CSR on operating performance. Next, we apply the method suggested by Preacher and Hayes (2008) to test the indirect effect of CSR on the operating performance of the U.S. airlines, using intangibles as the mediator.
Our paper differs from prior studies along three important dimensions. First, this study adopts a dynamic DEA model to assess the operating performance of airlines. The dynamic DEA model as in Tone and Tsutsui (2010) allows us to evaluate the longitudinal operating performance of the sample airlines. It is hoped that such application contributes to the DEA literature. Second, this study accounts for the mediating effects of intangibles and the endogeneity issue in the relationship between CSR and corporate performance. As highlighted by Surroca et al. (2010) , CSR only has indirect effects on corporate performance. Third, this study utilizes a “radar graph” format to depict the extent of implementation of dimensions of CSR by the U.S. airlines. Overall, this study could help manager or policy makers in the airline industry improve their competitive advantages and ultimately corporate efficiency.
The remainder of this study is organized as follows: Section 2 discusses the related literature; Section 3 describes the research design, including the dynamic production process of an airline and data collection. Section 4 presents empirical data and analysis of the results; and Section 5 presents the conclusions.
2 Literature review
2.1 The application of DEA in the airline industry
Previous research has applied the DEA model to measure the efficiency of the airline industry. Greer (2008) uses DEA and the Malmquist productivity index to examine changes in the productivity of the major American passenger airlines. Barros and Peypoch (2009) use DEA to evaluate the operational performance of a sample of 27 airlines that are members of the Association of European Airlines (AEA). Cheng (2010) applies DEA to analyze the relationship between efficiency and distribution strategies, while Wang et al. (2011) utilize DEA to explore the link between corporate governance and the operating performance of 30 airlines in the U.S. in 2006. Evaluating key determinants of 58 passenger airlines efficiency, Merkert and Hensher (2011) find that airline size and key fleet mix characteristics affect technical, allocative, and cost efficiencies.
Lu et al. (2012) explore the relationship between operating performance and corporate governance in 30 airline companies operating in the U.S. The study applies a two-stage DEA to evaluate the production efficiency and marketing efficiency of the airlines. Barros and Couto (2013) evaluate productivity changes of European airlines from 2000 to 2011 using the Luenberger productivity indicator, while Barros et al. (2013) applies the B-convex model to investigate the technical efficiency of US airlines from 1998 to 2010. Tavassoli, Faramarzi, and Farzipoor Saen (2014) employ a slacks-based measure network DEA model to measure technical efficiency and service effectiveness of airlines. Also using a slacks-based measure DEA model, Chang, Park, Jeong and Lee (2014) examine the economic and environmental efficiencies of 27 global airlines. Through an additive two-stage network DEA model, Lu, Hung, Kweh, Wang and Lu (2014a) examine the production efficiency and marketing efficiency of the U.S. airline industry. Taken together, to the best of our knowledge, we did not find any study that apply dynamic DEA to examine the performance of airlines.
2.2 Theoretical underpinnings and hypothesis development
McWilliams and Siegel (2001) define CSR as “actions that appear to further some social good, beyond the interests of the firm and that which is required by law” and hence, there are CSR resources and outputs in which firms aims at maximizing their profit through adopting CSR activities. Additionally, CSR is “the integration of business operations and values, whereby the interests of all stakeholders including investors, customers, employees, and the environment are reflected in the company’s policies and actions” (CSRwire, 2003). In this view, CSR is defined as strategic and operational activities that a firm undertakes to creates links with its various stakeholders and the environment (Waddock, 2004). Hence, firms are not responsible to address the demand of society as a whole but require to fulfil the need of individuals or group who directly or indirectly influence, or influenced by, their activities (Maignan & Ferrell, 2001). Porter and Kramer (2002) asserted that creating a corporate social agenda, an explicit and affirmative plan, must be responsive to stakeholders and strategic CSR, which then bring about greatest business benefits. Such benefits are the outcome of competitive advantages as a result of CSR compliance. Therefore, stakeholder theory is viewed as an essential phenomenon in operationalizing the CSR (Matten, Crane & Chapple, 2003). In fact, the stakeholder theory, through addressing morals and values in strategic management of an organization, supports the notion of performance improvement of a firm through the competitive advantages that a CSR firm possesses as compared to a non-CSR firm.
As pointed by Surroca et al. (2010), resource-based view (RBV) explains the differences in firm’s performance through distinct attributes of firm’s resources, in particular intangibles, because intangibles are hardly imitable by competitors. More specifically, RBV postulates that the competitive advantages as a result of rare organizational resources results in performance improvements (Barney, 1991). In this line, past studies applying RBV found that intangible resources improve other means of corporate performance, such as sustainable development (Bansal, 2005) or environmental performance (Klassen & Whybark, 1999). Based on natural RBV, proposed by Hart (1995) and confirmed by Sharma and Vredenburg (1998), firm’s environmental and social aspects could lead to intangible resources, and therefore, create competitive advantages. To this end, RBV could be an appropriate theoretical understanding on the possible missing link between CSR and corporate performance, proposed by Surroca et al. (2010) , because, first, RBV focuses on performance strongly as the key outcome variable, and second, RBV clearly identifies the concept of intangible resources as the source of competitive advantage (Russo & Fouts, 1997).
McWilliams and Siegel (2000) examine the relationship between CSR and financial performance and argue that the inconsistent results of prior studies are because important determinants of profitability like research and development (R&D) are omitted from their models. Simpson and Kohers (2002) investigate the relationship between CSR and financial performance. The most significant contribution of their study is the empirical analysis of a sample of companies from the banking industry and the use of Community Reinvestment Act ratings as a social performance measure. The empirical analysis finds a positive link between social and financial performance. Using a sample of 289 firms in the U.S. from 1991 to 2004, Scholtens (2008) analyzes the interaction between CSR and financial performance. The study employs two different test methods, namely lagged OLS and Granger causation, and the results show a positive and significant relationship between financial and social performance.
Becchetti and Trovato (2011) analyze CSR and firm efficiency with a latent class stochastic frontier approach. The empirical results show that firms included in the Domini 400 index (a CSR stock market index) did not appear to be more distant from the production frontier than firms in the control sample, after controlling for the heterogeneity of production structures. The results show that adoption of CSR practices does not significantly reduce firm efficiency.
As discussed earlier, prior studies have reported a wide range of contradicting results on the links between CSR and financial performance. To elaborate, one can find studies that conclude a positive relationship between CSR and financial performance (for example, Erhemjamts et al., 2012; Jo & Harjoto, 2011), while finding studies that document a negative relationship (Wright & Ferris, 1997). Another line of finding is that prior studies report indirect or no linkage (for example, McWilliams & Siegel, 2000; Surroca et al., 2010).
The inconsistent results of the above mentioned research may be due in part to the use of inappropriate models and different samples, dissimilarities in the characteristics of the industries and differences in research methods, or the authors may have overlooked a number of variables in their models. Margolis and Walsh (2003) and Orlitzky, Schmidt and Rynes (2003) argue that the wide range of contradictory results on the nature of the relationship between CSR and corporate financial performance found may be in part attributable to a failure to consider such “missing elements” as R&D, advertising, stakeholders’ moral values, or measures of corporate strategy. According to Surroca et al. (2010) , the inconclusive results are due to the omission of the mediating effect of intangibles. They document the effects of a firm’s intangible resources in mediating the relationship between corporate responsibility and financial performance. In other words, the results indicate that there is no direct relationship between corporate responsibility and financial performance, but the effect of CSR is mediated by a firm’s intangible resources.
Recently, Lu, Wang and He (2013) find that the dimensions of CSR, namely corporate governance, social interaction, diversity, environmental performance, and product-related issues affect the efficiency of market value creation, but not the efficiency of profitability. The study by Lu, Wang and Lee (2013) show that social responsibility investment has positive effects on the corporate efficiency of U.S. semiconductor firms. Wang, Lu, Kweh and Lai (2014) also investigate impacts of CSR on efficiency and find that the social ratings dimension in KLD has a significant and positive impact on efficiency. Taken together, CSR is expected to have a positive impact on efficiency. However, as discussed earlier, intangibles might play a mediating role in the relationship between CSR and performance. Therefore, we predict that CSR has a positive impact on efficiency through the mediating effect of intangibles. Drawing upon stakeholder theory and RBV notion, we examine the following hypothesis:
Hypothesis: Intangibles mediate the relationship between CSR and airline’s performance.
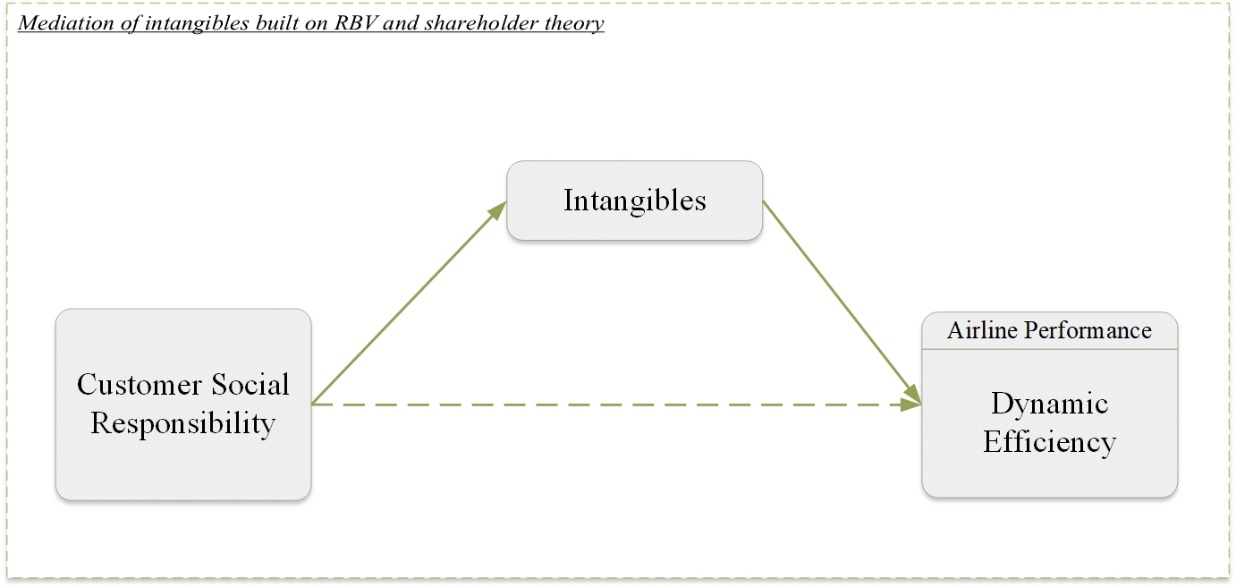
To summarize, studies in the airline industry involving CSR have rarely been conducted. In this study, we attempt to utilize a more comprehensive measure of CSR by considering the seven CSR dimensions in the KLD database. From the perspective of research methods, many previous researchers have used the DEA approach to measure the efficiency of the airline industry. Differing from the previous research, however, this study uses a dynamic DEA model and considers a firm’s carry-over accounts to measure the efficiency of the U.S. airlines. Based on the discussion above and the hypothesis developed in this study, we argue that intangibles mediate the relationship between customer social responsibility and airline efficiency performance. Figure 1 illustrates the research model of this study.
Figure 1. Research model
3 Research design
3.1 Dynamic production process for the airlines
This study investigates the dynamic production process from an operating point of view, and includes consideration of a company’s carry-over accounts. According to accounting principles, each company has an accounting cycle that generates yearly financial statement (Wang, Lu, Kweh, Nourani & Hong, 2019). In the field of accounting, accounts are categorized into nominal or temporary accounts, as well as real or permanent accounts. Carry-over is the concept of permanent accounts.
DEA was first applied by Charnes, Cooper and Rhodes (1978) to measure relative efficiency, and was subsequently extended by Banker, Charnes and Cooper (1984) . The DEA model is a widely utilized technique for such evaluations within a group of decision making units (DMUs), and is often utilized in management literature. It has also been extensively used in a wide range of industries (for example, Botti, Briec & Cliquet, 2009; Lu et al., 2012; Lu, Wang & Kweh, 2014b; Nourani, Chandran, Kweh & Lu, 2018; Nourani, Devadason & Chandran, 2018; Nourani, Ting, Lu & Kweh, 2019; Wang et al., 2014; Wang et al., 2011). Therefore, this study applies the permanent account’s characteristic of carry-over activities in accounting to measure airlines’ long-term operating efficiencies.
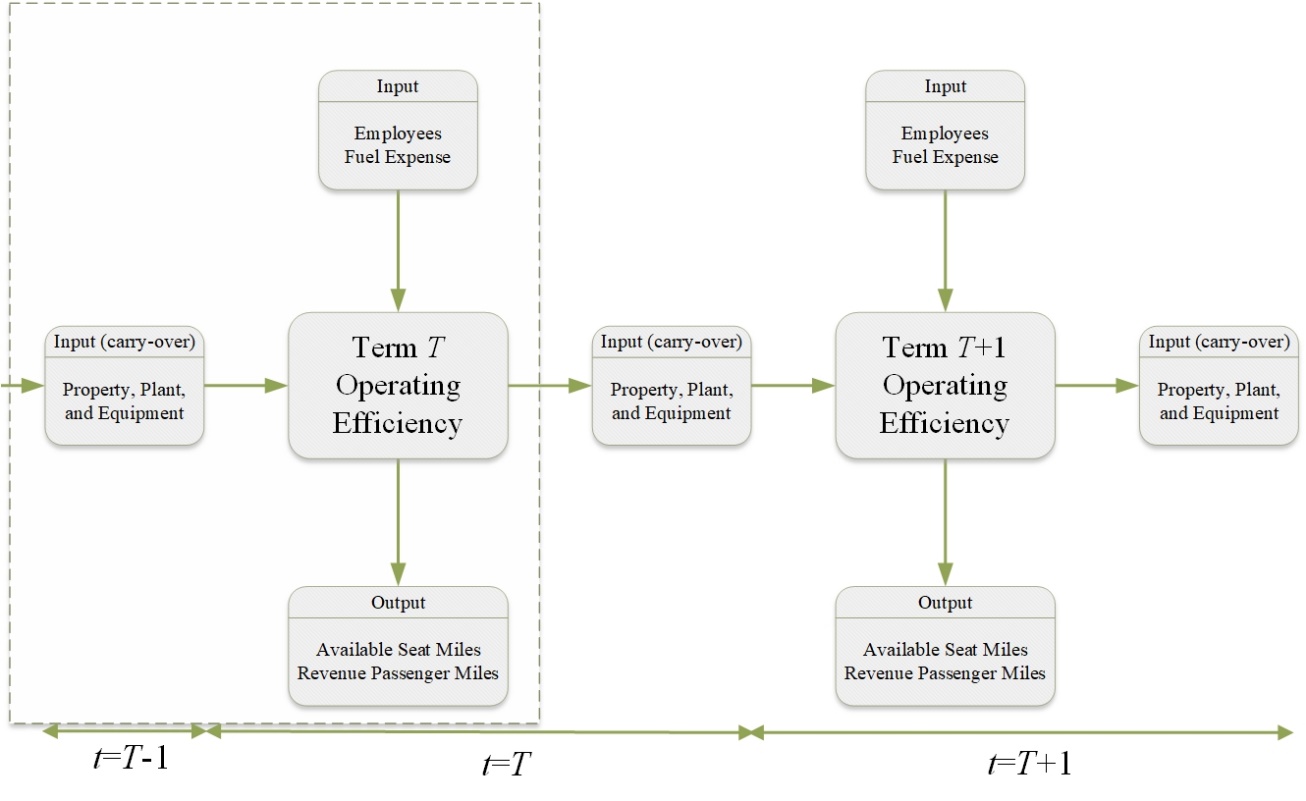
Based on previous studies such as Lu et al. (2012); Wang et al. (2011); Cheng (2010); Barros and Peypoch (2009); Barbot, Costa and Sochirca (2008); Greer (2008) on airline efficiency that employ DEA, this study selects three input variables (Employees, Fuel Expense, and Property, Plant and Equipment), and two output variables (Available Seat Miles, ASMs and Revenue Passenger Miles, RPMs). See Table 1 for a definition of input and output variables. In a financial statement, salary expense, fuel expense, available seat miles and revenue passenger miles are temporary accounts. Cheng (2010) pointed that inputs variables are independent from the market and airlines possess decision making rights. Since the salary expense is difficult to obtain, a number of previous studies (for example, Barbot et al., 2008; Barros & Couto, 2013; Greer, 2008; Lu et al., 2014a) also used the number of employees as an input variable. Following the previous studies, this study uses the number of employees as a proxy for salary expense. Therefore, the number of employees, fuel expense, available seat miles and revenue passenger miles as input/output variables are not considered carry-over activities in this study. The dynamic production process for the airline industry is shown in Figure 2.
Table 1. Definition of input and output variables in the dynamic DEA model
| Variables | Description | Carry-over |
|---|---|---|
| Input variable: | ||
| Employees (EMP) | The number of active full-time and part-time employee (thousands). | N |
| Fuel Expense (AIRTFX) | The total fuel expense incurred during the current period ($ millions). | N |
| Input variable (carry-over): | ||
| Property, Plant and Equipment (PPEt-1) | The cost, less accumulated depreciation, of tangible fixed property used in the production of revenue ($ millions). | Y |
| Output variable: | ||
| Available Seat Miles (ASMs) | The number of seat miles available for passengers (thousands). | N |
| Revenue Passenger Miles (RPMs) | The number of miles flown by revenue passengers (thousands). | N |
Figure 2. Dynamic production process for the airline industry
3.2 Data collection
To evaluate the operating performance of airlines in the U.S., this study first obtains financial data from the Compustat database and annual financial reports. Over the sample period 2006-2014, we identify different numbers of airlines that are with SIC code of 4512 in each year due to mergers. After 2012, 28 airlines make up the population. However, as airlines with missing data for efficiency measurement during the sample period are eliminated, and to ensure balanced panel data for the DEA purpose, our final sample consists of only 22 airlines. These airlines’ total assets account for about 74 percent of the total assets of all airlines, indicating that the final sample utilized in this study is sufficient to represent the U.S. airline industry. Next, we match the CSR data obtained from the KLD database with variables from the Compustat database. Due to unavailability of CSR data, we only retain airlines that are included in the KLD database (as noted earlier in the introduction section, we call these airlines as CSR airlines). The final sample consists of 85 firm-year observations over the sample period for regression analysis.
KLD index that characterizes a firm’s CSR implementation under several dimensions has been used in a number of studies (for example, Lockett, Moon & Visser, 2006; Wang et al., 2017; Yu & Chen, 2011). The dimensions include community, corporate governance, diversity, employee relations, environment, human rights, and products. Through more than 280 data points, both strengths (positive values) and concerns (negative values) for each dimension are captured. The strengths suggest that a firm performs some socially responsible actions that may have positive effects on society, and the concerns imply that a firm’s actions may result in negative effects for society. For example, the community dimension includes strengths, such as generous giving or support for local education (positive values), as well as concerns, such as investment controversies or a negative economic impact on the community (negative values). Following the approach of Siegel and Vitaliano (2007) , we sum up the strengths and concerns of the seven dimensions to proxy for CSR in the airlines for our regression analysis. The definition of each dimension is presented in Table 2.
Table 2. Definitions of KLD dimensions
| Quantitative dimension | Definition | Positive score index (Strength) | Negative score index (Concern) | Community (COM) | The acts of donating to charities and establishing a relationship with the community. | Generous giving Innovative giving Support for housing Support for education Non-U.S. charitable giving Volunteer programs Other strengths | Investment controversies Negative economic impact Tax disputes Other concerns |
|---|---|---|---|
| Corporate governance (CGOV) | Regulations that connect the financial report and the structure of a corporation. | Limited compensation Ownership strength Transparency strength Political accountability strength Other strengths | High Compensation Ownership concerns Accounting concerns Transparency concerns Political accountability concerns Other concerns |
| Diversity (DIV) | Active promotion of minorities and women to top managerial positions and membership on the board of directors. | CEO Promotion Board of directors Family benefits Women/minority contracting Employment of the disabled Progressive gay/lesbian policies Other strengths | Controversies Non-representation Other concerns |
| Employee relations (EMP) | Concerning issues of workplace safety, labor welfare programs, and meaningful profit-sharing plans. | Union relations strength No layoff policy Cash profit sharing Employee involvement Retirement benefits strength Health and safety strength Other strengths | Union relations concerns Health and safety concerns Workforce reductions Retirement benefits concerns Other concerns |
| Environment (ENV) | Relating to pollution prevention programs, donations to conservation organizations and demonstration of concern for the environment in day-to-day operations. | Beneficial products & services Pollution prevention Recycling Alternative fuels Property, plant, and equipment Other strengths | Hazardous waste Regulatory problems Ozone depleting chemicals Substantial emissions Agricultural chemicals Climate change Other concerns |
| Human rights (HUM) | Active promotion of employees’ “rights and protection, the rights of people of color and minority groups” and protection of work opportunities. | Positive operations in South Africa Good relations with indigenous peoples Labor rights strength Other strengths | Concerns about South Africa, Northern Ireland, Burma and/or Mexico Labor rights concerns Poor relations with indigenous peoples Other concerns |
| Product (PRO) | Active promotion of product safety, marketing, and quality assurance. | Quality R&D/innovation Benefits to economically disadvantaged Other strengths | Product safety Marketing/contracting Antitrust Other concerns |
Source: KLD database
Table 3 present the descriptive statistics for input and output variables used in the dynamic DEA during 2006 to 2014. In the sample period, the means of employees was 34,700 people, fuel expenses were USD 3,194.71 million, property, plant and equipment were USD 7,387.53 million, available seat miles was 73,264,228.58, and revenue passenger miles was 58,818,286.42. Based on minimum and maximum values, the input and output variables of the airline industry vary significantly between airlines during the period from 2006 to 2014. In addition, the high standard deviation implies that our sample airlines varied in terms of firm characteristics.
Table 3. Descriptive statistics for the 22 airline companies
| Variables | Mean | Median | Max | Min | Std. Dev. |
|---|---|---|---|---|---|
| Input variable | |||||
| Employees (EMP) | 34.70 | 18.40 | 120.06 | 0.55 | 2.33 |
| Fuel Expense (AIRTFX) | 3,194.71 | 1,772.71 | 13,512.00 | 16.44 | 231.65 |
| Input variable (carry-over) | |||||
| Property, Plant and Equipment (PPEt-1) | 7,387.53 | 5,010.72 | 22,669.77 | 48.60 | 455.76 |
| Output variable | |||||
| Available Seat Miles (ASMs) | 73,264,228.58 | 44,391,494.50 | 265,657,000.00 | 118,996.00 | 4,810,413.21 |
| Revenue Passenger Miles (RPMs) | 58,818,286.42 | 34,993,000.50 | 217,870,000.00 | 54,293.00 | 3,946,169.09 |
Notes:
(a) Number of employees is expressed in thousands.
(b) Fuel expense and property, plant, and equipment are expressed in millions of U.S. dollars.
The untabulated correlation results show that the all correlation coefficients between input and output variables were significant and positive. Therefore, these inputs and outputs show “isotonicity” relations, and are thus appropriate for inclusion in the model (Golany & Roll, 1989). Furthermore, the number of decision-making units (DMUs) should be at least two times the product of the total input and output variables (Dyson et al., 2001). Since this study uses three input variables and two output variables, our sample of 28 airlines (each airline is treated as a DMU) is again sufficient for analysis.
3.3 Measurement of corporate operating performance
There are many approaches – such as accounting-based and market-based measures – to evaluate corporate performance. Accounting-based measures include ROA, returns on equity (ROE), asset growth, operating revenue, etc. Tobin's Q is an example of a market-based measure. In this study, corporate performance is measured by a dynamic DEA model. DEA is a mathematical programming approach that uses multiple inputs and outputs to measure the relative efficiencies of a group of DMUs. The relative efficiency of a DMU is defined as the ratio of multiple weighted outputs to multiple weighted inputs. The merit of DEA is that the weights of input/output factors are not assigned in advance (Chen, 2009).
However, the traditional DEA model does not appropriately evaluate long-term efficiency because it neglects carry-over activities between two consecutive fiscal years and only focuses on a single year (Tone & Tsutsui, 2010). Färe and Grosskopf (1996) are the first to propose a scheme for dealing formally with inter-connecting activities in the dynamic DEA model. Therefore, following the approach of Tone and Tsutsui (2010) , this study applies the undesirable (bad) link category to account for carry-over activities. The variable – property, plant and equipment (PPE) is categorized as belonging to the bad link category that is carried to the next term. In the model, the undesirable (bad) carry-over (link) is treated as input and its value is restricted to being no greater than the observed one. Comparative excess in links in this category is accounted as inefficiency.
The concept of dynamic process in Figure deals with n DMUs (j=1,…,n) over T terms (t=1,…,T). In each term, DMUs have common m inputs (i=1,…,m) and s outputs (r=1,…,s). Let \(x_{ijt}(i=1,...,m)\) and \(y_{rjt}(r=1,...,s)\) denote the observed input and output values of DMU j in term t, respectively. The study labels the category link as \(z^{bad}\). In order to identify them by term (t), DMU (j) and item (i), the study employs, for example, the notation \(z_{kjt}^{bad} \ (k=1,...,nbad; j=1,...,n; t=1,...,T)\) to denote bad link values where nbad is the number of bad links. These are all observed values up to the term T. Using these expressions for production, the study expresses \(DMU_{o} \ (o=1,...,n)\). Therefore, the study defines the output-oriented overall efficiency by solving the following formula as follows:
\[\begin{equation}\label{eq1} \frac{1}{ARE_{o}^{*}} = max\frac{1}{T}\sum_{t=1}^{T}\left [ 1 +\frac{1}{s}\left ( \sum_{r=1}^{s}\frac{s_{rt}^{+}}{y_{rot}} \right ) \right ] \end{equation} \ \ (1)\] \[\begin{equation}\label{eq2} x_{iot} = \sum_{j=1}^{n}x_{ijt} \lambda_{j}^{t} +s_{it}^{-}(i=1,...,m;t=1,...,T) \end{equation} \ \ (2)\] \[\begin{equation}\label{eq3} y_{rot} = \sum_{j=1}^{n}y_{rjt} \lambda_{j}^{t} +s_{rt}^{-}(r=1,...,s;t=1,...,T) \end{equation} \ \ (3)\] \[\begin{equation}\label{eq4} z_{rot}^{bad} = \sum_{j=1}^{n}z_{kjt}^{bad} \lambda_{j}^{t} +s_{kt}^{bad}(k=1,...,nbad;t=1,...,T) \end{equation} \ \ (4)\] \[\begin{equation}\label{eq5} \sum_{j=1}^{n}z_{kjt}^{\alpha} \lambda_{j}^{t} = \sum_{j=1}^{n}z_{kjt}^{\alpha} \lambda_{j}^{t+1}(\forall k; t=1,...,T-1) \end{equation} \ \ (5)\] \[\begin{equation}\label{eq6} \sum_{j=1}^{n} \lambda_{j}^{t} = 1(t=1,...,T) \end{equation} \ \ (6)\] \[\begin{equation*} \lambda_{j}^{t} \geq 0, \ s_{it}^{-} \geq 0, \ s_{rt}^{+}, \ s_{kt}^{bad} \geq 0. \end{equation*}\]
where \(s_{it}^{-}\), \(s_{rt}^{+}\) and \(s_{kt}^{bad}\) are slack variables denoting, respectively, inputs excess, outputs shortfall, and carry-over link excess.
The (1) is the objective function. The restrictions of (2)-(6) make up the production possibility set, whereby (5) ensures that carry-over variables continue from t to t+1, while (6) suggests the assumption of variable returns to scale. \(s_{it}^{-}\), \(s_{rt}^{+}\) and \(s_{kt}^{bad}\) are slack variables of input surplus, output gap, and carry-over gap, respectively (the restrictions of (2)-(3)). While the dividend is mean input efficiency, the divisor is the reversed mean output efficiency.
Let an optimal solution (1) subject to (2)-(6) be \[\begin{equation*} \begin{split} \{ \lambda_{j}^{t^{*}}, j=1,2,...,n;& \ s_{it}^{-^{*}},i=1,...,m; \ s_{rt}^{+^{*}},p=1,...r;\\ & \ s_{kt}^{bad^{*}},k=1,...,g, \ t=1,...,T \}. \end{split} \end{equation*}\]
The output-oriented term efficiency for the objective \(DMU_{o}\) at time t can be defined by
\[\begin{equation}\label{eq7} TE_{o}^{*} = \frac{1}{1 +\frac{1}{s}\left ( \sum_{r=1}^{s}\frac{s_{rt}^{+^{*}}}{y_{rot}} \right )},(t=1,...,T) \end{equation} \ \ (7)\]
This objective function is an extension of the output-oriented slacks-based measure (SBM) model (Tone, 2001) that deals with shortfalls in output products. This study defines the overall efficiency by its reciprocal, the output overall efficiency is between 0 and 1. This objective function value is also units-invariant. If the optimal solution for Equation (1) satisfies \(ATE_{o}^{*}=1\) the observed \(DMU_{o}\) is called output-oriented overall efficient.
If all optimal solutions of Equation (7) satisfy \(TE_{ot}^{*}=1\) the observed \(DMU_{o}\) is called output-oriented term efficient for the term t. This implies that the optimal slacks for term t in Equation (2) are all zero.
4 Analyses and results
4.1 Dynamic efficiency and CSR analysis
Table 4 shows the efficiency scores of the sample airline companies from 2006 to 2014. An airline that is with a score of 1 is relatively efficient; otherwise, one with a score less than 1 is relatively inefficient. The total average efficiency score for all airlines is 0.754, where the annual efficiency scores fluctuate for individual years from 2006 to 2014 with year 2009 having the highest rate among all, being at 0.860. For the period 2006 to 2008, before financial crisis, the lowest efficiency score was that of 2008. The global financial crisis that started in mid-2007 produced severe impacts to the world economy and major financial institutions, and therefore likely caused the decline in most airlines’ performance in 2008. However, after the crisis, the average airline efficiency soared to the highest score in the sample period in 2009. The sudden drop in efficiency score in 2008 and picking up abruptly in 2009 show that the airlines were significantly affected by the financial crisis. In 2011, the average efficiency score was the lowest followed by year 2012.
Table 4. Efficiency of CSR airlines and non-CSR airlines
| Airlines | 2006 | 2007 | 2008 | 2009 | 2010 | 2011 | 2012 | 2013 | 2014 | Overall Score | Rank |
|---|---|---|---|---|---|---|---|---|---|---|---|
| Panel A: CSR | |||||||||||
| ALLEGIANT TRAVEL CO | 1.000 | 1.000 | 1.000 | 1.000 | 1.000 | 1.000 | 1.000 | 1.000 | 1.000 | 1.000 | 1 |
| DELTA AIR LINES INC | 1.000 | 1.000 | 1.000 | 1.000 | 1.000 | 1.000 | 1.000 | 1.000 | 1.000 | 1.000 | 1 |
| REPUBLIC AIRWAYS HOLDINGS, INC. | 1.000 | 1.000 | 1.000 | 1.000 | 1.000 | 1.000 | 1.000 | 1.000 | 1.000 | 1.000 | 1 |
| RYANAIR HOLDINGS PLC | 1.000 | 1.000 | 1.000 | 1.000 | 1.000 | 1.000 | 1.000 | 1.000 | 1.000 | 1.000 | 1 |
| UNITED CONTINENTAL HLDGS INC | 1.000 | 1.000 | 1.000 | 1.000 | 1.000 | 1.000 | 1.000 | 1.000 | 1.000 | 1.000 | 1 |
| HAWAIIAN HOLDINGS INC | 1.000 | 1.000 | 1.000 | 1.000 | 1.000 | 1.000 | 1.000 | 1.000 | 0.775 | 0.975 | 7 |
| SOUTHWEST AIRLINES | 1.000 | 1.000 | 1.000 | 1.000 | 0.782 | 0.773 | 0.753 | 0.997 | 1.000 | 0.916 | 8 |
| AMR CORPORATION | 1.000 | 1.000 | 1.000 | 1.000 | 0.822 | 0.860 | 0.794 | 0.757 | 1.000 | 0.914 | 9 |
| SKYWEST INC | 0.391 | 0.435 | 0.409 | 1.000 | 1.000 | 1.000 | 1.000 | 1.000 | 1.000 | 0.784 | 11 |
| INTL CONSOL AIRLINES GROUP | 0.714 | 0.667 | 0.774 | 0.646 | 0.623 | 0.863 | 0.688 | 0.758 | 0.864 | 0.727 | 12 |
| JETBLUE AIRWAYS CORP | 0.944 | 0.868 | 0.550 | 0.945 | 0.533 | 0.489 | 0.508 | 0.564 | 0.596 | 0.647 | 13 |
| AIR CANADA | 0.714 | 0.760 | 0.688 | 0.764 | 0.611 | 0.515 | 0.475 | 0.527 | 0.560 | 0.625 | 14 |
| COPA HOLDINGS SA | 0.574 | 0.691 | 0.515 | 0.827 | 0.534 | 0.484 | 0.492 | 0.556 | 0.577 | 0.578 | 16 |
| ALASKA AIR GROUP, INC. | 0.664 | 0.596 | 0.428 | 0.949 | 0.512 | 0.483 | 0.487 | 0.561 | 0.603 | 0.573 | 17 |
| DEUTSCHE LUFTHANSA AG | 0.438 | 0.443 | 0.574 | 0.551 | 0.510 | 0.575 | 0.529 | 0.578 | 0.680 | 0.538 | 19 |
| Average Efficiency Score | 0.829 | 0.831 | 0.796 | 0.912 | 0.795 | 0.803 | 0.782 | 0.820 | 0.844 | 0.818 | |
| Panel B : Non-CSR | |||||||||||
| GREAT LAKES AVIATION LTD | 1.000 | 1.000 | 1.000 | 1.000 | 1.000 | 1.000 | 1.000 | 1.000 | 1.000 | 1.000 | 1 |
| AMERICAN AIRLINES INC | 1.000 | 1.000 | 1.000 | 0.966 | 0.801 | 0.743 | 0.683 | 0.783 | 0.846 | 0.868 | 10 |
| WESTJET AIRLINES LTD | 0.533 | 0.649 | 0.546 | 0.855 | 0.546 | 0.539 | 0.534 | 0.593 | 0.598 | 0.595 | 15 |
| CHINA SOUTHERN AIRLINES | 0.535 | 0.587 | 0.573 | 0.731 | 0.487 | 0.527 | 0.464 | 0.580 | 0.641 | 0.569 | 18 |
| CHINA EASTERN AIRLINES CORP | 0.433 | 0.462 | 0.400 | 0.601 | 0.477 | 0.389 | 0.393 | 0.490 | 0.528 | 0.463 | 20 |
| LAN AIRLINES SA | 0.327 | 0.387 | 0.314 | 0.594 | 0.460 | 0.319 | 0.764 | 0.528 | 0.458 | 0.435 | 21 |
| GOL LINHAS AEREAS INTELIGENT | 0.354 | 0.358 | 0.393 | 0.482 | 0.304 | 0.333 | 0.348 | 0.417 | 0.454 | 0.381 | 22 |
| Average Efficiency Score | 0.597 | 0.635 | 0.604 | 0.747 | 0.582 | 0.550 | 0.598 | 0.627 | 0.646 | 0.616 | |
| Total Average Efficiency Score | 0.755 | 0.768 | 0.735 | 0.860 | 0.727 | 0.722 | 0.723 | 0.759 | 0.781 | 0.754 | |
| Mann-Whitney (p-value) | 0.040** | 0.056* | 0.101 | 0.045** | 0.030** | 0.043** | 0.083* | 0.097* | 0.043** | 0.039** | |
Note: Significance levels at the 1% (***), 5% (**), 10% (*) are provided.
In Table 4, we also separate our overall sample of airline companies into two groups, CSR airlines and non-CSR airlines. The CSR airlines are airlines that are included in the KLD database. To determine whether the corporate efficiency of the CSR airlines was higher than that of the non-CSR airlines, a non-parametric statistical analysis (Mann-Whitney test) was used. The results showed that the average efficiency score of CSR airlines (0.818) was higher than that of the non-CSR airlines (average = 0.616; p-value = 0.039). This finding agrees with the theories of Maignan and Ferrell (2001) and Porter and Kramer (2002) , which proposed that CSR strengthen corporate performance, improve brand image, and improve corporate reputation and competitive advantage. The result of the Mann-Whitney test showed significant difference between CSR firms and non-CSR firms except the year 2008.
Table 5. Average CSR scores of CSR airlines
| Airlines | Average CSR Scores | ||
|---|---|---|---|
| Overall | Strengths | Concerns | |
| ALLEGIANT TRAVEL CO | 2.13 | 0.88 | 1.25 |
| DELTA AIR LINES INC | 7.00 | 4.13 | 2.88 |
| REPUBLIC AIRWAYS HLDGS INC | 2.44 | 0.89 | 1.56 |
| RYANAIR HOLDINGS PLC | 5.50 | 3.50 | 2.00 |
| UNITED CONTINENTAL HLDGS INC | 7.00 | 5.00 | 2.00 |
| HAWAIIAN HOLDINGS INC | 1.43 | 0.57 | 0.86 |
| SOUTHWEST AIRLINES | 10.22 | 8.22 | 2.00 |
| AMERICAN AIRLINES GROUP INC | 11.50 | 5.38 | 6.13 |
| SKYWEST INC | 0.56 | 0.11 | 0.44 |
| INTL CONSOL AIRLINES GROUP | 4.00 | 2.50 | 1.50 |
| JETBLUE AIRWAYS CORP | 3.80 | 2.60 | 1.20 |
| AIR CANADA | 5.00 | 2.00 | 3.00 |
| COPA HOLDINGS SA | 3.00 | 1.00 | 2.00 |
| ALASKA AIR GROUP INC | 7.22 | 5.00 | 2.22 |
| DEUTSCHE LUFTHANSA AG | 7.50 | 6.00 | 1.50 |
Table 5 lists the CSR scores for each airline. The table provides the average of strengths, concerns, and the overall (sum of strengths and concerns) for CSR airlines in the sample period. American Airlines Group Inc. and Southwest Airlines received the highest overall score among all the CSR airlines. On the contrary, Skywest Inc. and Hawaiian Holdings Inc. have implemented CSR dimensions comparatively less. As shown in Figure 3, we employ a radar graph to display the score of each of the dimensions of CSR for each of the nine years examined. The purpose of the “radar graph” is to more clearly show the score for each of the dimensions of CSR. The outer layer of the “radar graph” represents the highest score. This study calculated the scores for each of the seven dimensions of the KLD index for individual airlines by summing the positive (strengths) scores and the negative (concerns) scores in each year.
Figure 3. The score for each dimension of CSR in a “radar graph” format for the period 2006-2014.
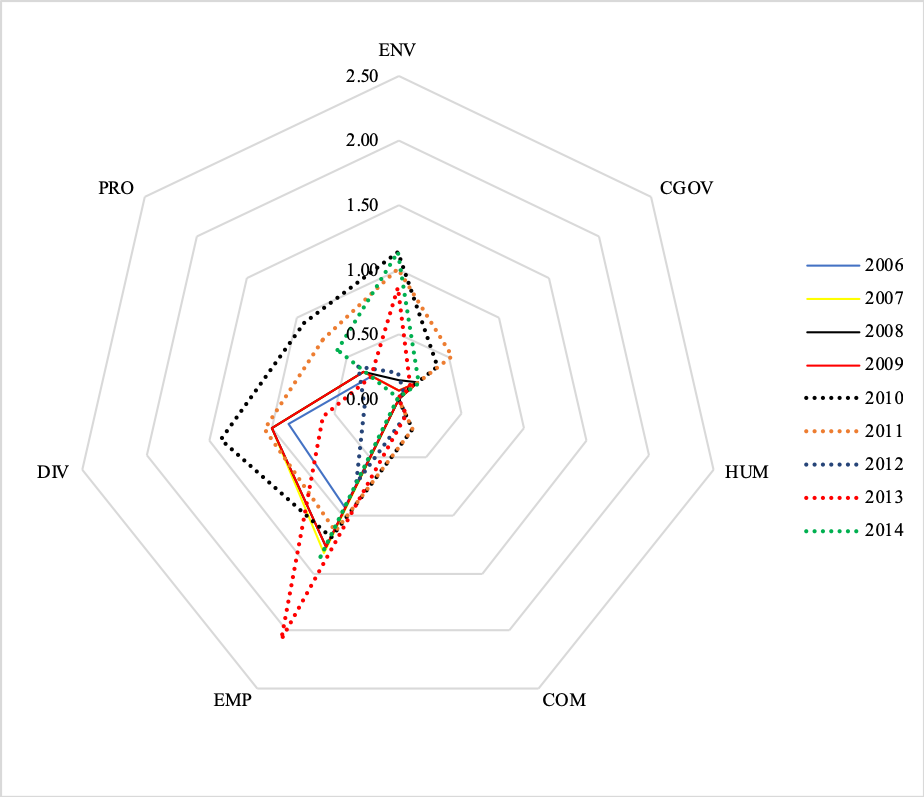
The results, analyzing the level of implementation of each of the seven dimensions of CSR among 15 airlines, indicate that the dimensions of employee relations (EMP) and diversity (DIV) were the most extensively implemented in 2006. The year 2006 scored the second lowest in terms of CSR implementation. In 2007 and 2008, CSR scores improved compared to 2006, and the employee relations (EMP) dimension scored the highest, followed by the diversity (DIV) dimension. These two years have received similar scores for each dimension, and as the result the lines are overlapping. Specifically, the number of airlines that implemented the dimensions of diversity (DIV) and the employee relations (EMP) increased each year from 2006 to 2014. Year 2010 was the best year for CSR implementation in airline industry which is illustrated by wider radar among other years. From 2010 to 2014, despite the higher CSR implementation (wider radar), the trend is decreasing slowly except sharp decline in year 2012; this year recorded the smallest radar in the sample period. The KLD index shows that more airlines practiced the policy by hiring and promoting women or minorities, especially to line positions in 2010-2014 as compared to 2006-2009. In addition, the airlines promoted diverse representation on their boards of directors, outstanding employee benefits and the hiring of disabled, progressive homosexual or bisexual employees. Carroll and Buchholtz (2008) pointed out that corporate attention to women and minorities, represented by the diversity dimension, can be seen as another primary stakeholder issue, given their significant influences on the management and performance of corporations. Kacperczyk (2009) indicate that corporate initiatives in the areas of diversity have positive effects on long-term market-based financial performance and found that dimensions of diversity positively affected future profitability.
The results from 2006 to 2014 show that the airlines implemented CSR on all dimensions except Human rights (HUM), while the level of implementation fluctuated from year to year. Implementation was mainly on the diversity (DIV) and employee relations (EMP) dimensions. Since the airline industry is a service industry, it is expected and important that airlines can improve their reputation by implementing CSR.
4.2 Regression analysis – Corporate social responsibility, intangibles, and dynamic efficiency
In Section 4.1, the univariate analysis shows that the mean efficiency of CSR airlines is higher than that of non-CSR airlines. To ensure the robustness of the preliminary findings, we also perform multivariate regression analysis to evaluate mediation of the effect of CSR on operating performance through intangibles. Our empirical analysis accommodates two main features. First, we use 2SLS with panel data to account for endogeneity. Note that prior studies such as Garcia-Castro, Ariño and Canela (2010) document that endogeneity may exist, in that profitable airlines are and can afford to invest in more CSR activities. In conducting 2SLS with panel data regression analysis, we estimate the following simultaneous equation models:
First-stage equation: \[\begin{equation*} \begin{split} CSRT_{it} =& \ \alpha_{10} + \alpha_{11}EFF_{it} + \alpha_{12}FSIZE_{it} + \alpha_{13}LEVE_{it}\\ &+ \alpha_{14}CAPEX_{it} + \alpha_{15}INVCAP_{it} + \alpha_{16}OCF_{it} + \varepsilon_{1t} \end{split} \end{equation*}\]
Second-stage equation: \[\begin{equation} EFF_{it} = \alpha_{20} + \alpha_{21}CSRT_{it} + \alpha_{22}FSIZE_{it} + \alpha_{23}LEVE_{it} + \varepsilon_{2t}, \end{equation} \ \ (8)\]
where \(\alpha_{10}\) and \(\alpha_{20}\) represent the intercepts, \(\varepsilon_{1t}\) and \(\varepsilon_{1t}\) represent the error terms, \(CSRT_{it}\) is the overall score of KLD ratings data of firm i in year t, \(EFF_{it}\) represents efficiency score of firm i derived from the dynamic DEA model in year t, \(LEVE_{it}\) is the ratio of long-term debt to total assets, \(CAPEX_{it}\) is the ratio of capital expenditure to total assets, \(INVCAP_{it}\) is the ratio of invested capital to total assets, \(OCF_{it}\) is the ratio of operating cash flows to total assets. In Table , we present the results of the 2SLS regression. Although the coefficient of CSR was negative, it did not reach the conventional significance level.
Table 6. 2SLS with panel data regression results (N = 85 firm-year observations)
| Variable | Panel Least Squares | Random-Effect Panel | ||
|---|---|---|---|---|
| Coefficient | p-value | Coefficient | p-value | |
| CSRT | -0.0031 | 0.6271 | -0.0001 | 0.9880 |
| FSIZE | -0.0082 | 0.7089 | -0.0190 | 0.5755 |
| LEVE | -0.0020 | 0.9908 | -0.1867 | 0.3984 |
| OCFTA | -0.2999 | 0.5767 | -0.5367 | 0.1878 |
| R-square | 0.008 | 0.0269 | ||
| F-statistics | 0.169 | 0.5537 | ||
As discussed earlier, such a finding may be spurious with the absence of a mediator. The second feature of our regression analysis is that: Following Surroca et al. (2010) , we include intangibles, which are assets that have no physical existence in themselves but represent rights to enjoy some privilege, as a mediator to examine the indirect relationship between CSR and corporate performance. In this study, we test a mediation model using the method outlined by Preacher and Hayes (2008) . Readers are referred to Preacher and Hayes (2008) for further details on the method. Note also that we use the residual values from the 2SLS regression in the mediation models. See Figure 4 for the illustration and findings.
Figure 4. Illustration and findings of a mediation design
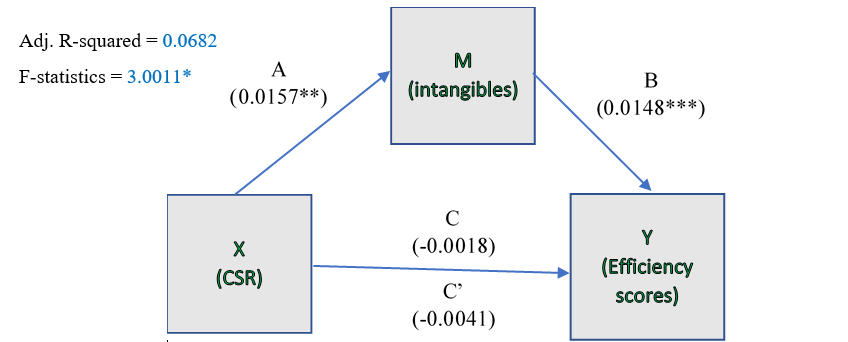
First, in Figure 4, we find that CSR is positively associated with efficiency (coefficient = -0.0018, p-value = 0.3515 – Total effect of IV on DV, C path). This insignificant result once again implies that CSR may have no impact on efficiency. We find that CSR is positively related to intangibles (coefficient = 0.1527, p-value = 0.0358 – IV to Mediator, A path). Third, the results in Figure 3 show that the mediator, intangibles, is positively associated with efficiency (coefficient = 0.0148, p-value = 0.0089 – Direct effect of Mediator on DV, B path). These results confirm the mediating role of intangibles in the relationship between CSR and corporate performance. Furthermore, we test the mediation analysis using the bootstrapping method with bias-corrected confidence estimates (MacKinnon, Lockwood & Williams, 2004). With 5,000 bootstrap resamples, we also obtain the 95% confidence interval of the indirect effects (Preacher & Hayes, 2008), whereby the confidence interval ranges from 0.0001 to 0.0063, confirming the mediation analysis. Note also that the effect of CSR on efficiency decreases when intangibles are included in the model simultaneously with CSR as an explanatory variable of efficiency (coefficient = -0.0041, p-value = 0.1942 – Direct effect of IV on DV, c’ path), suggesting partial mediation.
4.3 Discussion
Previous studies have indicated that the social issues related to competitive advantage may offer the potential to enhance the competitive advantages of enterprises (Porter & Kramer, 2006). CSR has been known as an effective strategy for improving corporate performance and competitive advantages (Porter & Linde, 1995; Ullmann, 1985; Waddock & Graves, 1997). Specifically, CSR activities that cover community, corporate governance, diversity, employee relations, environment, human rights, and products would ultimately enable airlines to have better corporate performance.
The analyses earlier suggest that airlines should engage in CSR activities more actively. For example, they should promote the hiring of minorities and women even for their top managerial positions and membership on their boards of directors. They should also emphasize workplace safety, labor welfare programs, and meaningful profit-sharing plans. Some previous studies suggest that a firm’s emphasis on labor rights and welfare programs would attract better job applicants and help retain qualified employees, and that the company might thereby enjoy a lower rate of turnover, less recruitment, and reduced training costs (Albinger & Freeman, 2000; Turban & Greening, 1997). Berman, Wicks, Kotha, and Jones (1999) indicate that corporate activities enhancing employee relations have a positive effect on firm efficiency. The authors theorized that this is because the implementation of advanced human resource practices allows firms to achieve high productivity, low turnover, decreased absenteeism, and/or increased organizational commitment among employees.
Bhattacharya and Sen (2004) argue that when “doing better at doing good”, it is important for managers to consider CSR initiatives in the light of the firm’s corporate abilities. It is important to remember that for a firm to implement CSR effectively, instantaneous results are not likely to be forthcoming. Long-term results that are more sustainable are the kind of results that are critical to long-term success. Focusing on CSR is essential to long-term success and should not continue to be a missed opportunity in today’s business environment.
In summary, implementing CSR activities must be consistent and persistent. CSR is not only identifiable in corporate charitable contributions, but also in some other actions or policies that do not directly generate profits for shareholders, as it involves the satisfaction of a more complex multi-stakeholder welfare which involves stakeholders, employees, local communities, upstream and downstream firms, and consumers. This positively impacts the company’s brand. Porter and Kramer (2002) argue that this means that not all corporate expenditure will bring a social benefit or that every social benefit will improve competitiveness. Most corporate expenditures produce benefits only for the business, and charitable contributions unrelated to the business generate only social benefits. It is only where corporate expenditures produce simultaneous social and economic gains that corporate philanthropy and shareholder interests converge.
5 Conclusion
This study attempts to understand how the airline industry fits into the current market through an investigation into their operating performance and CSR-related activities. From the perspective of research methods, the efficiency of the airline industry has been widely discussed in previous literature, and the DEA technique has been frequently employed to evaluate efficiency. However, there are still some important points not previously explored. The traditional DEA model does not appropriately evaluate long-term efficiency and neglects carry-over activities from longitudinal view. Therefore, this study adopted a dynamic DEA to evaluate U.S. airlines’ operating efficiency. As a research topic, the issue of CSR in the airline industry has rarely been investigated. The results of this study can provide U.S. airlines insights into the efficiency of their inputs and help them improve strategic decision-making, with the aim of remaining sustainable in today’s highly competitive environment.
The findings can briefly be described as follows. First, the average efficiency of the airlines included in the KLD database is higher than that of the non-CSR airlines. This study further analyzed the level of implementation of CSR for airlines by using a “radar graph” format. The airlines had the highest levels of implementation for the dimensions of employee relations (EMP) and Diversity (DIV). This study also examines mediation of the effect of CSR on the operating performance of the airlines through a mediator, intangibles. The regression analyses indicate that an indirect relationship exists between CSR and operating performance, which relies on the mediating effect of intangibles.
The findings of this study can serve as guidelines for coping with CSR issues in the airline industry and for implementing CSR policies. From the perspective of research, future researchers can use samples of global airlines, or airlines from other countries, or cross-country samples. In terms of research methods, future researchers can employ a dynamic network DEA model to assess firm efficiency. As compared to the conventional DEA, the dynamic network-DEA model is more sensitive in detecting inefficiencies. This study also hopes that the models and methods implemented in this research can help bring about related research in other industries. Finally, we stress that our conclusions might be subject to bias in the sampling method that researchers should be able to improve on. When more data becomes available, matching could be used in the sampling so that one CSR airline and one non-CSR airline is compared on as equal ground as possible. Similarly, subject to data availability in future in the same sample, future studies are encouraged to include other input and output variables in estimating the efficiency analysis.