Migration and social stratification in Spain. A multivariate quantitative approach
Carlos Ruiz-Ramos, Centre for Demographic Studies (CED-CERCA), Barcelona
Andres F. Castro Torres, Centre for Demographic Studies (CED-CERCA), Barcelona
Abstract
Analysing the incorporation patterns of immigrants into host countries is essential for understanding social inequalities in contemporary societies. This study examines the living conditions of immigrants in Spain, moving beyond univariate approaches to social stratification by assessing the interaction among multiple categories of social privilege and disadvantage. As the second-largest recipient of immigrants in Europe, Spain offers valuable insights into the relationship between migration and social inequality. Using Geometric Data Analysis and clustering methods, we provide a structural and multidimensional perspective on social cleavages, revealing segmented assimilation patterns related to housing, employment, and education, influenced by age, origin, and family background. Our findings show heterogeneous configurations of immigrant incorporation also affecting the second-generation, which speaks to the persistence of social stratification forces in Spanish society. This comprehensive analysis offers a nuanced understanding of how various social categories shape the integration of immigrants, shedding light on the complex interplay of factors that influence their experiences in Spain and potentially other European countries with similar immigration trends in recent decades.
Key words: inequality, social stratification, immigration, segmented assimilation, social space
Migración y estratificación social en España. Una aproximación cuantitativa y multivariada
Resumen
El análisis de los patrones de incorporación de la población inmigrante en los países de destino es esencial para comprender las desigualdades sociales en las sociedades contemporáneas. Más allá de las aproximaciones univariadas a la estratificación social, este trabajo analiza las condiciones de vida de la población extranjera en España examinando la interacción entre categorías sociales asociadas a privilegios y desventajas. España se ha convertido en el segundo mayor receptor de población extranjera de Europa, por lo que ofrece una interesante perspectiva a la relación entre inmigración y desigualdad social. Mediante el uso de análisis geométrico de datos y de métodos de conglomerados, aportamos una perspectiva estructural y multidimensional sobre los principales ejes de exclusión, revelando patrones de asimilación segmentada relacionados con el acceso a la vivienda, el empleo y la educación influenciados por la edad, el origen y la clase social. Nuestros resultados muestran también que la llamada “segunda generación” sólo experimenta una asimilación parcial. Este trabajo ofrece una mayor comprensión de cómo la intersección de categorías sociales conforma los procesos de integración de la inmigración, arrojando luz sobre la compleja interacción entre los factores que influencian sus experiencias en España y en otros países europeos con trayectorias inmigratorias recientes similares.
Palabras clave: desigualdad, estatificación social, inmigración, asimilación segmentada, espacio social
Fecha de recepción del original: 30 de septiembre de 2024; version final: 24 de julio de 2025.
Carlos Ruiz-Ramos, Centre for Demographic Studies (CED-CERCA), Barcelona. E-mail: cruiz@ced.uab.es; ORCID ID: https://orcid.org/0000-0002-1482-3249.
Andres F. Castro Torres, Centre for Demographic Studies (CED-CERCA), Barcelona. E-mail: acastro@ced.uab.es; ORCID ID: https://orcid.org/0000-0003-1032-3869.
Migration and social stratification in Spain. A multivariate quantitative approach1
Carlos Ruiz-Ramos, Centre for Demographic Studies (CED-CERCA), Barcelona
Andres Felipe Castro Torres, Centre for Demographic Studies (CED-CERCA), Barcelona
Introduction
Understanding how immigrants integrate into host societies is essential for examining contemporary social inequality (Portes and Zhou 1993; Domingo 2015). Integration is conceptualised as full participation in societal institutions, recognition of rights and duties, and the enjoyment of economic and social benefits stemming from development (Fraser 1998). In the context of European societies, the integration of immigrants entails access to healthcare and education systems, participation in the labour market, housing availability, and freedom of movement. Immigrant communities around the world exhibit diverse patterns across these domains, falling short of what might be considered optimal integration (Castles et al. 2014). As the demographic and economic significance of migration continues to grow for both receiving and sending countries, suboptimal integration will persist in driving social inequalities (Therborn 2013; Canales Cerón 2021).
Macroeconomic dynamics and unequal relations among countries are strong drivers of international mobility and factor into between-nations and within-country social inequalities (Piore 1979; Canales Cerón 2021). In the case of Spain, the growing expenditure capacity among the middle classes and the rise of income and wealth inequalities in origin countries of the recent decades are both part and parcel of increasing immigration (Alonso-Villar and del Río 2013; Prieto et al. 2018; Domingo and Singh-Garha 2022). At the same time, these dynamics factor into segmented assimilation patterns, particularly regarding immigrants from former Spanish colonies in Latin America and geographically close African nations (Bueno and Vidal-Coso 2019; Gastón-Guiu et al. 2021).
In Spain, the foreign-born individuals make up a moderate share of the population, with social and economic profiles that differ significantly from those of immigrant populations in other wealthy countries (Castles et al. 2014). At least 1.5 of every ten people residing in Spain is foreign-born and this fraction can rise to two in certain metropolitan areas, occupations, or among young age groups (Domingo and Bayona-i-Carrasco 2024).
Migration to Spain is very diverse ranging from highly privileged groups, such as high-tech nomads, to socially disadvantaged ones such as food-delivery or domestic service workers (Herrera 2013; Bueno and Vidal-Coso 2019). This variety is often obscured in migration studies under broad labels such as “immigrants,” or national and regional origins (e.g., Latin Americans, Eastern European, EU-citizens, Africans, etc.) (De Haas 2014). Masking heterogeneity under broad categories is not unique to migration studies; it is also common in labour and social stratification research. For example, categories such as “unemployed” or “homeowner” fail to capture the vast socioeconomic differences within these groups. This becomes evident when comparing the living conditions of high-tech immigrants to those of immigrants working in the food delivery sector—two groups with drastically different socioeconomic realities. Likewise, the consequences of unemployment for these groups are not comparable, underscoring the need for a more nuanced analysis that recognizes such disparities rather than assuming homogeneity within broad labels. More generally, a configurational approach to social stratifications departs from the premise that the living circumstances of individuals lay at the intersection of multiple categories; in conjunctures or configurations (Johnson-Hanks et al. 2011 Introduction).
The socially privileged immigrants often hold positions such as expatriates or highly skilled/specialised workers, enjoy access to formal, secured and well-paid employment, and have little if any issue for access housing. The socially disadvantaged immigrants, on the contrary, typically provide essential services such as personal care, cleaning, and domestic work often under informal conditions which in turn limit their rights, income, and access to housing (Herrera 2013). This diversity depends on and likely reinforces existing social inequalities.
Against this background, our work aims to measure the distinct configurations of privilege and disadvantage among native- and foreign-born adults in contemporary Spain through clustering variables and individuals using nationally representative quantitative data of the adult Spanish population. We use these clusters to characterise contemporary Spanish society and to examine how foreign-born, second-migrant-generation, and native adults integrate and fare within the Spanish stratification system. Our work draws inspiration from the Bourdieusian tradition, which emphasizes analysing social phenomena as practices embedded within social spaces (Lebaron and Le Roux 2015).
More specifically, we utilise data from the 2021 Spanish Survey of Essential Living Conditions and Housing (ECEPOV) to map immigrants’ positions within the Spanish social space at different stages of their life. These positions, and their relationships relative to the native-born population, highlight the structural dimensions of immigrants’ incorporation into Spanish society. We measure the social space by combining information on educational attainment, occupation, income, housing access, multiple real estate properties, geographical location, and parental educational background. We correlate this social space with the age and country and region of birth of individuals to understand how life course and migration dynamics relate to stratification.
We then employ clustering methods to identify clusters of material living conditions among working-age adults, grouped by ten-year age groups: 20s, 30s, 40s, 50s, and 60 to 65 (60s hereafter). These clusters range from highly privileged configurations, where economic, social, and familial advantages coincide, to highly disadvantaged configurations, where most or all socially disadvantaged categories and outcomes converge. Finally, we measure the proportion of immigrants, categorised by region of origin, and the proportion of native-born according to the parental place of birth, within each of these clusters.
Our results serve to argue that unidimensional analyses of the incorporation of immigrants overlook critical features for understanding the social and economic consequences of migration. Our structural and multidimensional approach reveals not only the confluence of multiple social disadvantages among most immigrant population, but also the often-overlooked disadvantages and deprivations among certain native-born segments, and the privilege and comfort that some foreign-born groups experience, which is even less frequently acknowledged.
The relevance of international migration for societies has to do with the potential multiplicative nature of migration in a context of enhanced physical mobility and connectivity (Canales Cerón 2021). Immigrants today do not leave their life behind, or at least they have the possibility not to do so. When they move, immigrants carry their culture and traditions along with their social and economic resources. In addition, increased mobility creates a connection between origins and destinations, a connection with economic, social, and political implications.
Emigration and immigration in contemporary Spain
In recent decades, Spanish society has undergone profound social, economic, and demographic transformations (Esping-Andersen et al. 2013; Martín-García 2013; Harrison and Corkill 2016). During the 20th century, Spain transitioned from being a “country of emigrants” to becoming the second-largest recipient of immigrants in Europe (Van Mol and de Valk 2016). In the early 1900s, the underdeveloped economy of Spain was unable to absorb the country’s growing population, prompting about 5.5 million Spaniards towards the Americas. Similarly, the 1960s were characterised by the emigration of 1.5 million people from rural areas to the industrialised economies of Central and Northern Europe, mainly France, Germany and Switzerland. This wave of emigration was halted by the oil crisis of the mid-1970s (Alonso Pérez and Furio Blasco 2007).
However, the colonial history of the country and its robust economic growth during the 1990s and early 2000s triggered one of the largest migratory processes in contemporary Europe (Cebrián Villar 2009). Between 1998 and 2008, Spain attracted over 5 million immigrants, raising the proportion of the foreign-born population from 1.1% to 11.0%. After the 2008-2013 economic crisis, which temporarily undermined immigration rates, immigration continued to increase, reaching 7.5 million immigrants by 2024, accounting for 18.2% of the total population according to the Spanish National Bureau of Statistics (Instituto Nacional de Estadística). As a result, Spain absorbed one-third of the immigrant population within the European Union during the last 25 years, primarily drawing individuals from Latin America, the Caribbean, Northern Africa, and Eastern Europe.
The arrival of people to Spain has not been stable throughout the two first decades of the century. We find three clear stages that mirror the economic cycle of Spain. The economic expansion of the period 1996-2008 led to rapid increases of international immigration, peaking at 958,266 arrivals in 2007. The Great Recession reversed this trend, reducing the inflow of immigrants, and fostering the emergence of returning and re-emigration processes, and, to a lesser extent, the emigration of natives to countries less affected by the economic crisis (Domingo and Blanes 2015; Prieto et al. 2018). The last stage corresponds to the recovery of the Spanish economy. From 2015 to 2020 Spain experienced a new immigration boom that peaked in 2019 with a net inflow of half million immigrants, before the onset of the COVID-19 pandemic (Bayona-i-Carrasco and Domingo 2024).
Two of the main drivers of migration processes are the development differentials and the economic cycle, emphasizing the role of social inequalities both within and between countries (Arango 2003; Cebrián Villar 2009). Inequalities between countries arise from long standing economic dependencies between Western (former coloniser) countries and non-Western nations, which have contributed to the underdevelopment of the latter (Hickel et al. 2024). These unequal relationships continue to persist, creating a set of migration and non-migration drivers that align with macroeconomic cycles (Carling 2002; De Haas 2014). For instance, during periods of economic expansion in wealthier countries, labour demand tends to increase, particularly in sectors that no longer attract domestic workers, such as construction and domestic care (Moya 2007). As a result, labour demand intensifies, and between-countries wage disparities become more prominent as pull factors for migrants (Piore 1979).
Migration-related costs exclude by default the poorest people in sending countries, making migration flows relatively selective with respect to the economic resources and educational background of migrants (Fussell 2010). Similarly, within-country inequalities in Spain are linked the urban-rural divide. Economic transformations such as tertiarization have favoured urban settings, leaving the rural population in a relatively disadvantaged position. Consequently, as migration evolves in tandem with persisting social inequalities in the host country, receiving areas become more diverse in terms of national and sub-national origins, and the labour market tends to become segmented, reflecting and reproducing social inequalities (Alonso Pérez and Furio Blasco 2007).
Immigrants in the Spanish social space
The integration of Spain into the European Economic Community (EEC) and the adoption of the Euro brought about significant economic shifts. Research by Moreno and Bruquetas (2012) reveals that Spain created nearly 8 million jobs between 1996 and 2007. During this period, the country reoriented its economic structure towards low-productivity and low-value-added sectors such as tourism and construction, while experiencing a process of deindustrialization. The growth of low-skilled labour demand coincided with a rapid rise in the education level among Spanish younger generations (Alonso Pérez and Furio Blasco 2007). As a result, the increasing labour opportunities in elementary occupations, coupled with wage differentials between Spain and the Global South countries, attracting immigrants with lower average educational levels compared to other OECD countries (Arslan et al. 2015). Immigrants in Spain primarily found employment in sectors with high labour demand, such as domestic work, agriculture, and construction—jobs that were often avoided by native workers. Consequently, foreign-born populations were largely confined to precarious jobs, leading to a dual labour market segregated by origin and gender (Moreno and Bruquetas 2012; Domingo and Bayona-i-Carrasco 2024).
The concentration of immigrants in vulnerable sectors made them particularly susceptible to job losses during the Great Recession. Between 2008 and 2013, foreign-born workers were disproportionately affected by the destruction of 2.9 million jobs. In fact, one third of foreign-born workers lost their job in this period. Thus, the economic crisis exacerbated the structural inequalities that characterise the Spanish labour market, consolidating immigrants’ higher unemployment rates and greater prevalence of fixed-term and part-time contracts. In this regard, research has shown that structural inequalities between natives and immigrants in the Spanish labour market cannot be fully explained by education level, sector or occupation, suggesting that ethnic discrimination plays a central role in driving foreign-born modes of incorporation into the Spanish economy (Mooi-Reci and Muñoz-Comet 2016; Gastón-Guiu et al. 2021).
The occupational segregation of migrant workers and their ethnic discrimination limit their horizontal (i.e. between sectors) and vertical (i.e. between occupations) mobility (Fernández-Macías et al. 2015), exposing them to greater social vulnerability. This “sticky floor” effect challenges the narrative of a progressive incorporation into the receiving society, as immigrant workers encounter significant barriers to gradually improve their socioeconomic status (Gastón-Guiu et al. 2021, 2024). Additionally, the concentration of different national groups in specific economic sectors reinforces the pattern of segmented assimilation among immigrant populations (Portes and Zhou 1993).
The relatively recent nature of immigration to Spain poses some challenges for studying the descendants of immigrants, often referred to as the “second generation.” Only recently, data availability has allowed scholars to analyse their educational and labour outcomes in comparison to both immigrants and natives (Aparicio and Portes 2014; González Ferrer and Cebolla-Boado 2018; Portes et al. 2018; Bayona-i-Carrasco et al. 2020; Rodríguez et al. 2021; Bayona-i-Carrasco and Domingo 2024).
Literature on the second generation has found differing outcomes with respect to natives, but also to immigrants from the country of birth of the parents. While second-generation migrants tend to perform better educationally and in the labour market than first-generation immigrants, they still face significant gaps compared to native Spaniards. The second generation shows higher rates of academic failure and unemployment, as well as lower levels of tertiary education (Bayona-i-Carrasco and Domingo 2024). Portes and colleagues (2018) attribute these challenges to the low socioeconomic status of their parents, but also to persistent discriminatory practices within Spanish society.
A social space perspective into the incorporation of immigrants brings together both contextual factors such as macroeconomic conditions and inequalities, and individual-level conditions such as immigrant’s demographic, socioeconomic and occupational profiles. These macro and micro-level factors shape contemporary societies in manners that escape single-variable analysis such as looking at differences in educational attainment or labour market outcomes separately. In the following section we describe the data and methods we used to operationalize this perspective and produce empirical evidence for Spain.
With over 300,000 individual records, the 2021 Spanish “Encuesta de Características Esenciales de la Población y Viviendas - ECEPOV” (Survey of Essential Characteristics of the Population and Housing) is the largest nationally representative survey of sociodemographic and economic conditions (Instituto Nacional de Estadística 2021). This large sample size allows for the study of immigrant groups from different origins, and the comprehensive questionnaire makes it a unique source for the investigation of demographic, and socioeconomic dynamics within Spain.
We focus on individuals aged 20 to 64 (n = 223,568). The population within this age range provides a good representation of those contributing to the Spanish economy. We explore differences across 10-year age groups and across individuals’ regions of birth. Among Spanish-born individuals, we distinguish between those with foreign-born parents (Second generation hereafter) and those born to two Spanish-born individuals. The region of birth groups comprises the following categories: Africa; Asia and Europe (excluding European Union countries); European Union (EU); Latin America and the Caribbean (LaCar); Spain; and Spain second generation (Spain-SG).
Table 1 displays the percentage distribution of the analytical sample by age group across the seven social space variables: Educational attainment, Tenure status, Household income, Occupation, Urbanization, Parental educational attainment, Multiple real estate holdings. We input these variables into a Multiple Correspondence Analysis (MCA) and retained the first three factorial axes for further analysis including the clustering. Factorial axes are numerical individual-level variables that summarize the main differences and disparities across socioeconomic and occupational profiles. All our analyses use sampling weights, and we pay particular attention when interpreting results for groups with small cell counts. When appropriate, we report standard error as a measure of the reliability of the estimates. The relative contribution of the categories to the variance of the first three axes is reported in Table A1 in the appendix.
Existing correlations among these seven variables are the basis for measuring typical living circumstances and strategies across groups of people. For example, typically, individuals from rich families have early access to homeownership due to inheritances or inter vivos gifts, high educational attainment, and well-paid occupations (León et al. 2024). The reverse is true about individuals from socially disadvantaged families. The particularities of the Spanish society with respect to homeownership and employment have created groups of “insiders” and “outsiders” that have benefited from and suffered the consequences of the Spanish economic model, respectively (Blavier 2023). Moreover, beyond cumulative categories of social privileges or disadvantages, we aim to detect complex interactions between the two, providing a nuanced perspective on contemporary structure of inequalities in Spain.
We rely on a global MCA on the seven above-mentioned variables to empirically measure the multivariate correlations among them via factorial axes (Le Roux and Rouanet 2004; Lebaron 2009). Given the MCA properties, the first three MCA-axes capture the main cleavages across educational, housing, income, wealth, occupational and intergenerational resources. The MCA is global as it includes all age groups. We implement MCA using the R-packages ade4 and FactoMineR (Dray and Dufour 2007; Lê et al. 2008).
Our main assumption is that the experiences of individuals are shaped and constructed by the combination of these variables at different times during the life course, from early to late adulthood. For example, the population size of the municipality in which individuals reside captures geographical disparities in employment opportunities and historical development gaps between Spanish urban and rural areas, adding to the individual-level socioeconomic and occupational profile provided by the other variables. Adding variables that go beyond the individual-level characteristics, and collecting information at the geographic- and household-level allows us to better capture the available resources and the structure of opportunities of individuals and population groups.
Thus, divergent socioeconomic and occupational profiles among the young adult population underline the existence of current social inequalities, for example for accessing education, rapidly acquiring housing or employment. By the same token, divergent profiles among older adults reflect cumulative inequalities over the life course shaped by past opportunities among older generations. Together, the socioeconomic and occupational profiles of younger and older adults constitute the Spanish social space, i.e., metaphorically, the set of social positioning of individuals within the Spanish society (Bourdieu 1996).
Table 1. Weighted sample distribution by age group
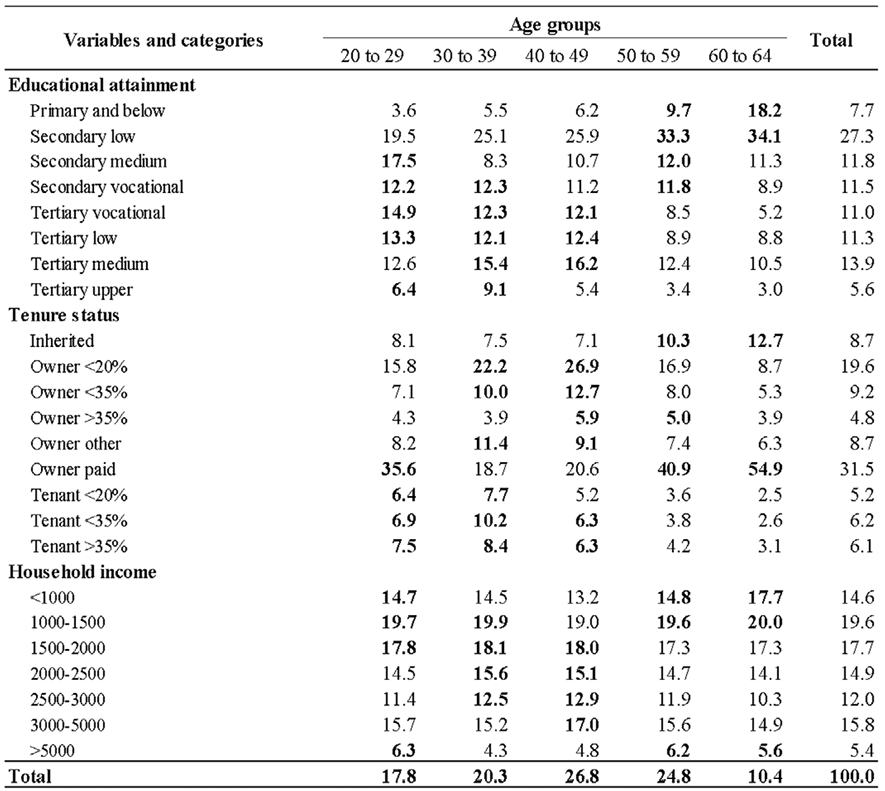
Source: Own work based on the Encuesta de Características Esenciales de la Población y Viviendas – 2021.
Table 1 (cont.)
Note: The category “Asia and Europe” includes all Asian, Oceanic and non-EU countries.
Source: Own work based on the Encuesta de Características Esenciales de la Población y Viviendas – 2021.
Next, we conduct six age-group-specific cluster analyses to identify individuals with similar characteristics and living conditions. We rely on 10-year age groups to favour comparability across individuals, and we set to six the number of clusters for all age groups. This predefined number of clusters favour comparability across age groups. The cluster analyses were conducted in two steps. First, we implement a hierarchical clustering via the Ward method, followed by a cluster consolidation via the K-means algorithm using the hclust and WeightedCluster R-packages, respectively (Studer 2013; R Core Team 2017). We assess the robustness of the six-clusters solution implementing a Homogeneity test. Finally, following Bourdieu (2005 Introduction), we call these clusters probable social classes.
In a society with marked socioeconomic patterns of family formation dynamics a configurational approach that relies jointly on individual-, household- and geographic-level variables to measure social stratification is likely to obscure the gender dimension of social inequalities. Our probable social classes are likely grouping men and women in uniform proportions (50/50) despite known and pervasive gender differences across several socioeconomic outcomes because of the shared resources implied in household- and geographic-level variables, and because of strong educational and socioeconomic homogamy. By no means this implies that gender differences are unimportant. We refer to how they can be observed in some of the probable social classes in the results section.
To analyse the migration-stratification link, we use the interaction between age groups and region of birth as a supplementary variable within the MCA. When projected onto factorial axes, supplementary variables capture the multivariate influence of active variables on supplementary categories (Pardo 2020). The relative location of age and origin groups along the factorial axes indicate their differing modes of incorporation into the social space.
We contrast these results with a cross-tabulation of probable social classes and regions of origin to refine our understanding of how origin influences the incorporation of immigrants. This approach allows us to identify more nuanced forms of incorporation that go beyond what can be captured by single-variable analyses, highlighting the complex interplay between social stratification and origin in shaping immigrants’ integration experiences, and ultimately, the Spanish social stratification structure.
Social Cleavages and Patterns of Stratification in Contemporary Spain
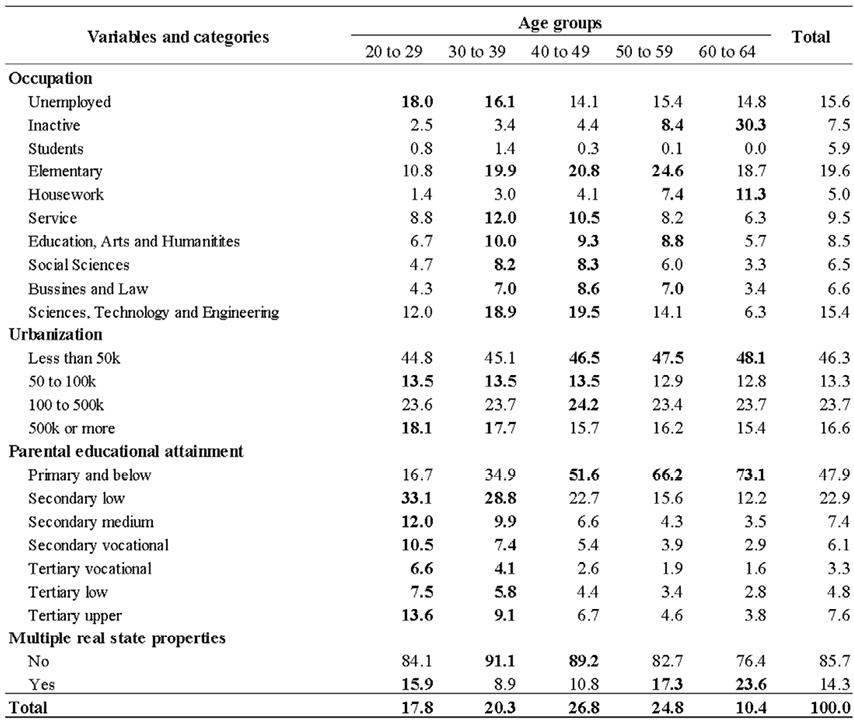
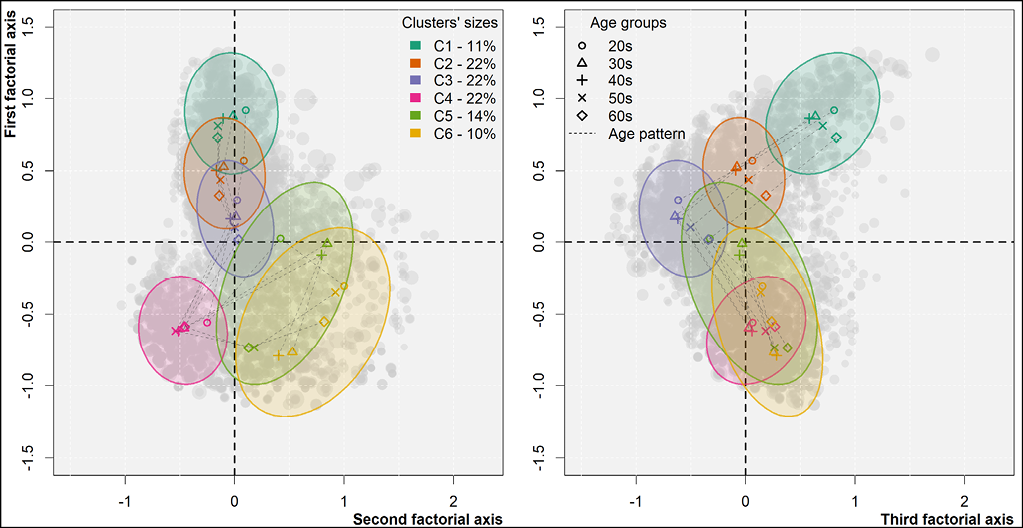
Figure 1 displays the three-dimensional Spanish social space and the top contributing categories to the first and second axes (left panel) and to the first and third axes (right panel). Together, these three axes account for 64.1% of the total inertia.
Figure 1. The Spanish social space. Distribution of top 50%-contributing categories across the first three factorial axes. Left panel: First and second axes. Right panel: First and third axes.
Note: Table A1 in the appendix shows the relative contribution of the categories to the first three axes.
Source: Own work based on the Encuesta de Características Esenciales de la Población y Viviendas – 2021.
Each point in the social space represents the mean position of the individuals with a shared characteristic (e.g. unemployed), providing a visual representation of the variables’ correlation in Spanish society. For example, an individual located at the higher end of the plot will be characterised by the confluence of categories of social advantage like high education level (TertUpp), high parental education level (TertUpp), qualified occupation, and high income (3,000 to 5,000€ and >5,000€ per month). Likewise, there is virtually no unemployment or high financial burden due to rent or housing loans at the higher end of the social space.
Thus, according to Figure 1, the first factorial axis (vertical) places individuals on a socioeconomic gradient that increases from the bottom to the top. In the lowest part of axis 1, we find individuals with low educational attainment —primarily those with no formal education, primary schooling, or early stages of secondary education—, whose parents have also reached low education credentials. This group is further characterised by being employed in elementary occupations (or unemployed) and having low-income levels. As previously mentioned, towards the top of axis 1, markers of social privilege become more prominent. Here, we find individuals with higher levels of education and income, and employed in qualified occupations, coupled with the inheritance of cultural capital from their parents. Respondents who declare having more than one real estate property also tend to concentrate towards the higher end of the axis. This pattern aligns with findings from various national contexts, where the first factorial axis often represents the overall volume of capital (Branson et al. 2024; Atkinson and Schmitz 2024).
Homeownership and household income are the two most contributing variables to the second factorial axis. This second factorial axis captures how individuals access to housing and their dwelling conditions. On the right-hand side we find individuals facing high economic burdens to pay for housing, irrespective of their tenure status, i.e., renters and owners using more than 35% of their income to pay for housing. These include low-income groups and unemployed individuals, but also students, signalling the generational and migration divide hindering the access to the housing market in contemporary Spain (Lebrusán Murillo 2023; Delclós 2023). In contrast, on the left-hand side, we find homeowners whose higher incomes allow them to spend less than 35% of their earnings on housing.
The third axis introduces further distinctions among probable social classes. The upper-right and lower-right areas of the plot represent socially privileged and socially disadvantaged classes, respectively. The middle classes gravitate around the centre and centre-left areas. A detailed inspection of the cloud of categories reveals that individuals located at the centre and the upper-right quadrant, i.e. those with high and middle income and education levels with educated parents, face lower financial burdens for accessing housing and are the so called “insiders”, a concept also associated with older age groups who accessed to the housing market before the start of the housing bubble (Bentolila et al. 2012; Arundel and Lennartz 2020). At the centre left we find younger middle classes with intermediate education and income levels dealing with high housing prices and facing difficulties in becoming “insiders”.
Finally, the bottom-right quadrant comprises the “excluded” populations of the Spanish development model. Those with the highest unemployment rates, and the lowest income levels who use a high share of their income for accessing a dwelling.
To sum up, the Spanish social space exhibits an upper-right quadrant that clusters together younger age groups of highly educated individuals who typically have highly educated parents and reside in large urban areas. The proximity of students to the upper social classes indicates that young individuals still reside with their parents, while their position towards the right end of the second axis reflects their challenges in entering the housing market (Lebrusán Murillo 2023). The upper-left quadrant is characterised by highly educated individuals employed in qualified occupations with high-income levels owning multiple housing properties. The bottom-left quadrant largely gathers those in older age groups with low education levels, living in small cities and rural areas with relatively easy access to housing. Lastly, the bottom-right quadrant predominantly includes low-income groups with low education levels, who are notably exposed to unemployment and face strong difficulties for accessing a dwelling.
Additionally, these results underscore the connection between parental education and the position of respondents in the social space. The inheritance of cultural capital (i.e. parental educational attainment) is associated with respondents’ position in the social space, a finding that is in line with previous research showing the limited social mobility in contemporary Spanish society (Cervini-Plá 2015; León et al. 2024).
Life Course and Regional Origin Differences in the Spanish Social Space
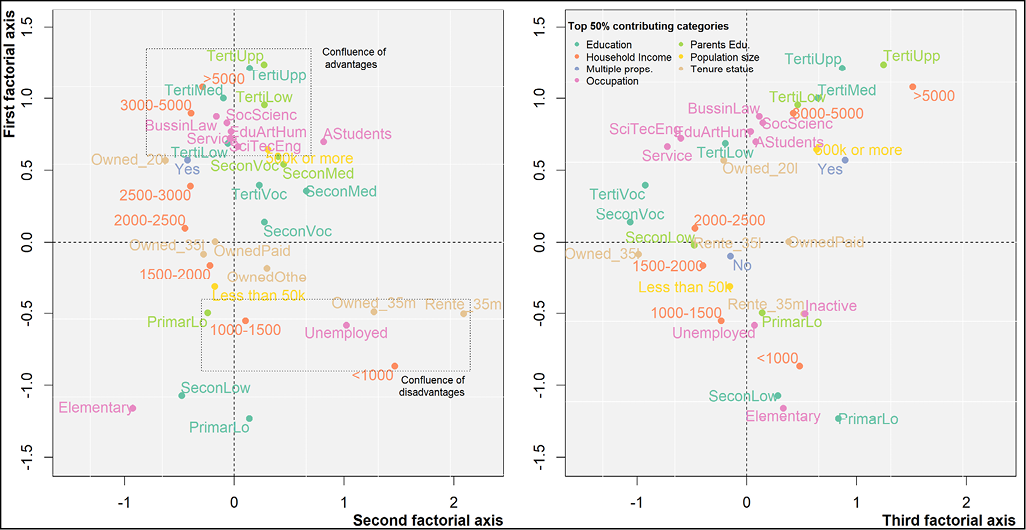
We now turn to the analysis of the supplementary variables to evaluate how age and region of birth interact with the different patterns of social inclusion/exclusion that we have identified in the Spanish social space. In other words, by interacting each origin subpopulation with age groups we show how natives and immigrants incorporate into and constitute the Spanish social space at different stages of life.
Figure 2 displays the mean location of each origin-age subgroup into the social space (i.e., average coordinate in factorial axes). As in Figure 1, the left panel shows the first and second factorial axes and the right panel the first and the third factorial axes. Colours represent the region of birth, markers’ shapes indicate the age groups, and the size represents the population size of each origin with respect to the age group. Green points representing the Spanish population are the largest because Spaniards represent more than 2/3rds of the population in all age groups. Two immigrant minorities with divergent locations stand out: EU and African migrants; whereas Latin American and Caribbean immigrants represent sizable shares of the young adult and adult populations: 20s, 30s, and 40s.
Figure 2. Average location and relative sizes of origin and age groups within the Spanish social space.
Note: Table A2 in the appendix highlights the population size estimated percentages for each country/region of origin.
Source: Own work based on Encuesta de Características Esenciales de la Población y Viviendas – 2021.
In Figure 2, older cohorts hover around the bottom part of the socioeconomic axis (vertical), whereas those under 40 tend to be located at the top. Given that older cohorts experienced a context of limited access to higher education, they display larger percentages of individuals with low educational credentials and employed in elementary occupations, partially capturing a cohort effect.
Lower educational attainment levels and occupational profiles, together with lower mean income levels, place older age groups close to other socially disadvantaged groups. However, a close look at the data shows that this population group has been able to accumulate larger amounts of wealth, especially in the form of real estate assets. The higher share of retired respondents among these age groups can also partially explain their lower income levels, especially because the only income sources available in the data were labour and pensions.
From a life course perspective, in line with economic theory on the life cycle (Nagatani 1972), our results also show that individuals aged between 40 and 50 tend to be the top-income earners, a feature that is especially salient for natives, second-generation Spaniards and individuals from EU countries. In this regard, the proximity between younger age groups (i.e. those under 30) and high-income categories is caused by their shared higher education levels, but also by the protracted transition to leaving the parental home, a common trait in Southern European societies like Spain (Módenes et al. 2013).
The second factorial axis in Figure 2 (horizontal), instead, delineates an unambiguous hierarchy in terms of migration background, supporting the theory of a segmented incorporation into the Spanish social space (Zhou 1997; Prieto et al. 2018; Muñoz-Comet and Arcarons 2021). Given the composition of the axis, the hierarchization of migrant groups appears to be associated with patterns of residential exclusion. Native-born individuals on the left, exhibit higher ownership rates, lower financial burdens and higher income levels, whereas migrant populations located along the axis experience harsher dwelling conditions and are the most exposed to the current housing crisis (Amuedo-Dorantes and Mundra 2013; Delclós 2023). More specifically, more than 60% of the Latin American and African populations are tenants, and one-fourth pay above 35% of the household earnings for accessing housing. In this context, access to homeownership does not seem to be a possibility for these two origin groups. The position of the youngest age groups towards the right end of this second axis further highlights their difficulties in accessing the housing market.
The third axis reinforces the presence of generational differences in social status among the Spanish-born and the second generation by positioning older individuals more prominently in the bottom-right region of the plot. Only individuals of African origin share similar right-hand-side coordinates. Individuals over 60 years old from non-African and non-Spanish regions exhibit much smaller coordinates along the third axis, and those in other age groups from these regions cluster closely together in this dimension. This relative lack of differentiation may reflect the shared experiences of migration, which can obscure generational disparities observed among Spaniards. The distinct position of individuals of African origin represents an extreme manifestation of this phenomenon, illustrating the distortion of generational social status disparities that may arise from the immigration experience.
Our methodological approach posits that in a given social space, two individuals with different living conditions will be located in distant positions with respect to each other by virtue of the different values in the variables used to define the model. Conversely, individuals with similar characteristics will be close to each other. When looking at the interaction between age and region of birth we find that within group age differences are much more salient for Spanish-born, EU and second-generation individuals than in the other groups. For instance, the distance in the first factorial axis between natives in their 20s and those in their 60s is 0.81 standard deviations (SD), while it is only 0.12 SD for immigrants from Africa, Asia and Other European countries. These results reveal that migrants share similar living conditions across age groups, while there are notable differences in the case of natives and EU migrants. In other words, age significantly influences the social positioning of natives but is less relevant for immigrants.
Focusing on the second generation, we find notable differences between descendants of immigrants and those of natives, even among the same age groups. Consistent with previous research (Portes and Zhou 1993; Bayona-i-Carrasco et al. 2020; Bayona-i-Carrasco and Domingo 2024), the second generation shows a higher prevalence of low education levels compared to natives-descendants. Moreover, their precarious access to housing pulls all age groups within the second generation towards the right end of the second axis. However, compared to immigrants, the second generation occupies a relatively more advantaged position in the Spanish social space. These findings suggest that the second generation also experiences segmented assimilation, hence pre- and post-distributive policies might not be completely successful in guaranteeing similar prospects to both immigrants- and natives-descendants.
Is it all about age, migrant generation, and regions of origins?
Our bottom-up clustering approach assumes that the answer to this question is no. We posit that probable social classes would sharpen and enrich our understanding of stratification beyond the observed patterns by age and region of origin. This is because probable social classes are built upon shared material living conditions, regardless of the place of birth. In other words, we assume that multidimensionally defined social strata subsume differences by immigration status for certain origin groups.
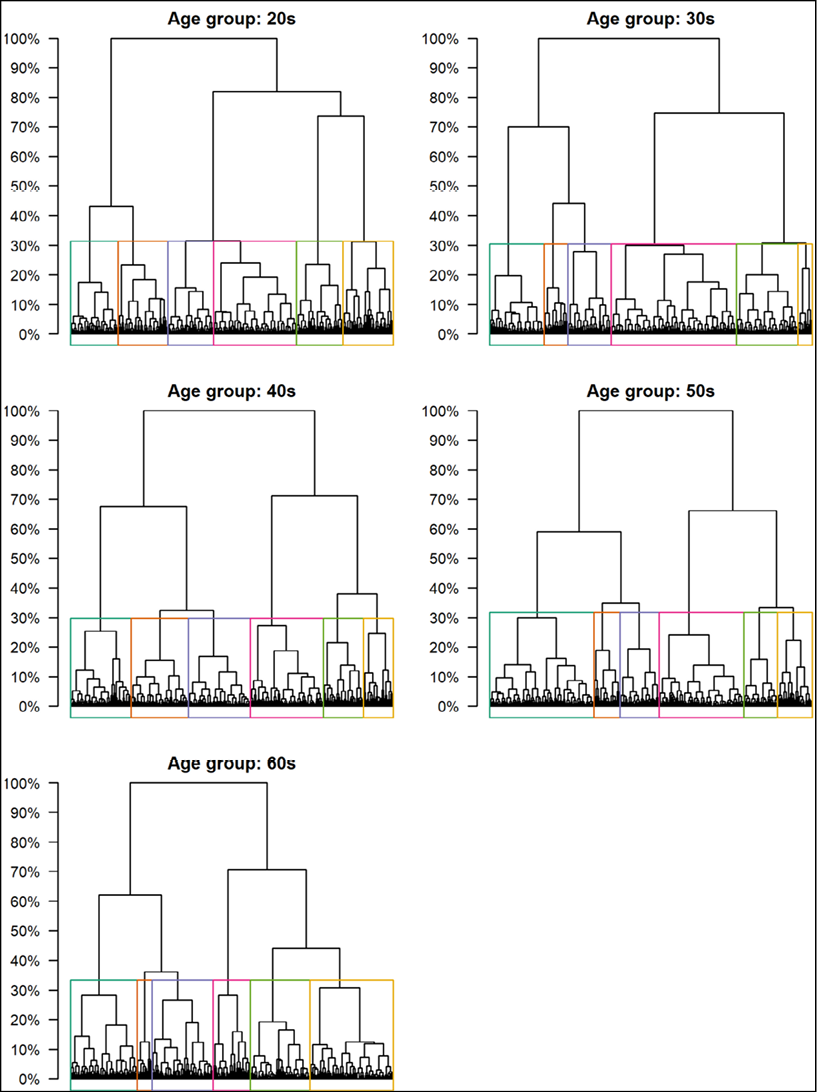
To operationalize this idea, we implement a six-cluster solution for each age group. These solutions balance explanatory power with comparability across groups. Figure A1 in the Appendix shows descriptively the similarity of goodness of fit for six clusters solutions across age groups.
Figure 3 displays age-specific centres of the clusters along the first three factorial axes. Colours represent the clusters and the markers the age groups (20s, 30s, 40s, 50s, and 60s). Grey background points represent the study population. The centres of the clusters are computed as the weighted mean coordinate of individuals in each cluster. The ellipses represent the 75% confidence interval and follow the overall location of individuals within the social space.
Figure 3. Distribution of the clusters across the social space
Source: Own work based on the Encuesta de Características Esenciales de la Población y Viviendas – 2021.
The centres of the clusters are comparable to the mean location of age and region of origin groups in Figure 2. A visual comparison of Figures 2 and 3 gives a first insight on the relevance of social classes over demographic markers. The greater distance among clusters’ centres compared to age and region-of-origin groups signal the strength of material configurations in constituting the Spanish stratification system beyond age and origin. Especially in top classes, markers for all age groups appear close to one another indicating shared privileged conditions across the life course of well-off individuals. At the other end of the spectrum, age markers are more dispersed indicating variegated forms of disadvantage across age groups in lower classes.
Clusters 1 to 3 are vertically located along the first axis signalling a clear socioeconomic gradient. Conversely, Clusters 4 to 6 are distributed along the second factorial axis. Therefore, class differentiation among socially disadvantaged probable social classes is mostly determined by the urban-rural divide and by the differing modes of incorporation into the housing market.
The size of the ellipses in Figure 3 indicates the degree of concentration of individuals within the probable social classes. Clusters 1 to 4 concentrate most of their members in relatively small areas of the social space. Accordingly, individuals’ profiles and living conditions are more homogeneous among these clusters. On the contrary, Clusters 5 and 6 partially capture manifold dynamics of inequality, leading to a more diverse composition that comprises a wider range of realities within each probable social class.
An examination of the composition of the probable social classes reveals that in all age groups, Cluster 1 predominantly consists of individuals with the highest levels of education, concentrated in skilled occupations, particularly in social sciences, business, and law. As a result, 70-80% of individuals in Cluster 1 belong to the two highest income brackets. This group lives in large metropolitan areas and has the highest rates of multiple property ownership and mortgage-free homes.
Clusters 2 and 3 exhibit declining educational attainment and parental education levels. In Cluster 2, more than 65% of individuals have tertiary education, while in Cluster 3, secondary education is the most common. The lower educational attainment in Cluster 3 also contributes to their lower income and higher unemployment rates, which can be twice as high as those in Cluster 2. The most significant difference between the two probable social classes lies in their spatial distribution: over half of the population in Cluster 3 resides in small towns and villages (fewer than 50,000 residents), compared to just 30-40% in Cluster 2. Both probable social classes show lower rates of property ownership compared to Cluster 1. Ownership of multiple properties is less common as well.
Cluster 4 has the highest proportion of individuals living in small towns and rural areas. In contrast to other probable social classes with similar socioeconomic characteristics, Cluster 4 has a higher percentage of individuals owning multiple real estate properties and inheriting or owning their dwelling without any remaining debt. Their relatively easy access to housing partially compensates their low levels of education and income and the predominance of elementary occupations. Clusters 5 and 6 represent the most disadvantaged segments. Despite having higher mean education levels than Cluster 4, these probable social classes face the highest unemployment rates, and 80% of their members fall into the lowest income brackets. These factors severely limit their access to housing, resulting in the highest tenancy rates and the most pronounced economic struggles in securing housing, regardless of tenure status. A detailed description of the clusters can be found in Tables A4.1-A4.5.
The joint interpretation of Figures 2 and 3 suggest that clusters display non-random compositions according to region of origin. We confirm this visual intuition with the composition of the clusters by respondents’ origin for all age groups combined in Table 2. Despite the overrepresentation of immigrants in the lower probable social classes, Spanish-born make up the majority of the socially excluded. More than 65% of individuals in Cluster 5 and 6 are Spanish-born, and at least 60% have Spanish-born parents. Second-generation individuals are present in similar shares across clusters with a slight overrepresentation in the last two clusters. Notably, SEs are relatively low for the shares of this group. In other words, social inequality affects native- and foreign-born populations distinctively, the former as a majority population with large shares among socially excluded groups, and the latter by concentrating their individuals into socially excluded groups.
At the other end of the spectrum, social inequality is reflected in the closeness of the upper probable social classes. The underrepresentation of African individuals in the first three clusters implies their virtual absence in this high-status social milieu for all age groups. Top classes are not accessible for African immigrants, more so when standard errors are considered.
Table 2. Region of birth shares (%) by probable social classes for 20 to 64-year-old individuals in Spain
|
Probable social classes (Clusters) |
Country / Region of birth |
||||||
|
Africa |
Asia and Europe |
European Union |
Latin America and the Caribbean |
Spain |
Spain - SG |
Total |
|
|
1 |
0.3 |
2.5 |
3.3 |
5.3 |
86.7 |
1.9 |
100 |
|
(0.1) |
(0.2) |
(0.5) |
(0.9) |
(1.5) |
(0.2) |
||
|
2 |
0.4 |
2.8 |
2.4 |
4.9 |
87.4 |
2.0 |
100 |
|
(0.0) |
(0.3) |
(0.2) |
(0.7) |
(1.2) |
(0.1) |
||
|
3 |
0.8 |
3.8 |
2.8 |
5.6 |
84.7 |
2.2 |
100 |
|
(0.1) |
(0.2) |
(0.2) |
(0.7) |
(0.9) |
(0.1) |
||
|
4 |
3.5 |
4.0 |
2.0 |
5.8 |
82.8 |
2.0 |
100 |
|
(0.2) |
(0.5) |
(0.1) |
(1.3) |
(1.8) |
(0.1) |
||
|
5 |
2.3 |
4.1 |
3.1 |
10.8 |
76.9 |
2.8 |
100 |
|
(0.3) |
(0.5) |
(0.3) |
(2.7) |
(3.6) |
(0.2) |
||
|
6 |
8.7 |
6.5 |
3.4 |
13.8 |
63.4 |
4.1 |
100 |
|
(0.7) |
(0.4) |
(0.2) |
(2.6) |
(2.6) |
(0.4) |
||
|
Total |
2.3 |
3.8 |
2.7 |
7.0 |
81.9 |
2.4 |
100 |
|
SEs |
(0.2) |
(0.2) |
(0.2) |
(1.2) |
(1.5) |
(0.1) |
|
Note: Numbers in parentheses are the standard errors (SEs). Table A3 in the appendix displays age-group specific cross tabulations between probable social classes and region of origin.
Source: Own work based on the Encuesta de Características Esenciales de la Población y Viviendas – 2021.
Immigrants from European Union countries display a U-shaped pattern across clusters, meaning an overrepresentation in higher and lower classes potentially reflecting existing inequalities across EU nations (e.g., West-East divergent migration flows). The shares for immigrants from Latin American and Caribbean countries look like those of the second generation, with greater standard errors.
Top classes are partially open for immigrants from regions other than Africa. These various patterns demonstrate the connection between macro-level forms of inequality as well as within-country within-EU disparities as drivers of immigration. According to these results, it will be hard to understand immigration through univariate analysis and overarching categories such as immigrants, Africans, Latin American and even European migrants.
All in all, probable social classes allow us to empirically challenge simplistic narratives that view immigrants as a homogeneous group in constant need of social assistance. While immigrants are overrepresented in socially disadvantaged probable social classes, some regions of origin are also present in the middle and upper social strata. Conversely, we find socially excluded populations among natives as well, making the case for the persisting role of class divisions from a macro-level perspective. Although racism plays a key role in the exclusion of immigrants and non-white groups (Baker and O’Connell 2022), there are other factors contributing to the experiences of inclusion and exclusion of natives and migrants; class is a fundamental one (Balibar and Wallerstein 1991).
Table A3 in the appendix replicates Table 2 for each of the five age groups. While the patterns shown in these tables align with our overall conclusions, they are provided for future research on age-specific trends. Of particular interest is how variations in cluster composition across age groups may reflect life-course dynamics, such as the transmission of inequality or specific aspects of the migration process itself.
Analysing the incorporation patterns of immigrants into host countries is crucial for understanding the growing complexity and the emerging inequality trends in contemporary societies (Portes and Zhou 1993; Domingo 2015). The Spanish case is particularly relevant as the country has become Europe’s second-largest recipient of immigrants over the past two decades (Van Mol and de Valk 2016).
Recent immigration flows to Spain are characterised by highly diverse profiles, spanning from privileged groups to those facing substantial disadvantages. As a result, the generalised concept of “immigration” often masks segmented assimilation processes fostered by the characteristics of the hosting society and the heterogeneous demographic, socioeconomic and cultural backgrounds of the newly arrived population.
In this paper we have provided a measure of the confluence and interaction between categories of social privilege and disadvantage constituting contemporary Spanish society in the form of social space. The placement of native- and foreign-born populations at different life stages in the social space offers a visual representation of their living conditions and of their modes of integration into Spanish society.
Educational expansion increased mean levels of education in the younger cohorts compared to older generations. However, their lower income levels and the greater economic efforts for accessing the housing market excludes them from fully integrating as independent adults in Spanish society. Authors like Módenes and colleagues (2013) have suggested that the delayed emancipation observed in Spain may be a strategy of young adults and a type of intergenerational support to face what is considered to be an adverse environment.
An overarching finding of this study is that age is an especially salient factor influencing the social status of Spaniards, Europeans and second-generation Spaniards, but its importance diminishes for immigrants from Latin America and the Caribbean, Asia and other European countries and Africa. The similar living conditions of immigrants from these regions across age groups can influence the actual and perceived structure of opportunities of young immigrants, potentially affecting their desires and expectations and hence their long-term socioeconomic outcomes (Feliciano and Rumbaut 2005; Trinidad 2019).
Consistent with the segmented assimilation theory (Zhou 1997; Portes et al. 2018), we find evidence of stratified patterns of incorporation based on the region of birth. We conclude that a meaningful share of immigrants from Africa, Latin America and the Caribbean, Asia, and non-EU countries experience social exclusion, and that their worse labour and economic outcomes cannot be fully explained by their socioeconomic characteristics. Additionally, the high cost of accessing housing emerges as a significant barrier to their full development and integration into the host society (Delclós 2023).
Our research also confirms the results obtained by previous studies on second-generation immigrants in Spain (Bayona-i-Carrasco et al. 2020). While second-generation immigrants occupy a relatively advantaged social position compared to first-generation immigrants, their socioeconomic outcomes remain worse than those of native Spaniards. This suggests only partial assimilation and raises concerns about the effectiveness of existing redistribution policies (Vtyurina 2020).
This research identifies overlapping categories of social privilege and disadvantage shared by both immigrants and natives. While immigrants are disproportionately represented among socially disadvantaged groups, they also hold significant representation in the middle and upper probable social classes. Furthermore, a substantial portion of the socially disadvantaged population consists of natives. A relevant contribution of our study is that, moving beyond dichotomic perspectives on social exclusion, we find interacting categories of both social privilege and disadvantage converging on social groups. Rather than viewing social groups as simply privileged or disadvantaged, our findings highlight the complex nature of inequality.
Our study has some limitations. First, we lack information on wealth and income sources, two elements that would provide insightful understanding of the configuration of the social space. Second, the sample size does not allow for a detailed analysis of the parental origins of the second-generation, limiting the analysis of their segmented incorporation into Spanish society. Additionally, given that immigration to Spain is a relatively recent phenomenon, our results on the second generation are especially relevant to younger cohorts, but their interpretation for older age groups should be approached with caution.
Acknowledgements
This work received funding from ‘la Caixa’ Foundation through the project “Interconnected inequalities through the life course in Spain” (INTERINEQ, Ref. SR22-00089) and from the Autonomous Government of Catalonia (Ref. 2021 BP 00027)
Bibliography
ALONSO PÉREZ, Matilde and Elies FURIO BLASCO (2007): España: De La Emigración a La Inmigración. Working Paper. HAL.
ALONSO-VILLAR, Olga and Coral del RÍO (2013): “Occupational Segregation in a Country of Recent Mass Immigration: Evidence from Spain”. The Annals of Regional Science 50 (1), pp. 109-34. DOI: 10.1007/s00168-011-0480-2.
AMUEDO-DORANTES, Catalina and Kusum MUNDRA (2013): “Immigrant Homeownership and Immigration Status: Evidence from Spain”. Review of International Economics 21 (2), pp. 204-18. DOI: 10.1111/roie.12031.
APARICIO, Rosa and Alejandro PORTES (2014): Crecer En España: La Integración de Los Hijos de Inmigrantes. Obra Social” La Caixa”.
ARANGO, Joaquín (2003): “La explicación teórica de las migraciones: luz y sombra”. Migración y Desarrollo 01 (01), pp. 4-22. DOI: 10.35533/myd.0101.ja.
ARSLAN, Cansin, Jean-Christophe DUMONT, Zovanga KONE, Yasser MOULLAN, Caglar OZDEN, Christopher PARSONS and Theodora Xenogiani (2015): A New Profile of Migrants in the Aftermath of the Recent Economic Crisis. Paris: OECD.
ARUNDEL, Rowan and Christian LENNARTZ (2020): “Housing Market Dualization: Linking Insider-Outsider Divides in Employment and Housing Outcomes”. Housing Studies 35 (8), pp. 1390-1414. DOI: 10.1080/02673037.2019.1667960.
ATKINSON, Will J and Andreas SCHMITZ (2024): “The German Social Space and Its Homologies: National Variation on a Basic Structure”. Current Sociology 72 (1), pp. 168-91. DOI: 10.1177/00113921221100582.
BAKER, Regina S. and Heather A. O’CONNELL (2022): “Structural Racism, Family Structure and Black-White Inequality: The Differential Impact of the Legacy of Slavery on Poverty among Single Mother and Married Parent Households”. Journal of Marriage and Family 84 (5), pp. 1341-65. DOI: 10.1111/jomf.12837.
BALIBAR, Étienne and Immanuel Maurice WALLERSTEIN (1991): Race, Nation, Class: Ambiguous Identities. London/New York, Verso.
BAYONA-I-CARRASCO, Jordi and Andreu DOMINGO (2024): “Descendientes de inmigrantes nacidos en España: ¿hacia una integración segmentada?” Revista Española de Investigaciones Sociológicas.
BAYONA-I-CARRASCO, Jordi, Andreu DOMINGO and Teresa MENACHO (2020): “Trayectorias migratorias y fracaso escolar de los alumnos inmigrados y descendientes de migrantes en Cataluña”. Revista Internacional de Sociología 78 (1), pp. e150-e150. DOI: 10.3989/ris.2020.78.1.18.107.
BENTOLILA, Samuel, Juan J. DOLADO and Juan F. JIMENO (2012): “Reforming an Insider-Outsider Labor Market: The Spanish Experience”. IZA Journal of European Labor Studies 1 (4). DOI: 10.1186/2193-9012-1-4.
BLAVIER, Pierre (2023): “Class Boundaries in Spain: Intergenerational and Regional Changes in the Wake of the 2008 Economic Crisis”. Pp. 203-19 in Class Boundaries in Europe. First edition. First edition. Routledge.
BOURDIEU, Pierre (1996): Distinction. A Social Critique of the Judgement of Taste. Eighth edition. Cambridge, MA, Harvard University Press.
BOURDIEU, Pierre (2005): The Social Structures of the Economy. Cambridge, UK/Malden, MA, Polity.
BRANSON, Nicola, Johs HJELLBREKKE, Murray LEIBBRANDT, Vimal RANCHHOD, Mike SAVAGE and Emma WHITELAW (2024): “The Socioeconomic Dimensions of Racial Inequality in South Africa: A Social Space Perspective”. The British Journal of Sociology 75 (4), pp. 613-35. DOI: 10.1111/1468-4446.13115.
BUENO, Xiana and Elena VIDAL-COSO (2019): “Vulnerability of Latin American Migrant Families Headed by Women in Spain During the Great Recession: A Couple-Level Analysis”. Journal of Family Issues 40 (1), pp. 111-38. DOI: 10.1177/0192513X18804584.
CANALES CERÓN, Alejandro (2021): El malestar con las migraciones: perspectivas desde el Sur. Barcelona, Anthropos.
CARLING, J (2002): “Migration in the Age of Involuntary Immobility: Theoretical Reflections and Cape Verdean Experiences”. Journal of Ethnic and Migration Studies 28 (1), pp. 5-42. DOI: 10.1080/13691830120103912.
CASTLES, Stehphen, Hein DE HAAS and Mark J. MILLER (2014): The Age of Migration. International Population Movement in the Modern World. 5th edition. New York, The Guildford Press.
CEBRIÁN VILLAR, Mar (2009): “Los determinantes de los flujos migratorios internacionales: el caso español, 1995-2007”. Principios: estudios de economía política (14), pp. 49-68.
CERVINI-PLÁ, María (2015): “Intergenerational Earnings and Income Mobility in Spain”. Review of Income and Wealth 61 (4), pp. 812-28.
DE HAAS, Hein (2014): “Migration Theory. Quo Vadis?” Oxford, International Migration Institute.
DELCLÓS, Carlos (2023): “The Burden of the Border: Precarious Citizenship Experiences in the Wake of the Spanish Housing Crash”. European Urban and Regional Studies 30 (3), pp. 248-60. DOI: 10.1177/09697764221136092.
DOMINGO, Andreu (2015): “Migration as a Global Risk : The World Economic Forum and Neoliberal Discourse on Demography”. Quetelet Journal 3 (1), pp. 97-117. DOI: 10.14428/rqj2015.03.01.04.
DOMINGO, Andreu and Jordi BAYONA-I-CARRASCO (2024): “Second Latin American Migratory Boom in Spain: From Recovery to COVID-19”. Migration Studies 12 (1), pp. 93-113. DOI: 10.1093/migration/mnad039.
DOMINGO, Andreu and Amand BLANES (2015): “Inmigración y Emigración en España: estado de la cuestión y perspectivas de futuro”. Anuario CIDOB de la Inmigración, pp. 91-122.
DOMINGO, Andreu and Nachatter SINGH-GARHA (2022): “La gran mobilització: globalització i migracions”. Documents d’Anàlisi Geogràfica 68 (3), pp. 467-80. DOI: 10.5565/rev/dag.744.
DRAY, Stéphane and Nne-Béatrice DUFOUR (2007): “The Ade4 Package: Implementing the Duality Diagram for Ecologists”. Journal of Statistical Software 22 (4). DOI: 10.18637/jss.v081.b02.
ESPING-ANDERSEN, Gøsta (coord.), Bruno ARPINO, Pau BAIZÁN, Daniela BELLANI, Teresa CASTRO-MARTÍN, Mathew J. CREIGHTON, Carlos Eric DELCLÒS, Marta DOMÍNGUEZ, María José GONZÁLEZ, Francesca LUPPI, Teresa MARTÍN-GARCÍA, Léa PESSIN and Roberta RUTIGLIANO (2013): El Déficit de Natalidad en Europa. La singularidad del caso español. Barcelona, Fundación ”la Caixa”. https://www.observatoriodelainfancia.es/oia/esp/descargar.aspx?id=4103&tipo=documento.
FELICIANO, Cynthia and Rubén G. RUMBAUT (2005): “Gendered Paths: Educational and Occupational Expectations and Outcomes among Adult Children of Immigrants”. Ethnic and Racial Studies 28 (6), pp. 1087-1118. DOI: 10.1080/01419870500224406.
FERNÁNDEZ-MACÍAS, Enrique, Rafael GRANDE, Alberto DEL REY POVEDA and José-Ignacio ANTÓN (2015): “Employment and Occupational Mobility among Recently Arrived Immigrants: The Spanish Case 1997-2007”. Population Research and Policy Review 34 (2), pp. 243-77. DOI: 10.1007/s11113-014-9347-4.
FRASER, Nancy (1998): “Schmitz”. Wissenschaftszentrum Berlin für Sozialforschung - Discussion Paper 98-108.
FUSSELL, Elizabeth (2010): “The Cumulative Causation of International Migration in Latin America”. The ANNALS of the American Academy of Political and Social Science 630 (1), pp. 162-77. DOI: 10.1177/0002716210368108.
GASTÓN-GUIU, Silvia, Andreu DOMINGO and Jordi BAYONA-I-CARRASCO (2024): “Segregación residencial y ocupacional de la población africana en España en el siglo XXI”. Documents d’Anàlisi Geogràfica 70 (2), pp. 167-94. DOI: 10.5565/rev/dag.891.
GASTÓN-GUIU, Silvia, Rocío TREVIÑO and Andreu DOMINGO (2021): “La brecha africana: desigualdad laboral de la inmigración marroquí y subsahariana en España, 2000-2018”. Migraciones. Publicación del Instituto Universitario de Estudios sobre Migraciones (52), pp. 177-220. DOI: 10.14422/mig.i52.y2021.007.
GONZÁLEZ FERRER, Amparo and Héctor CEBOLLA-BOADO (2018): “Los hijos de la inmigración en España: valores, aspiraciones y resultados”, in Informe España 2018. Cátedra José María Martín Patino de la Cultura del Encuentro, pp. 111-164.
HARRISON, Joseph and David CORKILL (2016): Spain: A Modern European Economy. London, Routledge.
HERRERA, Gioconda (2013): “Gender and International Migration: Contributions and Cross-Fertilizations”. Annual Review of Sociology 39 (1), pp. 471-89. DOI: 10.1146/annurev-soc-071811-145446.
HICKEL, Jason, Morena HANBURY LEMOS and Felix BARBOUR (2024): “Unequal Exchange of Labour in the World Economy”. Nature Communications 15, 6298. DOI: 10.1038/s41467-024-49687-y.
INSTITUTO NACIONAL DE ESTADÍSTICA (2021): “Encuesta de Características Esenciales de La Población y Viviendas”. www.ine.es.
JOHNSON-HANKS, Jennifer, Christine A. BACHRACH, Philip MORGAN and Hans-Peter KOHLER (2011): Understanding Family Change and Variation: Toward a Theory of Conjunctural Action. First edition. New York, Springer.
LE ROUX, Brigitte and Henry ROUANET (2004): Geometric Data Analysis: From Correspondence Analysis to Structured Data Analysis. Dordrecht/Boston, Kluwer Academic Publishers.
LÊ, Sébastien, Julie JOSSE and François HUSSON (2008): “FactoMineR : An R Package for Multivariate Analysis”. Journal of Statistical Software 25 (1), pp. 253-58. DOI: 10.18637/jss.v025.i01.
LEBARON, Frédéric (2009): “How Bourdieu ‘Quantified’ Bourdieu: The Geometric Modelling of Data”, in K. Robson and C. Sanders (eds.), Quantifying Theory: Pierre Bourdieu. Dordrecht, Springer Netherlands, pp. 11-29.
LEBARON, Frédéric and Brigitte LE ROUX (2015): La Méhodologie de Pierre Bourdieu En Action : Espace Culturel, Espace Social et Analyse Des Données. Paris, Dunod.
LEBRUSÁN MURILLO, Irene (2023): “Derecho a la vivienda en los países del sur de Europa: entre el compromiso internacional y la realidad de la exclusión residencial”. Asamblea. Revista parlamentaria de la Asamblea de Madrid, 44, pp. 17-61. DOI: 10.59991/rvam/2023/n.44/54.
LEÓN, Berna, Javier CARBONELL and Javier SORIA (eds.) (2024): La Desigualdad En España. Madrid, Lengua de Trapo/Círculo de Bellas Artes.
MARTÍN-GARCÍA, Teresa (2013): “Romulus and Remus or Just Neighbours?: A Study of Demographic Changes and Social Dynamics in Italy and Spain”. Population Review 52 (1).
MÓDENES, Juan A., Celia FERNÁNDEZ-CARRO and Julián LÓPEZ-COLÁS (2013): “La Formación de Hogares y La Tenencia de Vivienda de Los Jóvenes En La Reconfiguración de Los Sistemas Residenciales Europeos”. Scripta Nova: revista electrónica de geografía y ciencias sociales, 17 (460).
MOOI-RECI, I. and Jacobo MUÑOZ-COMET (2016): “The Great Recession and the Immigrant-Native Gap in Job Loss in the Spanish Labour Market”. European Sociological Review 32 (6), pp. 730-751. DOI: 10.1093/esr/jcw031.
MORENO, Luis and María BRUQUETAS (2012): “Inmigración y Estado de Bienestar En España”. Revista Internacional de Sociología 70 (1), pp. 219-21.
MOYA, Jose C (2007): “Domestic Service in a Global Perspective: Gender, Migration and Ethnic Niches”. Journal of Ethnic and Migration Studies 33 (4), pp. 559-79. DOI: 10.1080/13691830701265420.
MUÑOZ-COMET, Jacobo and Albert ARCARONS (2021): “The Occupational Attainment and Job Security of Immigrant Children in Spain”. Journal of Ethnic and Migration Studies 48. DOI: 10.1080/1369183X.2021.1935662.
NAGATANI, Keizo (1972): “Life Cycle Saving: Theory and Fact”. The American Economic Review 62 (3), pp. 344-53.
PARDO, Campo Elías (2020): Estadística descriptiva multivariada. Universidad Nacional de Colombia Facultad de Ciencias.
PIORE, Michael J (1979): Birds of Passage. Cambridge, Cambridge University Press.
PORTES, Alejandro, Rosa APARICIO GÓMEZ and William HALLER (2018): “Hacerse adulto en España: la integración de los hijos de inmigrantes”. Anuario CIDOB de la inmigración (2018), pp. 148-81.
PORTES, Alejandro and Min ZHOU (1993): “The New Second Generation: Segmented Assimilation and Its Variants”. The ANNALS of the American Academy of Political and Social Science 530 (1), pp. 74-96. DOI: 10.1177/0002716293530001006.
PRIETO, Victoria, Joaquín RECAÑO and Doris QUINTERO-LESMES (2018): “Migration Responses of Immigrants in Spain during the Great Recession”. Demographic Research 38, pp. 1885-1932. DOI: 10.4054/DemRes.2018.38.61.
R CORE TEAM (2017): R: A Language and Environment for Statistical Computing.
RODRÍGUEZ, Lorenzo CACHÓN, María AYSA-LASTRA, Lorenzo CACHÓN RODRÍGUEZ and María AYSA-LASTRA (2021): “Asimilación segmentada y trayectorias de clase: las segundas generaciones de inmigrantes en el mercado de trabajo en España”. In Los nuevos españoles: la incorporación de los hijos de inmigrantes, pp. 23-58. Bellaterra.
STUDER, Matthias (2013): “WeightedCluster Library Manual: A Practical Guide to Creating Typologies of Trajectories in the Social Sciences with R”. DOI: 10.12682/LIVES.2296-1658.2013.24.
THERBORN, Göran (2013): The Killing Fields of Inequality. Cambridge, Polity.
TRINIDAD, Jose Eos (2019): “Stable, Unstable and Later Self-Expectations’ Influence on Educational Outcomes”. Educational Research and Evaluation 25 (3-4), pp. 163-78. DOI: 10.1080/13803611.2019.1676789.
VAN MOL, Christof and Helga de Valk (2016): “Migration and Immigrants in Europe: A Historical and Demographic Perspective”. Pp. 31-55 in Integration Processes and Policies in Europe: Contexts, Levels and Actors, edited by B. Garcés-Mascareñas and R. Penninx. Cham: Springer International Publishing.
VTYURINA, Svetlana (2020): “Effectiveness and Equity in Social Spending - The Case of Spain”IMF. https://www.imf.org/en/Publications/WP/Issues/2020/01/30/Effectiveness-and-Equity-in-Social-Spending-The-Case-of-Spain-48936. Accessed on September 23, 2024.
ZHOU, Min (1997): “Segmented Assimilation: Issues, Controversies and Recent Research on the New Second Generation”. International Migration Review 31 (4), pp. 975-1008. DOI: 10.1177/019791839703100408.
Table A1: Categories’ contribution to the three first factorial axes
|
Variables and categories |
Contribution to factorial axes |
||
|
1st |
2nd |
3rd |
|
|
Educational attainment |
|||
|
Primary and below |
4.82 |
0.10 |
3.67 |
|
Secondary low |
12.97 |
4.24 |
1.49 |
|
Secondary medium |
0.63 |
3.41 |
0.63 |
|
Secondary vocational |
0.09 |
0.57 |
8.92 |
|
Tertiary vocational |
0.72 |
0.38 |
6.49 |
|
Tertiary low |
2.21 |
0.03 |
0.30 |
|
Tertiary medium |
5.79 |
0.10 |
3.98 |
|
Tertiary upper |
3.42 |
0.07 |
2.88 |
|
Tenure status |
|||
|
Inherited |
0.73 |
0.00 |
0.02 |
|
Owner <20% |
2.64 |
5.21 |
0.60 |
|
Owner <35% |
0.03 |
0.49 |
6.18 |
|
Owner >35% |
0.47 |
5.17 |
0.01 |
|
Owner other |
0.12 |
0.52 |
0.06 |
|
Owner paid |
0.00 |
0.65 |
3.14 |
|
Tenant <20% |
0.01 |
0.34 |
0.17 |
|
Tenant <35% |
0.00 |
0.04 |
0.98 |
|
Tenant >35% |
0.63 |
17.85 |
1.12 |
|
Household income |
|||
|
<1000 |
4.53 |
20.92 |
2.32 |
|
1000-1500 |
2.46 |
0.14 |
0.74 |
|
1500-2000 |
0.19 |
0.59 |
1.95 |
|
2000-2500 |
0.06 |
2.02 |
2.29 |
|
2500-3000 |
0.76 |
1.30 |
0.55 |
|
3000-5000 |
5.30 |
1.67 |
1.94 |
|
>5000 |
2.61 |
0.31 |
8.43 |
|
Occupation |
|||
|
Unemployed |
2.19 |
10.89 |
0.05 |
|
Inactive |
0.79 |
0.01 |
1.45 |
|
Students |
1.20 |
2.62 |
0.03 |
|
Elementary |
10.91 |
11.31 |
1.48 |
|
Housework |
1.19 |
0.00 |
0.65 |
|
Service |
1.75 |
0.01 |
3.43 |
|
Education, Arts and Humanitites |
2.10 |
0.00 |
0.01 |
|
Social Sciences |
1.87 |
0.02 |
0.09 |
|
Bussines and Law |
2.09 |
0.12 |
0.06 |
|
Sciences, Technology and Engineering |
3.34 |
0.01 |
3.83 |
Table A1 (cont.)
|
Variables and categories |
Contribution to factorial axes |
||
|
1st |
2nd |
3rd |
|
|
Urbanization |
|||
|
Less than 50k |
1.87 |
1.01 |
0.77 |
|
50 to 100k |
0.00 |
0.11 |
0.03 |
|
100 to 500k |
0.23 |
0.09 |
0.19 |
|
500k or more |
2.88 |
1.04 |
4.60 |
|
Parental educational attainment |
|||
|
Primary and below |
4.87 |
1.91 |
0.64 |
|
Secondary low |
0.00 |
0.04 |
3.63 |
|
Secondary medium |
0.90 |
1.00 |
0.98 |
|
Secondary vocational |
0.90 |
0.65 |
0.88 |
|
Tertiary vocational |
0.76 |
0.36 |
0.38 |
|
Tertiary low |
1.84 |
0.24 |
0.71 |
|
Tertiary upper |
4.85 |
0.38 |
8.09 |
|
Multiple real state properties |
|||
|
No |
0.32 |
0.29 |
1.31 |
|
Yes |
1.94 |
1.76 |
7.84 |
Note: Bold numbers indicate contributions above the mean.
Source: Own work based on the Encuesta de Características Esenciales de la Población y Viviendas – 2021.
Table A2: Row and column percentage for the crosstabulation of age groups and regions of origin
|
Age groups |
Country / Region of birth |
Total |
||||||
|
Africa |
Asia and Europe |
European Union |
Latin America and the Caribbean |
Spain |
Spain - SG |
|||
|
20 to 29 |
% row |
1.7 |
2.4 |
1.6 |
6.4 |
79.1 |
8.7 |
100 |
|
% column |
13.7 |
11.4 |
10.6 |
16.3 |
17.2 |
65.1 |
||
|
30 to 39 |
% row |
3.3 |
5.1 |
2.7 |
9.7 |
77.3 |
1.9 |
100 |
|
% column |
29.4 |
27.4 |
20.6 |
28.2 |
19.1 |
16.0 |
||
|
40 to 49 |
% row |
3.0 |
4.3 |
3.1 |
8.0 |
80.9 |
0.8 |
100 |
|
% column |
34.9 |
30.5 |
30.7 |
30.6 |
26.5 |
8.8 |
||
|
50 to 59 |
% row |
1.6 |
3.6 |
3.2 |
5.3 |
85.6 |
0.7 |
100 |
|
% column |
17.7 |
23.3 |
29.7 |
18.9 |
25.9 |
6.9 |
||
|
60 to 64 |
% row |
0.9 |
2.7 |
2.2 |
4.0 |
89.4 |
0.7 |
100 |
|
% column |
4.3 |
7.4 |
8.4 |
6.0 |
11.3 |
3.2 |
||
Source: Own work based on the Encuesta de Características Esenciales de la Población y Viviendas – 2021.
Figure A1: Dendrograms and cluster solution for each age group
Source: Own work based on the Encuesta de Características Esenciales de la Población y Viviendas – 2021.
Table A3: Region of birth shares (%) by probable social classes and ten-year age groups in Spain
|
Age group |
Probable social classes (Clusters) |
Country / Region of birth |
|||||
|
Africa |
Asia and Europe |
European Union |
Latin America and the Caribbean |
Spain |
Spain - SG |
||
|
20s |
1 |
0.3 |
0.6 |
2.3 |
3.2 |
90.1 |
3.4 |
|
2 |
0.2 |
1.2 |
1.3 |
4.1 |
86.4 |
6.9 |
|
|
3 |
0.7 |
2.4 |
1.5 |
4.1 |
82.8 |
8.5 |
|
|
4 |
4.8 |
4.3 |
1.3 |
8.8 |
70.5 |
10.2 |
|
|
5 |
1.0 |
1.6 |
1.3 |
6.6 |
80.1 |
9.3 |
|
|
6 |
4.8 |
5.4 |
2.5 |
14.5 |
57.8 |
15.0 |
|
|
Total |
1.7 |
2.4 |
1.6 |
6.4 |
79.1 |
8.7 |
|
|
30s |
1 |
0.4 |
3.8 |
5.0 |
9.8 |
78.3 |
2.7 |
|
2 |
0.6 |
3.8 |
2.6 |
7.6 |
84.1 |
1.4 |
|
|
3 |
1.1 |
3.9 |
2.0 |
6.9 |
84.5 |
1.6 |
|
|
4 |
5.8 |
6.1 |
1.8 |
7.9 |
76.3 |
2.0 |
|
|
5 |
3.1 |
7.6 |
4.6 |
20.3 |
62.1 |
2.1 |
|
|
6 |
13.0 |
7.7 |
2.0 |
13.3 |
61.8 |
2.2 |
|
|
Total |
3.3 |
5.1 |
2.7 |
9.7 |
77.3 |
1.9 |
|
|
40s |
1 |
0.4 |
3.2 |
4.0 |
5.3 |
86.0 |
1.1 |
|
2 |
0.4 |
2.7 |
2.6 |
4.6 |
89.0 |
0.6 |
|
|
3 |
0.7 |
4.1 |
3.1 |
5.9 |
85.3 |
0.9 |
|
|
4 |
4.5 |
4.6 |
2.2 |
7.1 |
80.9 |
0.6 |
|
|
5 |
2.5 |
7.2 |
5.3 |
19.6 |
64.4 |
0.9 |
|
|
6 |
13.3 |
5.8 |
2.7 |
12.6 |
65.0 |
0.7 |
|
|
Total |
3.0 |
4.3 |
3.1 |
8.0 |
80.9 |
0.8 |
|
|
50s |
1 |
0.2 |
2.1 |
2.6 |
3.2 |
90.9 |
1.0 |
|
2 |
0.5 |
3.2 |
3.1 |
3.9 |
88.6 |
0.7 |
|
|
3 |
0.8 |
4.3 |
3.8 |
5.1 |
85.2 |
0.8 |
|
|
4 |
1.7 |
3.1 |
2.4 |
3.6 |
88.9 |
0.4 |
|
|
5 |
3.1 |
2.9 |
2.7 |
5.6 |
85.0 |
0.7 |
|
|
6 |
4.8 |
7.4 |
6.8 |
17.3 |
63.0 |
0.7 |
|
|
Total |
1.6 |
3.6 |
3.2 |
5.3 |
85.6 |
0.7 |
|
|
60s |
1 |
0.1 |
2.2 |
1.1 |
4.5 |
90.5 |
1.5 |
|
2 |
0.4 |
2.8 |
2.4 |
3.5 |
89.9 |
0.9 |
|
|
3 |
0.5 |
3.9 |
3.6 |
5.3 |
86.0 |
0.8 |
|
|
4 |
0.9 |
1.6 |
1.5 |
2.3 |
93.4 |
0.4 |
|
|
5 |
1.4 |
1.6 |
1.7 |
3.1 |
91.7 |
0.6 |
|
|
6 |
3.0 |
6.6 |
3.4 |
10.1 |
76.2 |
0.7 |
|
|
Total |
0.9 |
2.7 |
2.2 |
4.0 |
89.4 |
0.7 |
|
Source: Own work from Encuesta de Características Esenciales de la Población y Viviendas – 2021.
Table A4.1: Age-group-specific clusters’ composition. Ten years age group: 20s.
|
20s |
|||||||
|
Clusters |
1 |
2 |
3 |
4 |
5 |
6 |
Total |
|
Educational attainment |
|||||||
|
Primary and below |
0.8 |
0.2 |
0.0 |
13.9 |
0.7 |
9.7 |
3.6 |
|
Secondary low |
1.7 |
2.4 |
0.8 |
83.9 |
8.8 |
31.9 |
19.5 |
|
Secondary medium |
20.1 |
21.1 |
13.0 |
0.3 |
28.9 |
22.1 |
17.5 |
|
Secondary vocational |
1.1 |
5.6 |
30.7 |
0.3 |
20.7 |
10.1 |
12.2 |
|
Tertiary vocational |
3.2 |
12.2 |
33.6 |
0.3 |
22.5 |
9.8 |
14.9 |
|
Tertiary low |
14.7 |
21.7 |
17.3 |
0.8 |
11.7 |
7.3 |
13.3 |
|
Tertiary medium |
39.3 |
23.8 |
3.6 |
0.4 |
4.6 |
5.4 |
12.6 |
|
Tertiary upper |
19.2 |
13.0 |
1.0 |
0.1 |
2.2 |
3.8 |
6.4 |
|
Tenure status |
|||||||
|
Inherited |
4.5 |
6.6 |
7.4 |
10.9 |
12.8 |
5.9 |
8.1 |
|
Owner <20% |
18.5 |
21.7 |
27.5 |
13.6 |
4.6 |
0.6 |
15.8 |
|
Owner <35% |
1.7 |
3.4 |
18.3 |
7.2 |
7.6 |
0.7 |
7.1 |
|
Owner >35% |
2.1 |
1.3 |
0.4 |
2.6 |
7.7 |
15.9 |
4.3 |
|
Owner other |
3.2 |
6.7 |
6.9 |
8.6 |
13.1 |
10.9 |
8.2 |
|
Owner paid |
57.3 |
47.2 |
24.4 |
29.5 |
37.3 |
15.5 |
35.6 |
|
Tenant <20% |
6.0 |
6.5 |
5.9 |
13.1 |
3.7 |
2.6 |
6.4 |
|
Tenant <35% |
2.1 |
5.6 |
9.1 |
11.3 |
8.7 |
2.2 |
6.9 |
|
Tenant >35% |
4.6 |
0.9 |
0.0 |
3.3 |
4.5 |
45.7 |
7.5 |
|
Household income |
|||||||
|
<1000 |
1.7 |
1.7 |
0.0 |
9.5 |
16.3 |
81.7 |
14.7 |
|
1000-1500 |
3.4 |
9.5 |
17.7 |
32.8 |
41.6 |
12.4 |
19.7 |
|
1500-2000 |
6.0 |
15.2 |
28.4 |
22.1 |
22.6 |
4.9 |
17.8 |
|
2000-2500 |
5.9 |
16.7 |
28.0 |
15.2 |
11.1 |
0.5 |
14.5 |
|
2500-3000 |
8.1 |
18.8 |
17.7 |
9.2 |
5.8 |
0.4 |
11.4 |
|
3000-5000 |
41.0 |
31.3 |
8.0 |
8.3 |
2.4 |
0.1 |
15.7 |
|
>5000 |
34.0 |
6.8 |
0.3 |
2.8 |
0.2 |
0.1 |
6.3 |
|
Occupation |
|||||||
|
Unemployed |
7.1 |
8.2 |
3.7 |
21.1 |
33.8 |
45.5 |
18.0 |
|
Inactive |
1.5 |
1.1 |
0.8 |
6.9 |
1.9 |
3.7 |
2.5 |
|
Students |
46.2 |
40.0 |
22.9 |
3.9 |
40.9 |
31.8 |
30.8 |
|
Elementary |
0.6 |
0.0 |
0.0 |
62.4 |
0.0 |
6.5 |
10.8 |
|
Housework |
0.1 |
0.2 |
0.3 |
5.3 |
0.5 |
2.9 |
1.4 |
|
Service |
5.8 |
9.1 |
23.8 |
0.0 |
5.9 |
2.1 |
8.8 |
|
Education, Arts and Humanitites |
7.7 |
12.3 |
9.3 |
0.1 |
4.7 |
2.1 |
6.7 |
|
Social Sciences |
9.3 |
7.5 |
5.7 |
0.1 |
3.1 |
1.4 |
4.7 |
|
Bussines and Law |
9.1 |
7.0 |
5.6 |
0.1 |
2.1 |
1.0 |
4.3 |
|
Sciences, Technology and Engineering |
12.7 |
14.6 |
28.0 |
0.0 |
7.1 |
3.0 |
12.0 |
|
Urbanization |
|||||||
|
Less than 50k |
19.7 |
38.1 |
57.3 |
56.2 |
52.5 |
37.4 |
44.8 |
|
50 to 100k |
10.8 |
13.1 |
12.5 |
13.6 |
15.4 |
16.1 |
13.5 |
|
100 to 500k |
21.8 |
26.5 |
23.9 |
18.6 |
23.4 |
25.6 |
23.6 |
|
500k or more |
47.7 |
22.3 |
6.4 |
11.6 |
8.6 |
20.9 |
18.1 |
|
Parental educational attainment |
|||||||
|
Primary and below |
2.0 |
9.1 |
12.4 |
37.0 |
16.4 |
26.8 |
16.7 |
|
Secondary low |
3.4 |
22.3 |
44.6 |
46.9 |
41.3 |
35.9 |
33.1 |
|
Secondary medium |
4.7 |
15.5 |
15.9 |
4.9 |
15.2 |
11.4 |
12.0 |
|
Secondary vocational |
3.1 |
12.9 |
14.6 |
5.4 |
13.4 |
8.9 |
10.5 |
|
Tertiary vocational |
3.2 |
10.0 |
8.7 |
2.1 |
7.9 |
3.7 |
6.6 |
|
Tertiary low |
17.6 |
14.1 |
2.7 |
2.0 |
3.6 |
5.2 |
7.5 |
|
Tertiary upper |
66.0 |
16.1 |
1.1 |
1.7 |
2.1 |
8.1 |
13.6 |
|
Multiple real state properties |
|||||||
|
No |
45.5 |
75.4 |
95.1 |
91.1 |
96.5 |
96.0 |
84.1 |
|
Yes |
54.5 |
24.6 |
4.9 |
8.9 |
3.5 |
4.0 |
15.9 |
|
Total |
16.2 |
22.0 |
16.1 |
17.6 |
13.1 |
15.1 |
100.0 |
Source: Own work from Encuesta de Características Esenciales de la Población y Viviendas – 2021
Table A4.2. Age-group-specific clusters’ composition. Ten years age group: 30s
|
30s |
|||||||
|
Clusters |
1 |
2 |
3 |
4 |
5 |
6 |
Total |
|
Educational attainment |
|||||||
|
Primary and below |
0.4 |
0.0 |
0.1 |
13.0 |
0.5 |
26.9 |
5.5 |
|
Secondary low |
0.9 |
0.9 |
1.3 |
85.4 |
3.2 |
66.8 |
25.1 |
|
Secondary medium |
2.3 |
8.9 |
13.8 |
0.4 |
21.5 |
1.8 |
8.3 |
|
Secondary vocational |
0.9 |
5.2 |
35.4 |
0.3 |
18.5 |
1.6 |
12.3 |
|
Tertiary vocational |
1.9 |
10.9 |
31.1 |
0.2 |
16.6 |
0.6 |
12.3 |
|
Tertiary low |
9.0 |
24.6 |
14.9 |
0.4 |
14.7 |
1.0 |
12.1 |
|
Tertiary medium |
48.0 |
33.4 |
2.4 |
0.3 |
15.3 |
0.9 |
15.4 |
|
Tertiary upper |
36.7 |
16.0 |
1.0 |
0.0 |
9.7 |
0.3 |
9.1 |
|
Tenure status |
|||||||
|
Inherited |
6.2 |
6.2 |
7.9 |
8.1 |
6.5 |
10.3 |
7.5 |
|
Owner <20% |
26.0 |
34.9 |
24.8 |
24.9 |
0.7 |
1.0 |
22.2 |
|
Owner <35% |
1.3 |
6.8 |
21.1 |
13.8 |
1.7 |
1.4 |
10.0 |
|
Owner >35% |
0.7 |
0.9 |
1.8 |
1.6 |
14.5 |
12.5 |
3.9 |
|
Owner other |
8.4 |
10.6 |
11.4 |
9.5 |
17.4 |
14.1 |
11.4 |
|
Owner paid |
30.6 |
21.4 |
13.1 |
20.4 |
12.2 |
16.8 |
18.7 |
|
Tenant <20% |
13.6 |
9.6 |
5.2 |
10.6 |
1.4 |
3.8 |
7.7 |
|
Tenant <35% |
8.3 |
9.6 |
14.4 |
11.1 |
4.9 |
6.8 |
10.2 |
|
Tenant >35% |
4.8 |
0.0 |
0.1 |
0.0 |
40.7 |
33.3 |
8.4 |
|
Household income |
|||||||
|
<1000 |
2.2 |
0.4 |
1.4 |
3.9 |
58.4 |
65.6 |
14.5 |
|
1000-1500 |
4.3 |
8.9 |
24.3 |
28.9 |
25.7 |
26.9 |
19.9 |
|
1500-2000 |
6.4 |
16.0 |
28.8 |
25.5 |
8.4 |
5.0 |
18.1 |
|
2000-2500 |
7.6 |
18.1 |
25.3 |
19.3 |
3.2 |
1.0 |
15.6 |
|
2500-3000 |
10.5 |
22.0 |
14.7 |
11.4 |
2.8 |
0.6 |
12.5 |
|
3000-5000 |
44.2 |
31.0 |
5.4 |
8.1 |
1.2 |
0.5 |
15.2 |
|
>5000 |
24.8 |
3.7 |
0.0 |
2.9 |
0.4 |
0.3 |
4.3 |
|
Occupation |
|||||||
|
Unemployed |
7.1 |
6.0 |
12.0 |
8.0 |
38.6 |
50.5 |
16.1 |
|
Inactive |
2.5 |
2.4 |
1.8 |
5.5 |
2.8 |
7.5 |
3.4 |
|
Students |
2.9 |
1.5 |
0.9 |
0.2 |
3.7 |
0.8 |
1.4 |
|
Elementary |
0.4 |
0.1 |
0.0 |
81.0 |
0.0 |
33.3 |
19.9 |
|
Housework |
1.4 |
1.2 |
1.6 |
5.4 |
2.6 |
7.9 |
3.0 |
|
Service |
10.8 |
15.4 |
24.7 |
0.0 |
11.2 |
0.0 |
12.0 |
|
Education, Arts and Humanitites |
17.3 |
20.7 |
8.9 |
0.0 |
10.9 |
0.0 |
10.0 |
|
Social Sciences |
18.4 |
15.4 |
7.4 |
0.0 |
7.4 |
0.0 |
8.2 |
|
Bussines and Law |
16.7 |
11.1 |
7.5 |
0.0 |
6.9 |
0.0 |
7.0 |
|
Sciences, Technology and Engineering |
22.5 |
26.3 |
35.2 |
0.0 |
16.0 |
0.0 |
18.9 |
|
Urbanization |
|||||||
|
Less than 50k |
18.8 |
39.6 |
54.3 |
58.3 |
34.0 |
50.2 |
45.1 |
|
50 to 100k |
10.1 |
13.4 |
13.6 |
13.2 |
15.1 |
16.5 |
13.5 |
|
100 to 500k |
18.7 |
26.6 |
25.2 |
20.9 |
26.8 |
21.0 |
23.7 |
|
500k or more |
52.4 |
20.4 |
6.9 |
7.7 |
24.0 |
12.3 |
17.7 |
|
Parental educational attainment |
|||||||
|
Primary and below |
9.1 |
26.4 |
32.2 |
54.8 |
25.1 |
60.6 |
34.9 |
|
Secondary low |
7.3 |
26.2 |
38.2 |
33.0 |
26.6 |
29.6 |
28.8 |
|
Secondary medium |
6.1 |
13.1 |
13.5 |
5.0 |
14.1 |
3.5 |
9.9 |
|
Secondary vocational |
5.5 |
9.8 |
9.1 |
3.0 |
12.1 |
3.3 |
7.4 |
|
Tertiary vocational |
4.4 |
6.4 |
4.5 |
1.5 |
6.3 |
0.6 |
4.1 |
|
Tertiary low |
16.8 |
9.6 |
2.2 |
1.2 |
7.3 |
1.2 |
5.8 |
|
Tertiary upper |
50.8 |
8.6 |
0.5 |
1.5 |
8.5 |
1.2 |
9.1 |
|
Multiple real state properties |
|||||||
|
No |
70.9 |
87.4 |
97.7 |
92.4 |
96.6 |
96.9 |
91.1 |
|
Yes |
29.1 |
12.6 |
2.3 |
7.6 |
3.4 |
3.1 |
8.9 |
|
Total |
18.1 |
22.0 |
19.7 |
17.2 |
12.8 |
10.2 |
100.0 |
Source: Own work from Encuesta de Características Esenciales de la Población y Viviendas – 2021.
Table A4.3. Age-group-specific clusters’ composition. Ten years age group: 40s
|
40s |
|||||||
|
Clusters |
1 |
2 |
3 |
4 |
5 |
6 |
Total |
|
Educational attainment |
|||||||
|
Primary and below |
0.4 |
0.1 |
0.0 |
13.3 |
0.5 |
30.0 |
6.2 |
|
Secondary low |
0.4 |
0.4 |
0.9 |
84.4 |
4.0 |
66.2 |
25.9 |
|
Secondary medium |
3.6 |
12.9 |
18.2 |
0.4 |
27.3 |
1.1 |
10.7 |
|
Secondary vocational |
0.7 |
5.8 |
31.7 |
0.8 |
19.7 |
0.8 |
11.2 |
|
Tertiary vocational |
2.0 |
11.9 |
30.9 |
0.4 |
17.4 |
0.3 |
12.1 |
|
Tertiary low |
11.5 |
27.2 |
14.8 |
0.4 |
12.8 |
0.7 |
12.4 |
|
Tertiary medium |
54.1 |
33.6 |
3.1 |
0.3 |
15.2 |
0.8 |
16.2 |
|
Tertiary upper |
27.4 |
8.1 |
0.4 |
0.0 |
3.2 |
0.0 |
5.4 |
|
Tenure status |
|||||||
|
Inherited |
4.4 |
5.6 |
6.5 |
8.0 |
7.3 |
12.1 |
7.1 |
|
Owner <20% |
40.5 |
44.1 |
27.2 |
25.9 |
1.1 |
2.2 |
26.9 |
|
Owner <35% |
3.5 |
8.5 |
27.2 |
15.8 |
3.0 |
2.7 |
12.7 |
|
Owner >35% |
2.3 |
1.1 |
2.7 |
2.1 |
25.2 |
15.5 |
5.9 |
|
Owner other |
7.8 |
7.5 |
9.4 |
8.7 |
11.6 |
12.0 |
9.1 |
|
Owner paid |
26.2 |
23.1 |
14.9 |
24.1 |
14.1 |
21.5 |
20.6 |
|
Tenant <20% |
7.5 |
5.4 |
3.3 |
7.7 |
1.5 |
5.3 |
5.2 |
|
Tenant <35% |
3.8 |
4.7 |
8.8 |
7.7 |
3.5 |
6.5 |
6.3 |
|
Tenant >35% |
3.9 |
0.0 |
0.0 |
0.0 |
32.6 |
22.2 |
6.3 |
|
Household income |
|||||||
|
<1000 |
1.1 |
0.2 |
0.6 |
1.4 |
54.1 |
64.1 |
13.2 |
|
1000-1500 |
3.0 |
7.2 |
23.1 |
28.8 |
26.9 |
25.1 |
19.0 |
|
1500-2000 |
4.6 |
13.3 |
29.1 |
26.2 |
11.8 |
7.3 |
18.0 |
|
2000-2500 |
4.2 |
17.4 |
25.5 |
19.6 |
3.0 |
1.5 |
15.1 |
|
2500-3000 |
10.5 |
20.8 |
16.5 |
13.1 |
2.2 |
0.9 |
12.9 |
|
3000-5000 |
47.5 |
37.3 |
5.2 |
8.4 |
1.4 |
0.6 |
17.0 |
|
>5000 |
29.2 |
3.8 |
0.0 |
2.5 |
0.6 |
0.5 |
4.8 |
|
Occupation |
|||||||
|
Unemployed |
4.1 |
3.9 |
9.0 |
5.9 |
43.6 |
45.0 |
14.1 |
|
Inactive |
2.3 |
2.0 |
2.8 |
6.7 |
4.0 |
10.8 |
4.4 |
|
Students |
0.5 |
0.2 |
0.2 |
0.0 |
1.1 |
0.3 |
0.3 |
|
Elementary |
0.2 |
0.0 |
0.0 |
79.9 |
0.0 |
34.6 |
20.8 |
|
Housework |
1.6 |
1.7 |
2.4 |
7.4 |
3.7 |
9.3 |
4.1 |
|
Service |
11.4 |
13.1 |
22.1 |
0.0 |
10.5 |
0.0 |
10.5 |
|
Education, Arts and Humanitites |
16.0 |
19.5 |
8.9 |
0.0 |
9.6 |
0.0 |
9.3 |
|
Social Sciences |
19.4 |
15.4 |
7.8 |
0.0 |
7.3 |
0.0 |
8.3 |
|
Bussines and Law |
20.7 |
15.3 |
9.3 |
0.0 |
5.7 |
0.0 |
8.6 |
|
Sciences, Technology and Engineering |
23.8 |
28.8 |
37.6 |
0.0 |
14.4 |
0.0 |
19.5 |
|
Urbanization |
|||||||
|
Less than 50k |
19.3 |
40.7 |
53.7 |
61.1 |
34.7 |
54.5 |
46.5 |
|
50 to 100k |
11.7 |
13.8 |
14.0 |
12.6 |
15.2 |
13.7 |
13.5 |
|
100 to 500k |
23.5 |
27.8 |
25.7 |
19.2 |
28.1 |
20.4 |
24.2 |
|
500k or more |
45.5 |
17.8 |
6.6 |
7.0 |
22.0 |
11.4 |
15.7 |
|
Parental educational attainment |
|||||||
|
Primary and below |
23.1 |
44.0 |
47.6 |
72.9 |
40.5 |
75.2 |
51.6 |
|
Secondary low |
9.3 |
23.2 |
31.9 |
20.4 |
24.3 |
18.6 |
22.7 |
|
Secondary medium |
6.2 |
9.1 |
8.1 |
2.8 |
10.6 |
1.9 |
6.6 |
|
Secondary vocational |
5.8 |
7.9 |
6.8 |
1.5 |
7.9 |
1.6 |
5.4 |
|
Tertiary vocational |
3.0 |
3.8 |
3.6 |
0.6 |
4.0 |
0.5 |
2.6 |
|
Tertiary low |
13.7 |
6.9 |
1.7 |
0.9 |
5.8 |
1.0 |
4.4 |
|
Tertiary upper |
38.9 |
5.1 |
0.4 |
1.1 |
6.9 |
1.1 |
6.7 |
|
Multiple real state properties |
|||||||
|
No |
66.2 |
84.5 |
97.3 |
90.4 |
95.7 |
96.3 |
89.2 |
|
Yes |
33.8 |
15.5 |
2.7 |
9.6 |
4.3 |
3.7 |
10.8 |
|
Total |
15.8 |
20.5 |
18.4 |
19.2 |
12.9 |
13.1 |
100.0 |
Source: Own work from Encuesta de Características Esenciales de la Población y Viviendas – 2021.
Table A4.4. Age-group-specific clusters’ composition. Ten years age group: 50s
|
50s |
|||||||
|
Clusters |
1 |
2 |
3 |
4 |
5 |
6 |
Total |
|
Educational attainment |
|||||||
|
Primary and below |
0.1 |
0.0 |
0.0 |
16.1 |
29.0 |
12.5 |
9.7 |
|
Secondary low |
1.4 |
0.8 |
1.3 |
82.8 |
62.9 |
18.2 |
33.3 |
|
Secondary medium |
5.5 |
19.4 |
23.5 |
0.3 |
3.1 |
26.2 |
12.0 |
|
Secondary vocational |
1.4 |
9.8 |
38.0 |
0.3 |
2.5 |
16.9 |
11.8 |
|
Tertiary vocational |
1.7 |
11.5 |
24.5 |
0.0 |
0.8 |
9.8 |
8.5 |
|
Tertiary low |
14.6 |
23.8 |
9.9 |
0.2 |
0.6 |
6.4 |
8.9 |
|
Tertiary medium |
54.1 |
29.2 |
2.4 |
0.2 |
1.0 |
7.7 |
12.4 |
|
Tertiary upper |
21.2 |
5.5 |
0.3 |
0.0 |
0.1 |
2.2 |
3.4 |
|
Tenure status |
|||||||
|
Inherited |
5.4 |
6.4 |
10.4 |
11.3 |
18.2 |
7.6 |
10.3 |
|
Owner <20% |
25.0 |
25.9 |
19.0 |
18.0 |
3.3 |
0.8 |
16.9 |
|
Owner <35% |
2.4 |
5.0 |
17.1 |
9.6 |
4.2 |
1.2 |
8.0 |
|
Owner >35% |
2.8 |
2.1 |
4.1 |
0.9 |
9.3 |
22.0 |
5.0 |
|
Owner other |
3.6 |
5.9 |
8.0 |
7.0 |
9.2 |
11.6 |
7.4 |
|
Owner paid |
53.9 |
47.8 |
31.9 |
44.5 |
41.6 |
17.8 |
40.9 |
|
Tenant <20% |
3.6 |
3.2 |
2.8 |
4.7 |
4.3 |
1.0 |
3.6 |
|
Tenant <35% |
2.1 |
3.2 |
6.1 |
3.9 |
3.6 |
1.9 |
3.8 |
|
Tenant >35% |
1.3 |
0.5 |
0.5 |
0.0 |
6.2 |
36.1 |
4.2 |
|
Household income |
|||||||
|
<1000 |
1.9 |
1.4 |
2.7 |
0.5 |
48.3 |
78.0 |
14.8 |
|
1000-1500 |
2.6 |
7.3 |
23.1 |
26.3 |
32.1 |
16.2 |
19.6 |
|
1500-2000 |
3.3 |
13.0 |
28.1 |
25.0 |
10.7 |
3.8 |
17.3 |
|
2000-2500 |
4.3 |
16.5 |
24.3 |
20.1 |
3.8 |
0.9 |
14.7 |
|
2500-3000 |
7.6 |
20.3 |
15.6 |
13.0 |
2.5 |
0.7 |
11.9 |
|
3000-5000 |
41.3 |
35.2 |
6.1 |
11.3 |
1.6 |
0.4 |
15.6 |
|
>5000 |
39.0 |
6.3 |
0.1 |
3.8 |
1.0 |
0.0 |
6.2 |
|
Occupation |
|||||||
|
Unemployed |
4.1 |
5.6 |
10.9 |
1.7 |
42.4 |
58.7 |
15.4 |
|
Inactive |
5.9 |
5.2 |
5.3 |
9.8 |
15.9 |
9.2 |
8.4 |
|
Students |
0.1 |
0.1 |
0.2 |
0.0 |
0.0 |
0.5 |
0.1 |
|
Elementary |
0.4 |
0.0 |
0.0 |
77.7 |
26.8 |
1.2 |
24.6 |
|
Housework |
3.6 |
3.2 |
4.2 |
10.8 |
14.7 |
5.1 |
7.4 |
|
Service |
10.5 |
12.0 |
21.2 |
0.0 |
0.0 |
5.0 |
8.2 |
|
Education, Arts and Humanitites |
19.3 |
21.9 |
9.5 |
0.0 |
0.0 |
6.7 |
8.8 |
|
Social Sciences |
16.2 |
13.0 |
7.1 |
0.0 |
0.0 |
4.2 |
6.0 |
|
Bussines and Law |
19.9 |
15.8 |
7.9 |
0.0 |
0.0 |
2.7 |
7.0 |
|
Sciences, Technology and Engineering |
19.9 |
23.2 |
33.8 |
0.0 |
0.0 |
6.6 |
14.1 |
|
Urbanization |
|||||||
|
Less than 50k |
18.9 |
37.4 |
50.8 |
59.3 |
60.1 |
35.7 |
47.5 |
|
50 to 100k |
12.2 |
13.7 |
13.5 |
11.6 |
12.2 |
16.4 |
12.9 |
|
100 to 500k |
24.7 |
26.4 |
27.1 |
20.0 |
18.2 |
26.0 |
23.4 |
|
500k or more |
44.2 |
22.5 |
8.5 |
9.1 |
9.5 |
21.8 |
16.2 |
|
Parental educational attainment |
|||||||
|
Primary and below |
34.2 |
55.6 |
60.0 |
83.3 |
85.3 |
54.5 |
66.2 |
|
Secondary low |
9.7 |
17.7 |
23.1 |
12.8 |
10.5 |
17.1 |
15.6 |
|
Secondary medium |
5.1 |
6.9 |
6.2 |
1.3 |
1.2 |
8.0 |
4.3 |
|
Secondary vocational |
5.3 |
5.8 |
6.0 |
1.0 |
1.0 |
7.3 |
3.9 |
|
Tertiary vocational |
3.4 |
3.1 |
2.7 |
0.3 |
0.3 |
2.9 |
1.9 |
|
Tertiary low |
12.9 |
5.7 |
1.7 |
0.8 |
0.6 |
5.2 |
3.4 |
|
Tertiary upper |
29.5 |
5.1 |
0.3 |
0.5 |
1.1 |
5.2 |
4.6 |
|
Multiple real state properties |
|||||||
|
No |
43.2 |
75.1 |
95.3 |
83.5 |
92.9 |
94.2 |
82.7 |
|
Yes |
56.8 |
24.9 |
4.7 |
16.5 |
7.1 |
5.8 |
17.3 |
|
Total |
13.7 |
20.4 |
17.4 |
24.5 |
14.2 |
9.8 |
100.0 |
Source: Own work from Encuesta de Características Esenciales de la Población y Viviendas – 2021.
Table A4.5. Age-group-specific clusters’ composition. Ten years age group: 60s
|
60s |
|||||||
|
Clusters |
1 |
2 |
3 |
4 |
5 |
6 |
Total |
|
Educational attainment |
|||||||
|
Primary and below |
1.2 |
0.3 |
0.1 |
23.5 |
48.1 |
26.4 |
18.2 |
|
Secondary low |
2.3 |
1.6 |
3.1 |
74.3 |
47.9 |
25.4 |
34.1 |
|
Secondary medium |
5.9 |
22.0 |
28.1 |
0.2 |
1.8 |
19.6 |
11.3 |
|
Secondary vocational |
1.1 |
9.9 |
33.8 |
0.4 |
0.7 |
11.7 |
8.9 |
|
Tertiary vocational |
1.1 |
7.9 |
18.0 |
0.1 |
0.4 |
6.8 |
5.2 |
|
Tertiary low |
13.6 |
26.4 |
13.3 |
1.0 |
0.5 |
4.4 |
8.8 |
|
Tertiary medium |
52.3 |
27.2 |
3.2 |
0.5 |
0.6 |
4.6 |
10.5 |
|
Tertiary upper |
22.5 |
4.8 |
0.4 |
0.0 |
0.1 |
1.2 |
3.0 |
|
Tenure status |
|||||||
|
Inherited |
5.4 |
7.2 |
12.8 |
13.3 |
20.1 |
13.6 |
12.7 |
|
Owner <20% |
14.6 |
13.8 |
9.2 |
10.0 |
1.9 |
1.0 |
8.7 |
|
Owner <35% |
1.5 |
3.3 |
13.5 |
5.8 |
2.2 |
1.5 |
5.3 |
|
Owner >35% |
2.2 |
1.5 |
4.6 |
0.5 |
5.5 |
17.4 |
3.9 |
|
Owner other |
2.3 |
3.9 |
7.3 |
5.2 |
9.1 |
10.9 |
6.3 |
|
Owner paid |
69.4 |
65.0 |
43.8 |
59.4 |
55.1 |
26.5 |
54.9 |
|
Tenant <20% |
1.6 |
3.1 |
1.9 |
3.3 |
2.3 |
1.5 |
2.5 |
|
Tenant <35% |
0.8 |
1.9 |
5.9 |
2.5 |
2.1 |
0.8 |
2.6 |
|
Tenant >35% |
2.2 |
0.4 |
1.2 |
0.0 |
1.8 |
26.8 |
3.1 |
|
Household income |
|||||||
|
<1000 |
2.4 |
1.9 |
3.8 |
0.4 |
49.2 |
85.3 |
17.7 |
|
1000-1500 |
1.5 |
7.5 |
24.2 |
26.5 |
31.1 |
10.4 |
20.0 |
|
1500-2000 |
4.0 |
14.0 |
26.2 |
26.2 |
10.9 |
2.8 |
17.3 |
|
2000-2500 |
5.0 |
15.9 |
24.4 |
20.2 |
3.4 |
0.7 |
14.1 |
|
2500-3000 |
7.1 |
17.6 |
14.7 |
12.8 |
1.8 |
0.2 |
10.3 |
|
3000-5000 |
40.4 |
37.3 |
6.3 |
11.4 |
2.1 |
0.5 |
14.9 |
|
>5000 |
39.7 |
5.8 |
0.4 |
2.6 |
1.4 |
0.1 |
5.6 |
|
Occupation |
|||||||
|
Unemployed |
2.8 |
5.3 |
14.1 |
2.3 |
27.8 |
62.3 |
14.8 |
|
Inactive |
29.6 |
34.8 |
25.2 |
30.9 |
34.2 |
21.7 |
30.3 |
|
Students |
0.0 |
0.0 |
0.0 |
0.0 |
0.0 |
0.0 |
0.0 |
|
Elementary |
0.4 |
0.0 |
0.2 |
50.8 |
17.8 |
2.1 |
18.7 |
|
Housework |
4.2 |
5.2 |
5.8 |
16.0 |
20.2 |
7.1 |
11.3 |
|
Service |
15.7 |
12.7 |
15.2 |
0.0 |
0.0 |
1.1 |
6.3 |
|
Education, Arts and Humanitites |
13.0 |
16.3 |
9.0 |
0.0 |
0.0 |
2.0 |
5.7 |
|
Social Sciences |
11.9 |
7.6 |
4.6 |
0.0 |
0.0 |
1.4 |
3.3 |
|
Bussines and Law |
11.0 |
7.0 |
6.5 |
0.0 |
0.0 |
1.0 |
3.4 |
|
Sciences, Technology and Engineering |
11.4 |
11.0 |
19.4 |
0.0 |
0.0 |
1.1 |
6.3 |
|
Urbanization |
|||||||
|
Less than 50k |
17.2 |
36.5 |
47.4 |
59.2 |
58.7 |
43.6 |
48.1 |
|
50 to 100k |
11.4 |
14.4 |
14.7 |
10.8 |
12.0 |
15.4 |
12.8 |
|
100 to 500k |
22.5 |
28.4 |
27.5 |
21.1 |
18.3 |
28.2 |
23.7 |
|
500k or more |
48.8 |
20.7 |
10.3 |
8.9 |
11.0 |
12.8 |
15.4 |
|
Parental educational attainment |
|||||||
|
Primary and below |
38.3 |
60.6 |
61.1 |
87.9 |
91.5 |
67.8 |
73.1 |
|
Secondary low |
8.4 |
14.4 |
20.8 |
9.8 |
6.5 |
15.1 |
12.2 |
|
Secondary medium |
6.0 |
5.8 |
6.7 |
0.8 |
0.4 |
5.5 |
3.5 |
|
Secondary vocational |
4.3 |
5.3 |
5.9 |
0.6 |
0.4 |
4.3 |
2.9 |
|
Tertiary vocational |
3.7 |
3.0 |
2.8 |
0.2 |
0.2 |
2.2 |
1.6 |
|
Tertiary low |
12.0 |
6.0 |
2.1 |
0.3 |
0.4 |
2.5 |
2.8 |
|
Tertiary upper |
27.3 |
4.9 |
0.6 |
0.5 |
0.7 |
2.6 |
3.8 |
|
Multiple real state properties |
|||||||
|
No |
30.4 |
61.2 |
93.0 |
76.2 |
88.5 |
95.2 |
76.4 |
|
Yes |
69.6 |
38.8 |
7.0 |
23.8 |
11.5 |
4.8 |
23.6 |
|
Total |
13.6 |
18.9 |
16.6 |
26.2 |
15.9 |
8.7 |
100.0 |
Source: Own work from Encuesta de Características Esenciales de la Población y Viviendas – 2021.
1 This work is part of the doctoral thesis of Carlos Ruiz-Ramos, from the PhD program in Demography at the Universidad Autónoma de Barcelona – Centre d’Estudis Demogràfics.